. 2024 Apr 5;15(1):2939.
doi: 10.1038/s41467-024-47317-1.

Senescent-like macrophages mediate angiogenesis for endplate sclerosis via IL-10 secretion in male mice

Affiliations

Senescent-like macrophages mediate angiogenesis for endplate sclerosis via IL-10 secretion in male mice

Yonggang Fan et al. Nat Commun. .

Abstract

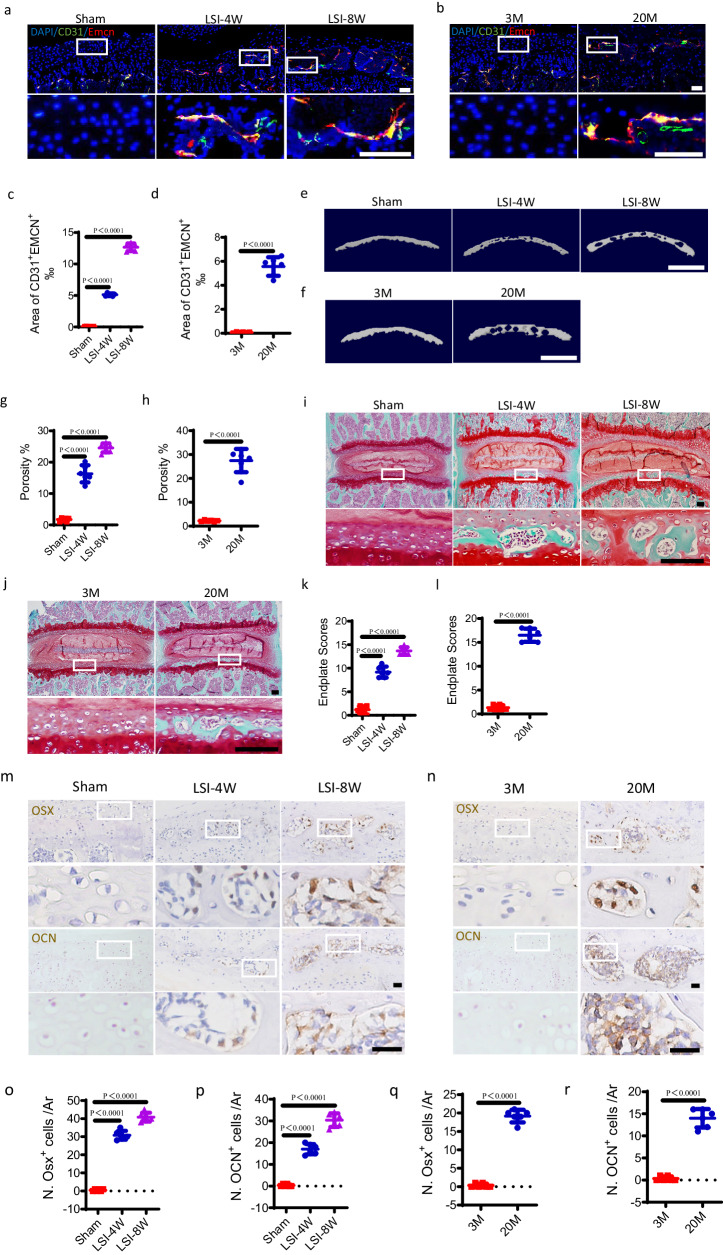
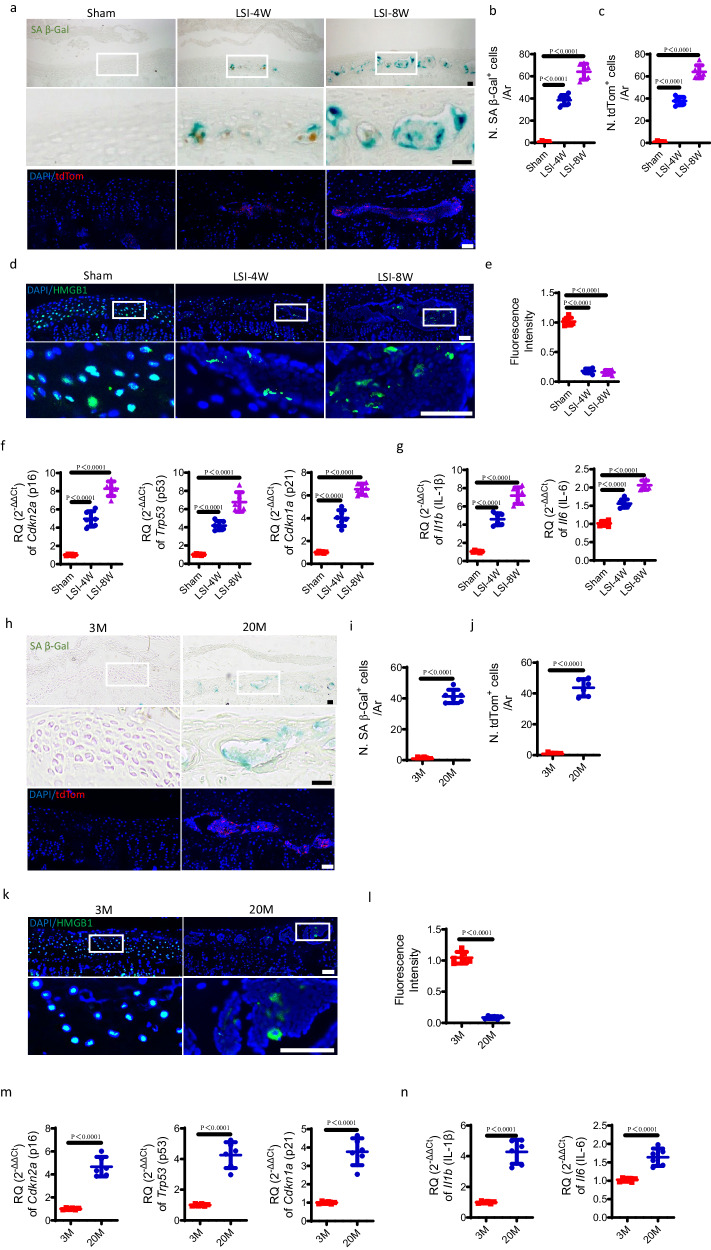
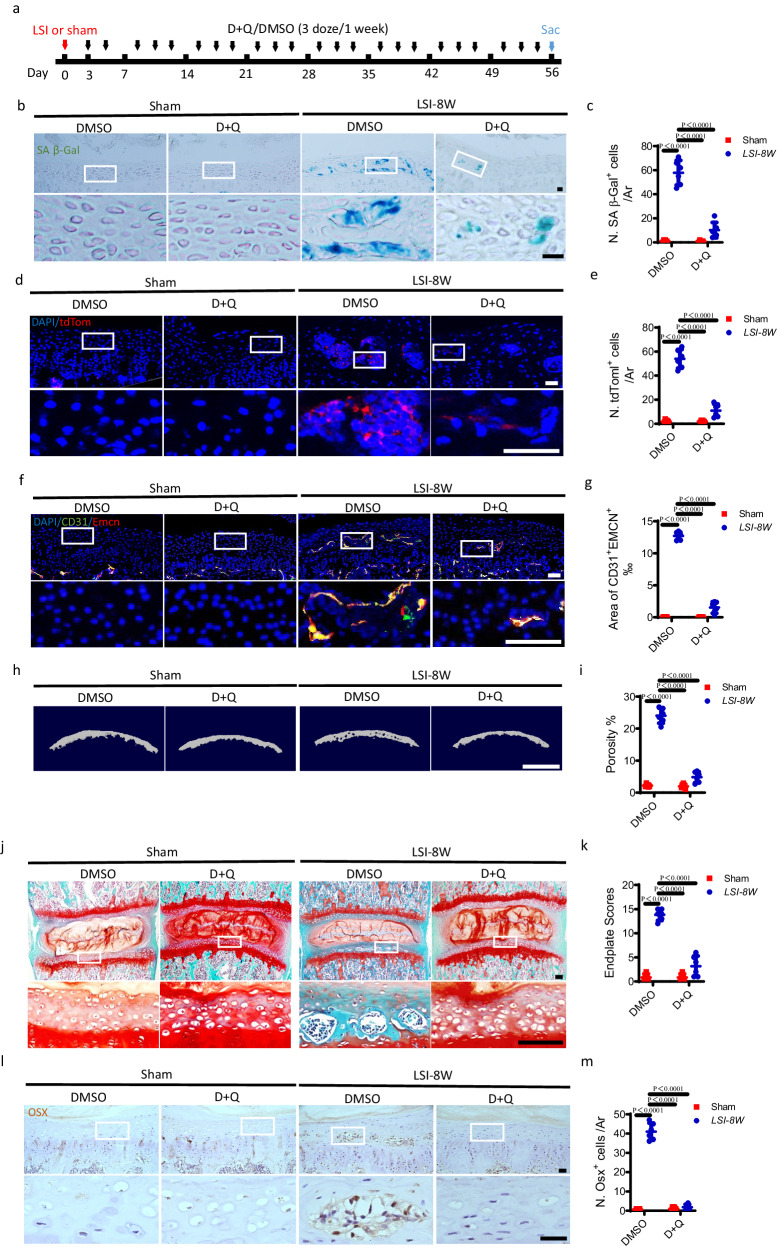
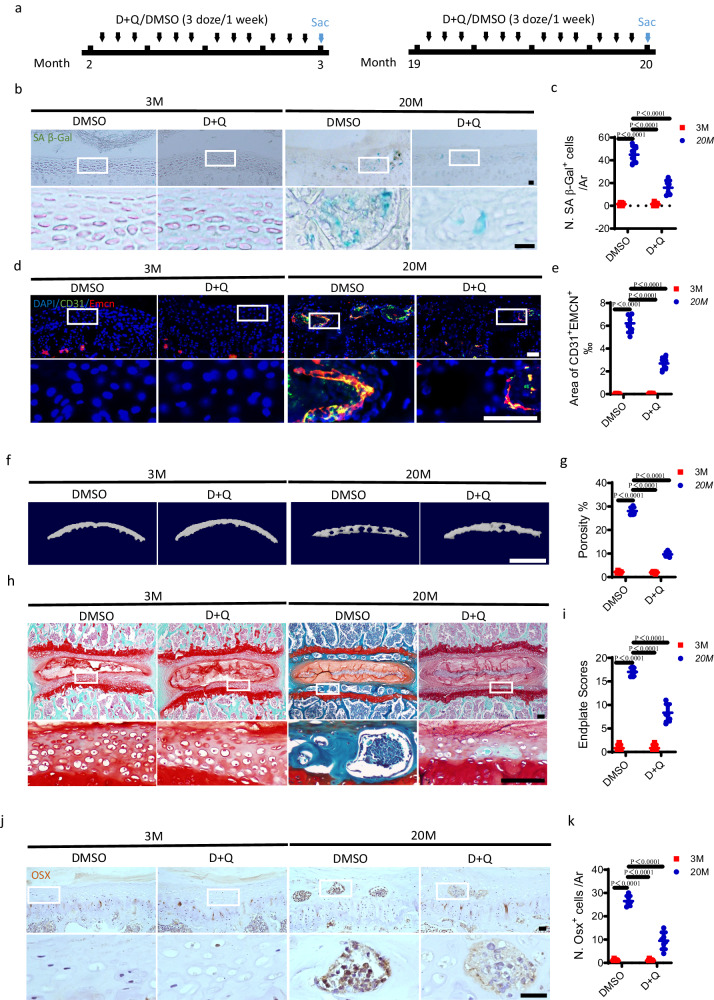
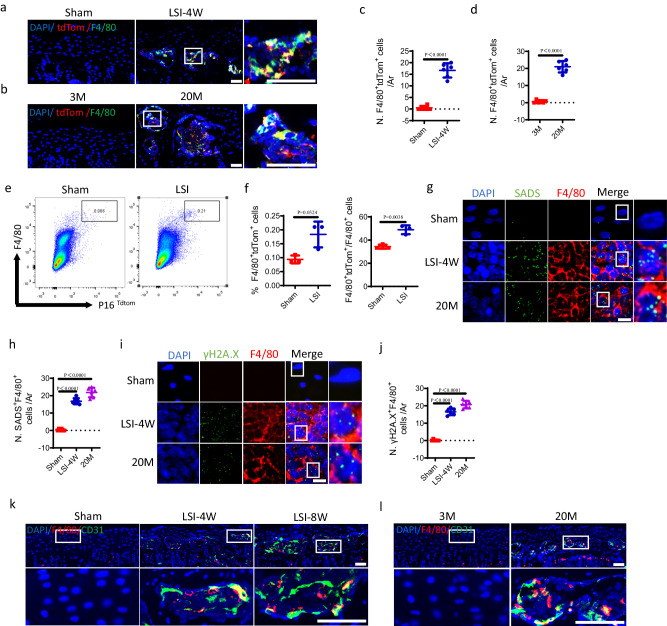
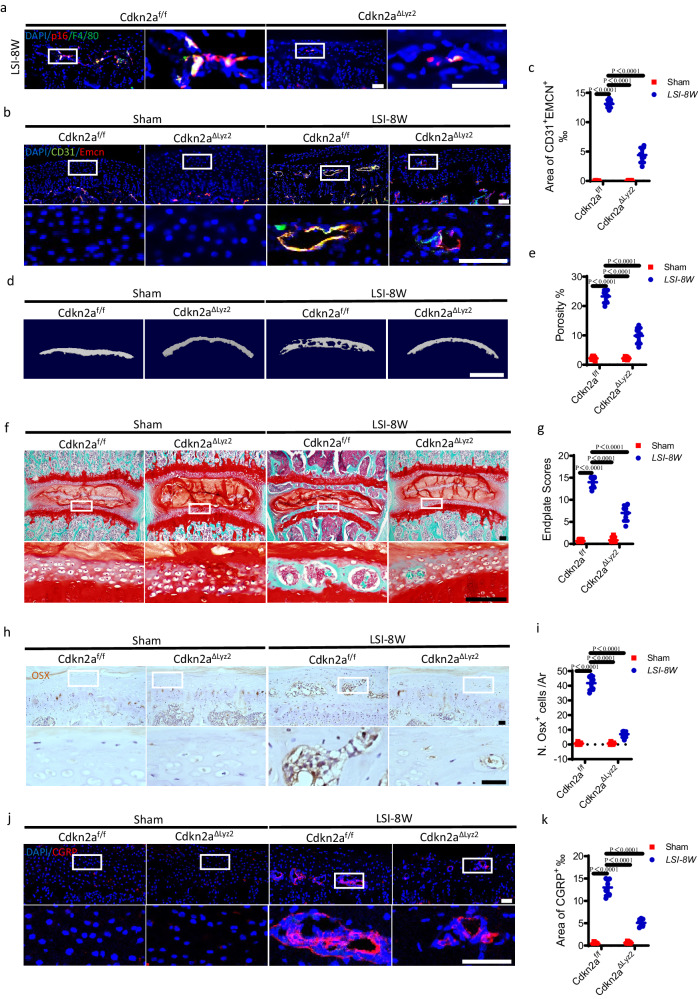
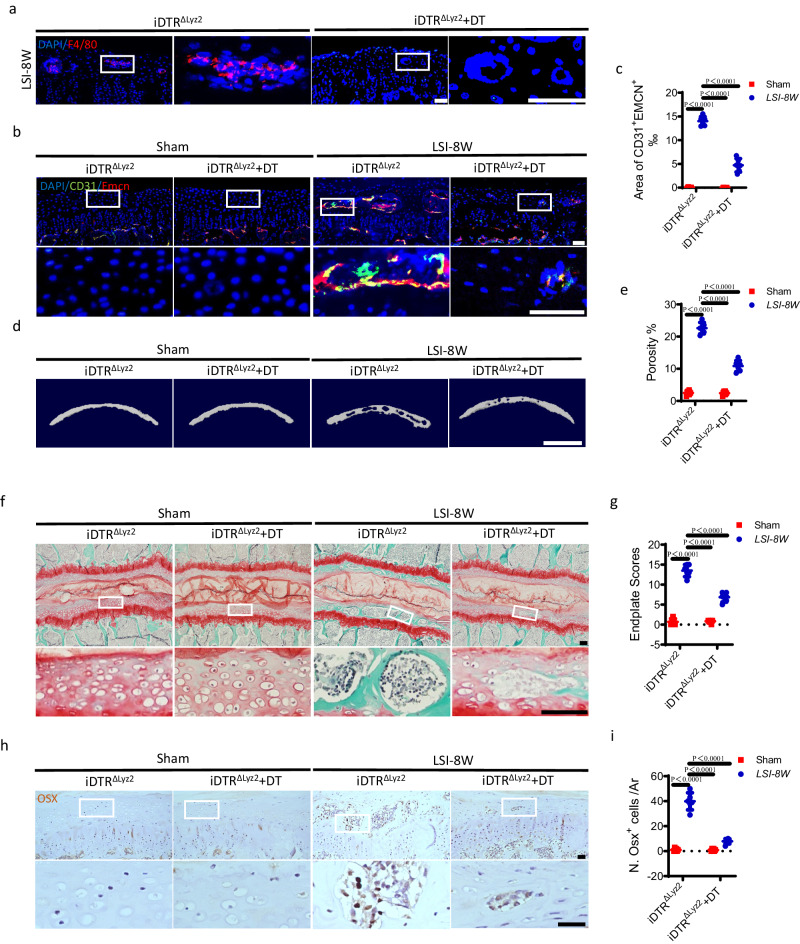
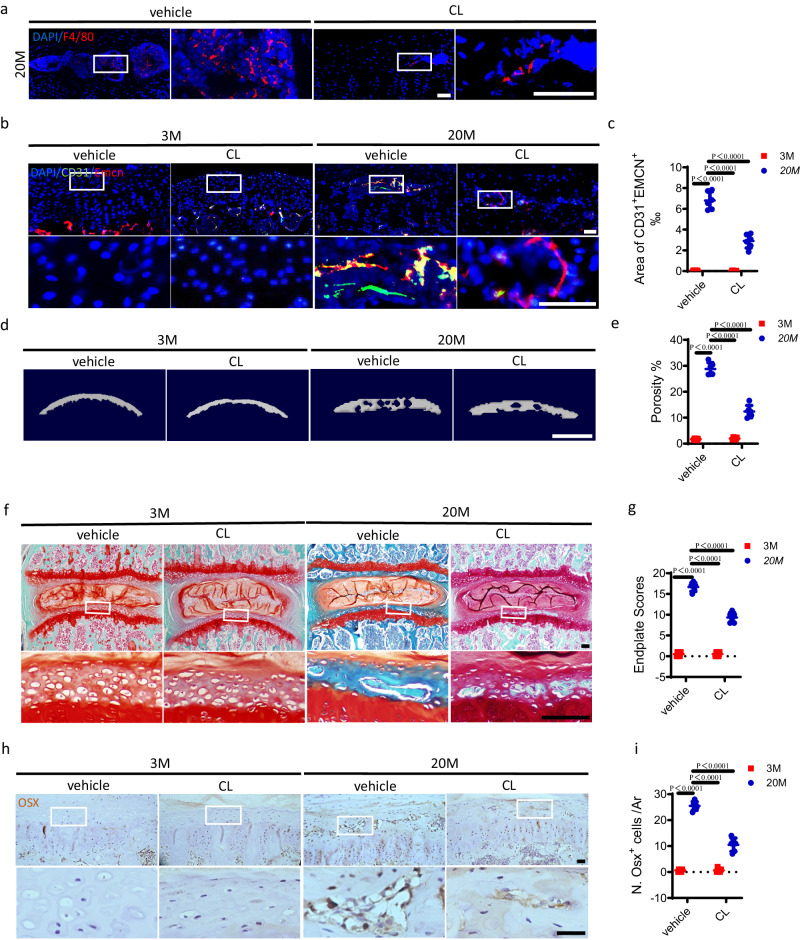
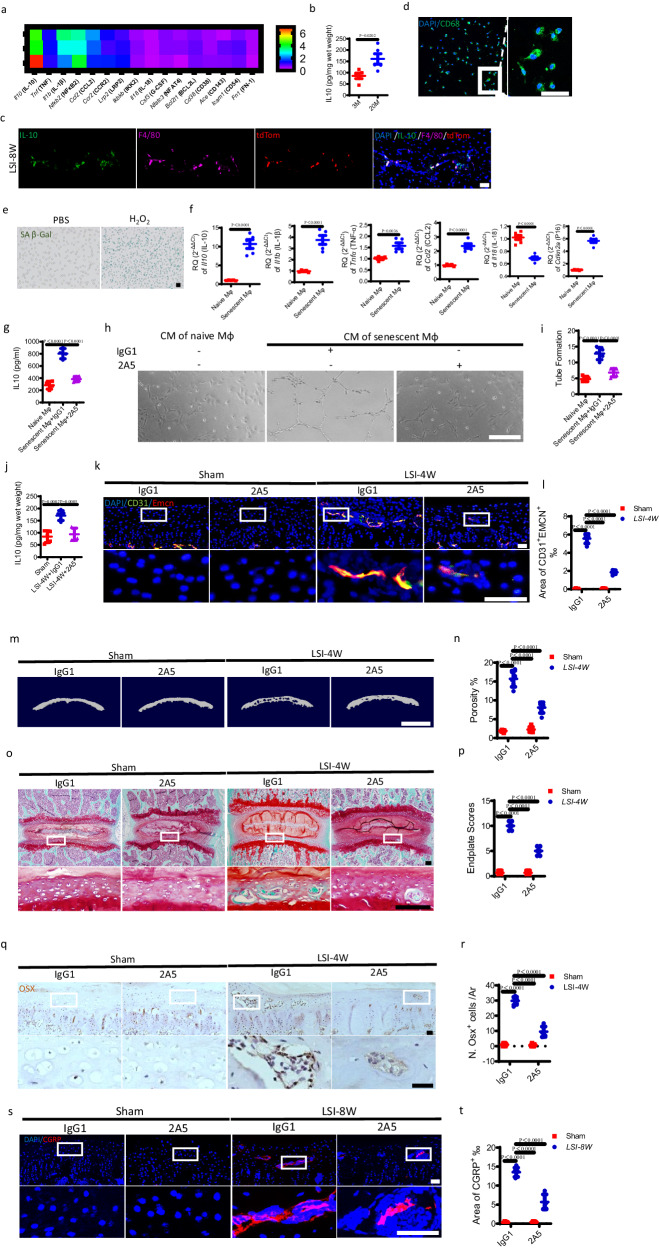
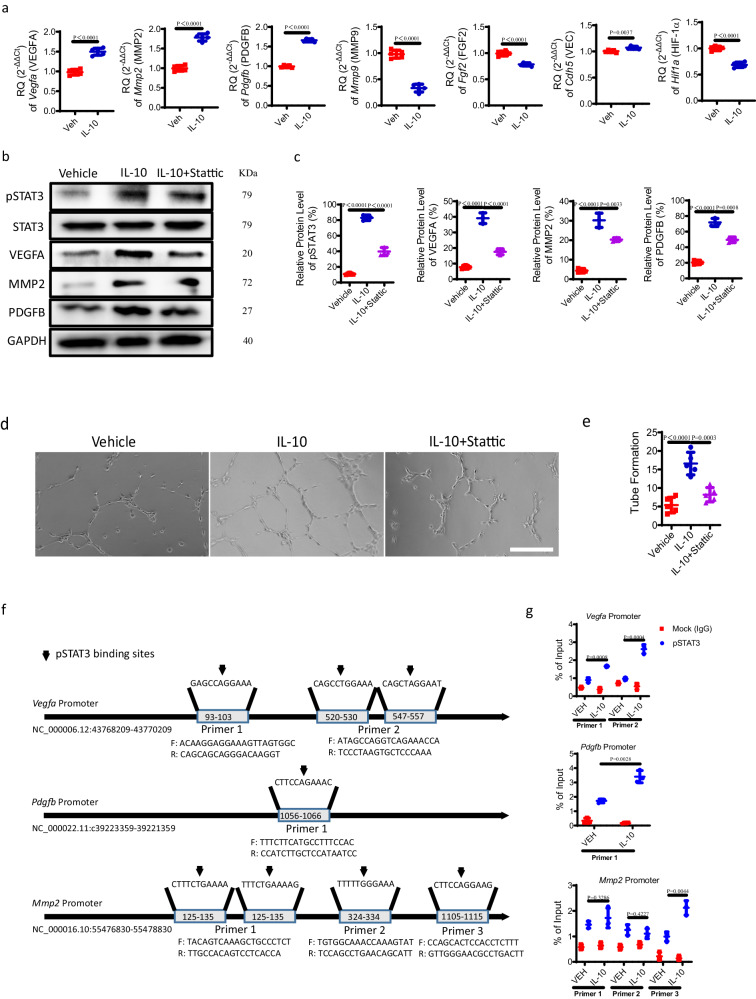
Endplate sclerosis is a notable aspect of spine degeneration or aging, but the mechanisms remain unclear. Here, we report that senescent macrophages accumulate in the sclerotic endplates of lumbar spine instability (LSI) or aging male mouse model. Specifically, knockout of cdkn2a (p16) in macrophages abrogates LSI or aging-induced angiogenesis and sclerosis in the endplates. Furthermore, both in vivo and in vitro studies indicate that IL-10 is the primary elevated cytokine of senescence-related secretory phenotype (SASP). Mechanistically, IL-10 increases pSTAT3 in endothelial cells, leading to pSTAT3 directly binding to the promoters of Vegfa, Mmp2, and Pdgfb to encourage their production, resulting in angiogenesis. This study provides information on understanding the link between immune senescence and endplate sclerosis, which might be useful for therapeutic approaches.


Conflict of interest statement

The authors declare no competing interests.

Figures

Fig. 1
Fig. 1. CD31+Emcn+ vessels appear in sclerotic endplates in LSI and aged mice.
Representative immunofluorescent images of CD31+ (green), Emcn+ (red) cells and DAPI (blue) staining of nuclei in the caudal endplates of L4/5 at 4 and 8 weeks after LSI surgery or sham surgery (a) or in 3-month-old or 20-month-old mice (b). Scale bars, 50 μm. c, d Permillage of CD31+Emcn+ area of a and b. Representative three-dimensional µCT images of the caudal endplates of L4/5 (coronal view) at 4 and 8 weeks after LSI surgery or sham surgery mice (e) or in 3-month-old or 20-month-old mice (f). Scale bars, 500 μm. g, h Quantitative analysis of the total porosity of e and f. Representative images of safranin O and fast green staining of endplate sections at 4 and 8 weeks after LSI or sham surgery (i) or in 3-month-old or 20-month-old mice (j), proteoglycan (red) and cavities (green). Scale bars, 50 μm. k, l Endplate scores as an indication of endplate degeneration based on safranin O and fast green staining. Representative immunohistochemical images of Osterix (Osx, top) or Osteocalcin (Ocn, bottom) in the endplates at 4 weeks or 8 weeks after LSI or sham surgery (m) or in 3-month-old or 20-month-old mice (n). Scale bars, 50 μm. or Quantitative analysis of the number of Osx+ cells or Ocn+ cells of m and n. n = 6 per group. Data are represented as means ± standard deviations, as determined by two-tailed Student’s t test or One-way ANOVA. Source data are provided as a Source Data file.
Fig. 2
Fig. 2. Senescent cells accumulate in the sclerotic endplates of LSI mice and aged mice.
a Representative images of coronal mouse caudal endplate sections of L4/5 stained for SA-βGal (green) at 4 and 8 weeks after LSI or sham surgery (top). Representative immunofluorescent images of tdTom+ cells (red) and DAPI (blue) staining of nuclei at 4 and 8 weeks after LSI or sham surgery in p16tdTom mice (bottom). Quantitative analysis of the number of SA-βGal+ cells (b) or tdTom+ cells (c) of a. d Representative immunofluorescent images of HMGB1+ cells (green) and DAPI (blue) staining of nuclei in endplates at 4 and 8 weeks after LSI or sham surgery. e Quantified fluorescence intensity of HMGB1+ cells of d. f, g Relative expression of senescence pathway genes, Cdkn2a (p16), Trp53 (p53), and Cdkn1a (p21) (f) or typical SASP, II1b (IL-1β) and II6 (IL-6) in the endplates at 4 and 8 weeks after LSI or sham surgery. h Representative images of SA-βGal (green) staining (top) or tdTom+ cells (red) and DAPI (blue) staining of nuclei (bottom) in 3-month-old or 20-month-old mice. i, j Quantitative analysis of h. k Representative immunofluorescent images of HMGB1+ cells (green) and DAPI (blue) staining of nuclei in 3-month-old or 20-month-old mice. l Quantified fluorescence intensity of k. Relative expression of senescence pathway genes (m) or typical SASP (n) in the endplates of 3-month-old or 20-month-old mice. Scale bars, 50 μm. n = 6 per group. Data are represented as means ± standard deviations, as determined by two-tailed Student’s t test or One-way ANOVA. Source data are provided as a Source Data file.
Fig. 3
Fig. 3. The sclerosis of endplates is delayed by clearance of senescent cells in LSI mice.
ak Treatment regimen with D + Q or DMSO (black arrows) in mice after LSI surgery or sham surgery. Red arrow indicates the day of surgery. Blue arrow indicates the day of euthanasia. b Representative images of coronal mouse caudal endplate sections of L4/5 stained for SA-βGal (green). Scale bars, 50 μm. c Quantitative analysis of b. d Representative immunofluorescent images of tdTom+ cells (red) and DAPI (blue) staining of nuclei at 8 weeks after LSI or sham surgery in p16tdTom mice. Scale bars, 50 μm. e Quantitative analysis of d. f Representative immunofluorescent images of CD31 (green), Emcn (red) staining, and DAPI (blue) staining of nuclei. Scale bars, 50 μm. g Permillage of CD31+Emcn+ area in the endplates of f. h Representative three-dimensional µCT images of the caudal endplates of L4/5 (coronal view). Scale bars, 500 μm. i Quantitative analysis of the total porosity of h. j Representative images of safranin O and fast green staining, proteoglycan (red) and cavities (green). Scale bars, 50 μm. k Endplate scores as an indication of endplate degeneration based on safranin O and fast green staining. l Representative immunohistochemical images of Osterix (Osx). Scale bars, 50 μm. m Quantitative analysis of the number of Osx+ cells of l. n = 6 per group. Data are represented as means ± standard deviations, as determined by One-way ANOVA. Source data are provided as a Source Data file.
Fig. 4
Fig. 4. The sclerosis of endplates is delayed by clearance of senescent cells in aged mice.
ak Treatment regimen with D + Q or DMSO (black arrows) in 3-month-old or 20-month-old mice. Blue arrow indicates the day of euthanasia. b Representative images of coronal mouse caudal endplate sections of L4/5 stained for SA-βGal (green). Scale bars, 50 μm. c Quantitative analysis of the number of SA-βGal+ cells in the endplates of b. d Representative immunofluorescent images of CD31 (green), Emcn (red) staining and DAPI (blue) staining of nuclei in the endplates. Scale bars, 50 μm. e Permillage of CD31+Emcn+ area in endplates of d. f Representative three-dimensional µCT images of the mouse caudal endplates of L4/5 (coronal view). Scale bars, 500 μm. g Quantitative analysis of the total porosity of f. h Representative images of safranin O and fast green staining in the endplates, proteoglycan (red) and cavities (green). Scale bars, 50 μm. i Endplate scores as an indication of endplate degeneration based on safranin O and fast green staining. j Representative immunohistochemical images of Osterix (Osx) in the endplates. Scale bars, 50 μm. k Quantitative analysis of the number of Osx+ cells in the endplates of j. n = 6 per group. Data are represented as means ± standard deviations, as determined by One-way ANOVA. Source data are provided as a Source Data file.
Fig. 5
Fig. 5. Abundant macrophages undergo senescence in the endplates of LSI mice and aged mice.
Representative immunofluorescent images of tdTom+ (red), F4/80+ (green) cells and DAPI (blue) staining of nuclei in LSI surgery model (a) or aging model (b) of cdkn2a (p16)tdTom mice. Scale bars, 50 μm. c, d Quantitative analysis of the number of F4/80+tdTom+ cells in the endplates of a and b. n = 6 per group. e Representative images of flow cytometry analysis. cdkn2a (p16)tdTom mice underwent sham or LSI surgery. Cells were isolated from the endplates. f Quantitative analysis of e. n = 3 per group. g Representative images of senescence-associated distension of satellites (SADS, green), F4/80 (red) and DAPI (blue) staining of nuclei in the endplates of LSI surgery mice or aged mice by performing simultaneous immunofluorescent staining and immune-fluorescent in situ hybridization (FISH). Scale bars, 10 μm. h Quantitative analysis of the number of F4/80+SADS+ cells (≥4 SADS/cell) in endplates of g. n = 6 per group. i Representative immunofluorescent images of γH2A.X (green), F4/80 (red) and DAPI (blue) staining of nuclei in the endplates of LSI surgery mice or aged mice. Scale bars, 10 μm. j Quantitative analysis of the number of F4/80+γH2A.X+ cells in the endplates of i. n = 6 per group. Representative immunofluorescent images of F4/80 (red), CD31 (green) and DAPI (blue) staining of nuclei in the endplates at 4, and 8 weeks after LSI or sham surgery (k) or in 3-month-old or 20-month-old mice (l). Scale bars, 50 μm. n = 3–6 per group. Data are represented as means ± standard deviations, as determined by two-tailed Student’s t test or One-way ANOVA. Source data are provided as a Source Data file.
Fig. 6
Fig. 6. Knockout of cdkn2a (p16) in Lyz2+ cells abrogates LSI-induced endplate sclerosis.
a Representative immunofluorescent images of p16+ (red), F4/80+ (green) cells and DAPI (blue) staining of nuclei in mouse caudal endplates of L4/5 in Cdkn2aΔLyz2 or Cdkn2af/f mice at 8 weeks after LSI or sham surgery. Scale bars, 50 μm. b Representative immunofluorescent images of CD31 (green), Emcn (red) and DAPI (blue) staining of nuclei in the endplates of Cdkn2aΔLyz2 or Cdkn2af/f mice after LSI or sham surgery. Scale bars, 50 μm. c Permillage of CD31+Emcn+ area in the endplates of b. d Representative µCT images of the caudal endplates of L4/5 (coronal view) in Cdkn2aΔLyz2 or Cdkn2af/f mice at 8 weeks after LSI or sham surgery. Scale bars, 500 μm. e Quantitative analysis of the total porosity of d. f Representative images of safranin O and fast green staining of endplates in Cdkn2aΔLyz2 or Cdkn2af/f mice at 8 weeks after LSI or sham surgery. Scale bars, 50 μm. g Endplate scores of the endplates of f. h Representative immunohistochemical images of Osterix (Osx) in the endplates of Cdkn2aΔLyz2 or Cdkn2af/f mice at 8 weeks after LSI or sham surgery. Scale bars, 50 μm. i Quantitative analysis of the number of Osx+ cells in the endplates of h. j Representative images of immunofluorescent analysis of CGRP+ sensory nerves (red) and DAPI (blue) staining of nuclei in the endplates of Cdkn2aΔLyz2 or Cdkn2af/f mice after LSI or sham surgery. Scale bars, 50 μm. k Permillage of CGRP+ area in the endplates of l. n = 6 per group. Data are represented as means ± standard deviations, as determined by One-way ANOVA. Source data are provided as a Source Data file.
Fig. 7
Fig. 7. Deletion of macrophages inhibits LSI-induced endplate sclerosis.
a Representative immunofluorescent images of F4/80+ (red) cells and DAPI (blue) staining of nuclei in mouse caudal endplates of L4/5 in iDTRΔLyz2 mice with diphtheria toxin (DT) or vehicle injection at 8 weeks after LSI surgery. Scale bars, 50 μm. bi All the experiments were conducted at 8 weeks after LSI or sham surgery in iDTRΔLyz2 mice with DT or vehicle injection. b Representative images of immunofluorescent analysis of Emcn+ (red), CD31+ (green) cells and DAPI (blue) staining of nuclei in the endplates. Scale bars, 50 μm. c Permillage of CD31+Emcn+ area in the endplates of b. d Representative µCT images of the caudal endplates of L4/5 (coronal view). Scale bars, 500 μm. e Quantitative analysis of the total porosity of d. f Representative images of safranin O and fast green staining of the endplates. Scale bars, 50 μm. g Endplate scores of f. h Representative immunohistochemical images of Osterix (Osx) in the endplates. Scale bars, 50 μm. i Quantitative analysis of the number of Osx+ cells in the endplates of h. n = 6 per group. Data are represented as means ± standard deviations, as determined by One-way ANOVA. Source data are provided as a Source Data file.
Fig. 8
Fig. 8. Deletion of macrophages inhibits aging-induced endplate sclerosis.
a Representative immunofluorescent images of F4/80 (red) staining and DAPI (blue) staining of nuclei in the caudal endplates of L4/5 in 20-month-old mice with clodronate liposomes (CL) or vehicle injection. Scale bars, 50 μm. bi All the experiments were conducted in 20-month-old mice or 3-month-old mice with CL or vehicle injection. b Representative images of immunofluorescent analysis of CD31 (green), Emcn (red) staining and DAPI (blue) staining of nuclei in the endplates. Scale bars, 50 μm. c Permillage of CD31+Emcn+ area in the endplates of b. d Representative µCT images of the caudal endplates of L4/5 (coronal view). Scale bars, 500 μm. e Quantitative analysis of the total porosity of d. f Representative images of safranin O and fast green staining of the endplates. Scale bars, 50 μm. g Endplate scores of f. h Representative images of immunohistochemical staining of Osterix (Osx) in the endplates. Scale bars, 50 μm. i Quantitative analysis of the number of Osx+ cells in endplates of h. n = 6 per group. Data are represented as means ± standard deviations, as determined by One-way ANOVA. Source data are provided as a Source Data file.
Fig. 9
Fig. 9. IL-10 secreted by senescent-like macrophages contributes to angiogenesis in the degenerative endplates.
a Target mRNA expression levels of lumbar endplates from 20M mice or 3 M mice. Heatmap of top 10 dysregulated cytokines. b ELISA analysis of IL-10 concentration in the lysate of lumbar endplates from 20 M mice or 3 M mice. n = 5 per group. c Representative immunofluorescent images of tdTom (red), IL-10 (green), F4/80 (magenta) staining and DAPI (blue) staining of nuclei in the endplates at 8 weeks after LSI surgery in p16tdTom mice. Scale bars, 50 μm. df The primary BMDMs were harvested from WT mice and treated with 100 μM H2O2 or PBS for 4 h. d Representative images of immunofluorescent analysis of CD68 (green) staining and DAPI (blue) staining of nuclei in the BMDMs. Scale bars, 50 μm. e Representative images of BMDMs stained for SA-βGal (green). Scale bars, 50 μm. f The mRNA expression levels of Il10 (IL-10), Il1b (IL-1β), Tnfα (TNF-α), Ccl2 (CCL2), Il18 (IL-18), and Cdkn2a (P16) in BMDMs were determined using qRT-PCR. Each group consisted of n = 5 for Il10, Il1b, Tnfα, and Ccl2, while Il18 and Cdkn2a had n = 6 per group. gi BMDMs were treated with H2O2 or PBS, plus IL-10-blocking mAb (2A5) or negative control (IgG1) administration. g ELISA analysis of IL-10 concentration in the lysate of BMDMs. n = 4 per group. h Representive tube formation images of endothelial cells treated with conditioned medium (CM) from BMDMS. Scale bars, 50 μm. i Quantitative analysis of tube formation of h. n = 5 per group. jt LSI surgery mice or sham surgery mice were administrated with 2A5 or IgG1. j ELISA analysis of IL-10 concentration in the lysate of lumbar endplates. n = 5 per group. k Representative immunofluorescent images of CD31 (green), Emcn (red) staining and DAPI (blue) staining of nuclei in the endplates. Scale bars, 50 μm. l Permillage of CD31+Emcn+ area in endplates of k. n = 6 per group. m Representative µCT images of the caudal endplates of L4/5 (coronal view). Scale bars, 500 μm. n Quantitative analysis of the total porosity of m. n = 6 per group. o Representative images of safranin O and fast green staining of the endplates. Scale bars, 50 μm. p Endplate scores of o. n = 6 per group. q Representative immunohistochemical images of Osterix (Osx) in the endplates. Scale bars, 50 μm. r Quantitative analysis of the number of Osx+ cells in the endplates of q. n = 6 per group. s Representative immunofluorescent images of CGRP+ sensory nerves (red) and DAPI (blue) staining of nuclei in the endplates. Scale bars, 50 μm. t Permillage of CGRP+ area in the endplates of s. n = 6 per group. Data are represented as means ± standard deviations, as determined by two-tailed Student’s t test or One-way ANOVA. Source data are provided as a Source Data file.
Fig. 10
Fig. 10. IL-10 stimulates pSTAT3 signaling to induce angiogenesis.
a mRNA expression of several key angiogenesis-associated factors, including Vegfa (VEGFA), Mmp2 (MMP2), Pdgfb (PDGFB), Mmp9 (MMP9), Fgf2 (FGF2), Hif1a (HIF-1α), and Cdh5 (VEC) in endothelial cells treated with 50 ng/ml IL-10 or vehicle for 24 h, determined by qRT-PCR. n = 5 per group. bg Endothelial cells were treated with 50 ng/ml IL-10 or vehicle for 24 h, plus 5 μmol/L nonpeptidic selective Stat3 inhibitor (Stattic) for 24 h. b Western blots of the phosphorylation of STAT3 (pSTAT3), STAT3, VEGFA, MMP2, and PDGFB in endothelial cells. c Quantitative analysis of b. n = 3 per group. d Representive tube formation images of endothelial cells. Scale bars, 50 μm. e Quantitative analysis of d. n = 5 per group. f Predicated pSTAT3 binding sites on Vegfa, Pdgfb, and Mmp2 promoters and sequences of specific primers. g ChIP analysis of pSTAT3 binding on specific Vegfa, Pdgfb, and Mmp2 promoters in endothelial cells with vehicle or IL-10 treatment. n = 3 per group. Data are represented as means ± standard deviations, as determined by two-tailed Student’s t test or One-way ANOVA. Source data are provided as a Source Data file.

References

    1. Hartvigsen J, et al. What low back pain is and why we need to pay attention. Lancet. 2018;391:2356–2367. doi: 10.1016/S0140-6736(18)30480-X. - DOI - PubMed
    1. Lyu FJ, et al. IVD progenitor cells: a new horizon for understanding disc homeostasis and repair. Nat. Rev. Rheumatol. 2019;15:102–112. doi: 10.1038/s41584-018-0154-x. - DOI - PubMed
    1. Rubin DI. Epidemiology and risk factors for spine pain. Neurol. Clin. 2007;25:353–371. doi: 10.1016/j.ncl.2007.01.004. - DOI - PubMed
    1. Wu A, et al. Global low back pain prevalence and years lived with disability from 1990 to 2017: estimates from the Global Burden of Disease Study 2017. Ann. Transl. Med. 2020;8:299. doi: 10.21037/atm.2020.02.175. - DOI - PMC - PubMed
    1. Samartzis D, Grivas TB. Thematic series - Low back pain. Scoliosis Spinal Disord. 2017;12:1. doi: 10.1186/s13013-016-0108-5. - DOI - PMC - PubMed

LinkOut - more resources