. 2024 Apr 5;15(1):2941.
doi: 10.1038/s41467-024-47020-1.

Seeding the meiotic DNA break machinery and initiating recombination on chromosome axes

Affiliations

Seeding the meiotic DNA break machinery and initiating recombination on chromosome axes

Ihsan Dereli et al. Nat Commun. .

Abstract

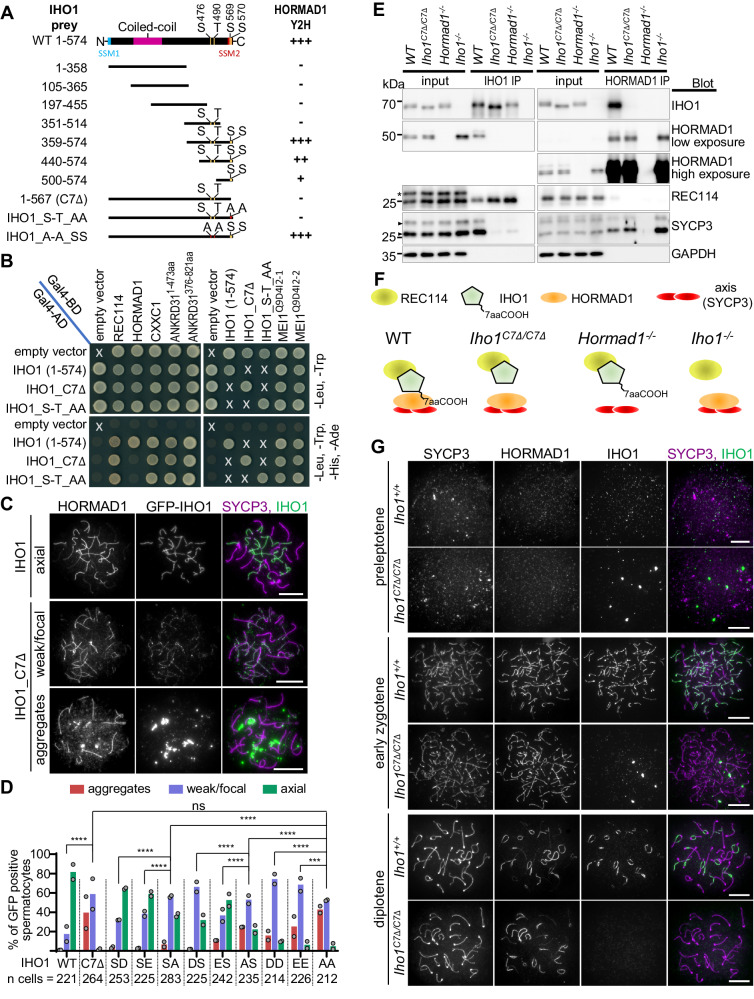
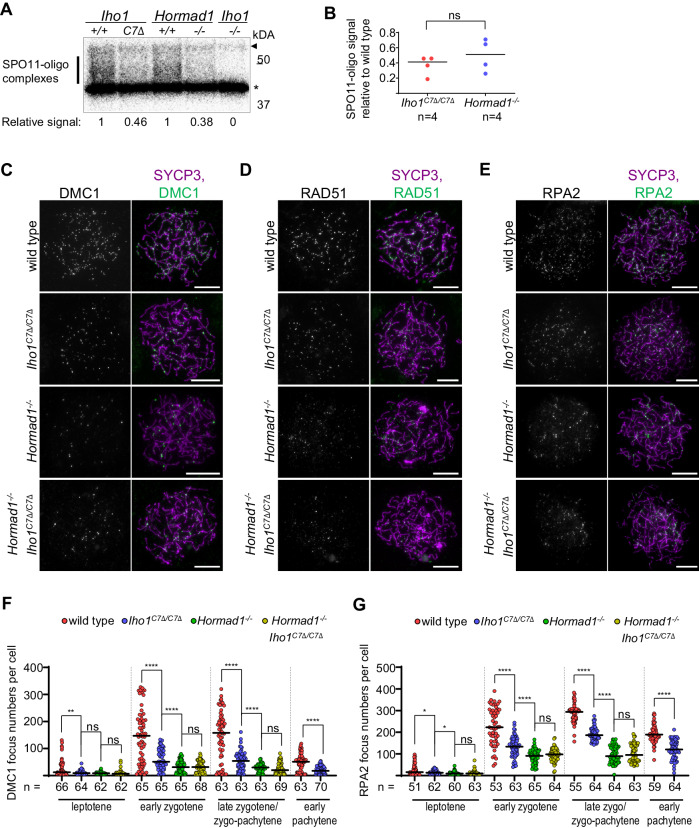
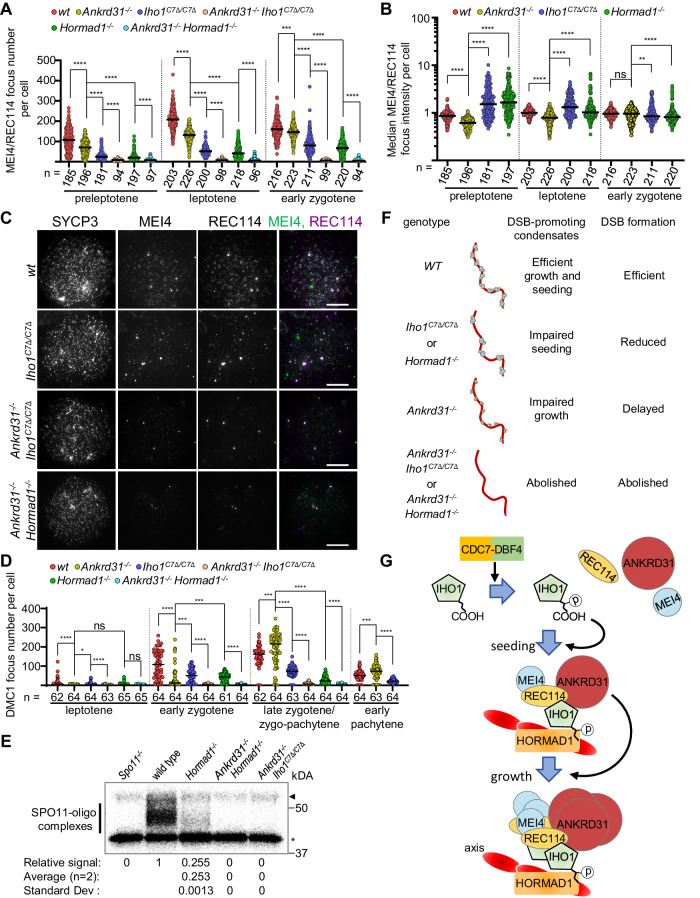
Programmed DNA double-strand break (DSB) formation is a crucial feature of meiosis in most organisms. DSBs initiate recombination-mediated linking of homologous chromosomes, which enables correct chromosome segregation in meiosis. DSBs are generated on chromosome axes by heterooligomeric focal clusters of DSB-factors. Whereas DNA-driven protein condensation is thought to assemble the DSB-machinery, its targeting to chromosome axes is poorly understood. We uncover in mice that efficient biogenesis of DSB-machinery clusters requires seeding by axial IHO1 platforms. Both IHO1 phosphorylation and formation of axial IHO1 platforms are diminished by chemical inhibition of DBF4-dependent kinase (DDK), suggesting that DDK contributes to the control of the axial DSB-machinery. Furthermore, we show that axial IHO1 platforms are based on an interaction between IHO1 and the chromosomal axis component HORMAD1. IHO1-HORMAD1-mediated seeding of the DSB-machinery on axes ensures sufficiency of DSBs for efficient pairing of homologous chromosomes. Without IHO1-HORMAD1 interaction, residual DSBs depend on ANKRD31, which enhances both the seeding and the growth of DSB-machinery clusters. Thus, recombination initiation is ensured by complementary pathways that differentially support seeding and growth of DSB-machinery clusters, thereby synergistically enabling DSB-machinery condensation on chromosomal axes.


Conflict of interest statement

The authors declare no competing interests.

Figures

Fig. 1
Fig. 1. IHO1 C-terminus mediates IHO1-HORMAD1 interaction.
A, B Y2H assays between IHO1 interactors (this study and,,) and wild-type (1-574) or modified versions of IHO1. A Schematics show conserved domains and positions of phospho-serines (S) or -threonine (T) or their substitution with alanine (A) in IHO1. B Budding yeast cultures co-transformed with indicated pairs of Y2H baits (top) and preys (left side) are shown after 3 (two left images) or 2 (two right images) days of growth on drop-out plates. X marks bait-prey combinations that were omitted from Y2H due to lack of relevance. C, G Immunostaining in nuclear spread spermatocytes of 13 days postpartum (dpp) (C) and adult (G) mice. Chromosome axis (SYCP3, C overlay, G), HORMAD1 (C, G) and either ectopically expressed GFP-IHO1 (C) or endogenous IHO1 (G) were detected. Bars, 10 µm. D Quantification of localization of GFP-tagged IHO1 versions in late zygotene. IHO1 versions: wild type (WT), a mutant missing the last 7 amino acids (C7Δ) and versions where single-letter amino acid code indicates point mutations in positions 569 and 570. Block bars are means. Likelihood-ratio test, ns=P > 0.05, ***=P < 0.001, ****=P < 0.0001. Exact P values: WT vs. C7Δ and AA vs. SA P < 2.2e-16, C7Δ vs. AA P = 0,06547, SA vs. SD P = 9.445e-10, SA vs. SE P = 2.225e-06, AA vs. AS P = 3.217e-09, AS vs. DS P = 4.979e-14, AS vs. ES P = 2.966e-11, AA vs. DD P = 2.599e-09, AA vs. EE P = 0.001003. E Immunoprecipitation (IP) immunoblots from testis extracts of 13 dpp mice. Asterisk and triangles mark unspecific protein band in REC114 blot and isoforms of SYCP3, respectively. Distinct proteins were detected on separate blots. F Schematics summarizing conclusions of panel E. See also related Supplementary Fig. 2, Supplementary Table 1 and 2. Source data are provided as a Source Data file.
Fig. 2
Fig. 2. CDC7-dependent phosphoform of IHO1 is enriched in chromatin.
A–C SDS-PAGE immunoblots of protein extracts from testes of 13 dpp mice. Total (A–C), fractionated (A) and/or phosphatase treated total (C) extracts are shown. Distinct proteins were detected on separate blots in A and C. D MS/MS spectrum of NLLCDPDFDS(pS)DNF-COOH peptide. Identified b and y ions are annotated in red and blue, respectively. Fragments with neutral loss of H3PO4 are indicated as -Phos. 10.9 + /− 1.4% of the peptide was phosphorylated in 2 measurements. E–H Analysis of testes of 8 dpp mice after 48 hours in vitro culture with or without CDC7 inhibitors. E Nuclear spread spermatocytes. Bars, 10 µm. F Quantification of spermatocytes with depleted IHO1 on axes. Block bars are means. Likelihood ratio test, P < 2.20E-16 (****) for comparisons between the untreated sample and all of the CDC7 inhibitor treated samples. G SDS-PAGE immunoblots of testis extracts. AC, G Arrowheads mark slow and fast migrating IHO1 forms; slow migrating forms were reproducibly more dominant in untreated testis cultures (G) than in freshly processed testes (A–C). H Intensities of slow migrating IHO1 band normalized to intensities of fast migrating bands from SDS-PAGE immunoblots, n = 5 (untreated and triple) or n = 3 (TAK-931 treated) biologically independent samples. Bars are means. Two-tailed t test, **=P = 0.0021, ***=P = 0.0006. G–H Triple inhibitor mix, as in F. See also related Supplementary Fig. 3, 4 and Supplementary Table 3. Source data are provided as a Source Data file.
Fig. 3
Fig. 3. Iho1C7Δ/C7Δ mice show reduction in testis size and DSB-factor cluster numbers.
A Testis to body weight ratios in adult mice (age 50-120 days). Bars mark means. Two-tailed Welch t-test, ****=P < 0.0001, WT vs. Iho1C7Δ/C7Δ P = 4.88e-05, Iho1C7Δ/C7Δ vs. Hormad1−/− P = 1.71e-07. B, E Immunostaining in nuclear spread leptotene spermatocytes of adult mice. Bars, 10 µm. C, D, F, G Numbers of small MEI4-REC114 co-clusters (B, E) and MEI4 intensities in MEI4-REC114 co-clusters (C, F, data points show median cluster intensities per cell) in spermatocytes of adult mice. Zygo-pachytene (F, G) is equivalent to a mix of late-zygotene and early pachytene stages which are indistinguishable in SC-defective backgrounds. Pooled data is shown from 5 (C, D) or 2 (F, G) mice of each genotype. Bars are medians, n=cell numbers. Two-tailed Mann Whitney U-Test, ns=P > 0.05, *=P < 0.05, ***=P < 0.001, ****=P < 0.0001. Exact P values: (C, F), P < 2.2e-16 for all comparisons, (D), pre-leptotene, wild type vs. Iho1C7Δ/C7Δ, P = 1.63e-10, wild type vs. Hormad1−/−, P = 3.39e-15, wild type vs. Iho1C7Δ/C7Δ Hormad1−/−, P = 1.97e-11, leptotene, wild type vs. Iho1C7Δ/C7Δ, P = 0.04839, wild type vs. Hormad1−/−, P = 3.57e-5, wild type vs. Iho1C7Δ/C7Δ Hormad1−/−, P = 0.782, early zygotene, wild type vs. Iho1C7Δ/C7Δ, P = 1.84e-7, wild type vs. Hormad1−/−, P = 1.53e-5, wild type vs. Iho1C7Δ/C7Δ Hormad1−/−, P = 3.42e-5, (G), pre-leptotene, Spo11−/− Iho1+/+ vs. Spo11−/− Iho1C7Δ/C7Δ, P < 2.2e-16, Spo11−/− Hormad1+/+ vs. Spo11−/− Hormad1−/− P = 5.03e-11, leptotene, Spo11−/− Iho1+/+ vs. Spo11−/− Iho1C7Δ/C7Δ, P = 1.37e-10, Spo11−/− Hormad1+/+ vs. Spo11−/− Hormad1−/− P = 9.16e-15, early zygotene, Spo11−/− Iho1+/+ vs. Spo11−/− Iho1C7Δ/C7Δ, P < 2.2e-16, Spo11−/− Hormad1+/+ vs. Spo11−/− Hormad1−/− P < 2.2e-16, zygo-pachytene, Spo11−/− Iho1+/+ vs. Spo11−/− Iho1C7Δ/C7Δ, P = 8.4e-7, Spo11−/− Hormad1+/+ vs. Spo11−/− Hormad1−/− P = 0.0003408. Statistical tests compare samples that were stained and processed in parallel within experimental repeats to reduce technical variability. Thus, Spo11−/− Iho1+/+andC7Δ/C7Δ are not directly comparable with Spo11−/− Hormad1+/+and−/− due to sample preparation from different colonies on different days (F, G). See also related Supplementary Fig. 5, 6 and Supplementary Tables 4 and 5. Source data are provided as a Source Data file.
Fig. 4
Fig. 4. Efficient meiotic recombination relies on IHO1-HORMAD1 interaction.
A Radiograph of immunoprecipitated and radioactively labeled SPO11-oligo complexes from testes of 13 dpp juvenile mice. Bar, SPO11-specific signals, asterisk, nonspecific labelling, and arrowhead, immunoglobulin heavy-chain. Radioactive signals were background-corrected (Iho1−/−, signal=0) and normalized to corresponding wild type control (1). B Quantification of SPO11-oligo complexes from 13dpp mice. Bars are mean, n=number of mice. Two-tailed paired t-test, ns=P = 0.3419. CE Immunostaining in nuclear spread early zygotene spermatocytes of adult mice. Bars, 10 µm. F, G Quantification of axis associated DMC1 (F), RPA2 (G) focus numbers in spermatocytes. Pools of two experiments are shown (one mouse represented each genotype in each experiment). Bars are medians, n=cell numbers. Two-tailed Mann Whitney U-test, ns=P > 0.05, *=P < 0.05, **=P < 0.01, ****=P < 0.0001. Exact P values: (F), leptotene, wild type vs. Iho1C7Δ/C7Δ, P = 0.05, Iho1C7Δ/C7Δ vs. Hormad1−/−, P = 0.486, Hormad1−/− vs. Hormad1−/− Iho1C7Δ/C7Δ, P = 0.234, early zygotene, wild type vs. Iho1C7Δ/C7Δ, P = 1.26e-7, Iho1C7Δ/C7Δ vs. Hormad1−/−, P = 7.38e-6, Hormad1−/− vs. Hormad1−/− Iho1C7Δ/C7Δ, P = 0.984, late zygotene, wild type vs. Iho1C7Δ/C7Δ, P = 9.44e-9, Iho1C7Δ/C7Δ vs. Hormad1−/−, P = 1.61e-6, Hormad1−/− vs. Hormad1−/− Iho1C7Δ/C7Δ, P = 0.373, pachytene, wild type vs. Iho1C7Δ/C7Δ, P = 1.5e-6, (G), leptotene, wild type vs. Iho1C7Δ/C7Δ, P = 0.02417, Iho1C7Δ/C7Δ vs. Hormad1−/−, P = 0.01189, Hormad1−/− vs. Hormad1−/− Iho1C7Δ/C7Δ, P = 0.2825, early zygotene, wild type vs. Iho1C7Δ/C7Δ, P = 2.19e-9, Iho1C7Δ/C7Δ vs. Hormad1−/, P = 3.17e-8, Hormad1−/− vs. Hormad1−/− Iho1C7Δ/C7Δ, P = 0.2455, late zygotene, wild type vs. Iho1C7Δ/C7Δ, P < 2.2e-16, Iho1C7Δ/C7Δ vs. Hormad1−/−, P < 2.2e-16, Hormad1−/− vs. Hormad1−/− Iho1C7Δ/C7Δ, P = 0.4054, pachytene, wild type vs. Iho1C7Δ/C7Δ, P = 7.28e-15. See also related Supplementary Fig. 7. Source data are provided as a Source Data file.
Fig. 5
Fig. 5. Efficient SC and CO formation require IHO1-HORMAD1 interaction.
A-C, F, G Quantifications of SC morphology relative to axis development (A), I-IV non-exclusive SC defect types (B), axis-length ranks of partially (blue) or completely (red) unsynapsed autosomes (C), MLH1 focus numbers on synapsed autosomes (F) or total MLH1 numbers (G) in spermatocytes of adult mice. Leptotene to early pachytene cells (identified by a lack of histone H1t) (A), pachytene cells (B, C), or both fully synapsed and asynaptic (F) or only fully synapsed (G) late pachytene cells were examined. Pools of two experiments are shown (one mouse represented each genotype in each experiment). Bars are means (A, B, F) or medians (C, G), error bars are standard deviation (A), n=numbers of spermatocytes. Likelihood ratio test (A, B, F) or two-tailed Mann Whitney U-Test (C, G), ns=P > 0.05, **=P < 0.01, ***=P < 0.001, ****=P < 0.0001. Exact P values: (A), (dotty axis) P = 0.5195, (short axis) P = 0.08376, (long axis) P = 0.00735, (full axis) P < 2.2e-16, (B), Iho1+/+ vs. Iho1C7Δ/C7Δ (early pachytene) P = 1.1e-9, (mid-pachytene) P = 1.97e-14, (late-pachytene) P < 2.2e-16, Iho1C7Δ/C7Δ early vs. mid-pachytene P = 6.43e-7, Iho1C7Δ/C7Δ mid- vs. late pachytene P = 1.7e-5, (C), early vs. mid- P = 6.26e-3, early vs. late P = 8.53e-8, mid- vs. late P = 0.634, (F), P = 0.0001898, (G) P = 5.51e-5. D, E Immunostaining in nuclear spread spermatocytes of adult mice. Asterisks, sex chromosomes. D Insets are enlarged under respective panels. Arrowheads mark partially or fully unsynapsed autosomes, arrow marks non-homologous SC. Miniaturized images (left bottom corners) show histone H1t, a marker of mid and post-mid pachytene stages (intermediate or high levels, respectively). Roman numbers refer to SC defect types as described in B. E Iho1C7Δ/C7Δ cells where either all chromosomes have MLH1 (cell 1) or a synapsed autosome lacks MLH1 (cell 2, arrowhead). D, E Bars, 10 µm. See also related Supplementary Fig. 9. Source data are provided as a Source Data file.
Fig. 6
Fig. 6. Disruption of IHO1-HORMAD1 interface prevents DSB top-up in late synapsing axes.
A Immunostaining in nuclear spread late zygotene spermatocytes of adult mice. In wild type, dotted line separates a zygotene (top) from a diplotene (bottom) cell. In enlarged insets, dashed lines mark borders between unsynapsed (arrow) and synapsed (triangle) axes. Bars, 10 and 5 µm in low and high magnification panels, respectively. B Unsynapsed-to-synapsed DMC1 + RPA2 focus density ratios in late zygotene cells where SC formed on >70% of total axis length. CG DSB focus densities on unsynapsed axes in late zygotene cells grouped (C, SC formed on <70% or >70% of total axis length) or ordered (DG) according to the extent of synapsis nucleus-wide. BG Each dot represents a single cell. n=numbers of spermatocytes. B, C Bars, medians, two-tailed Mann Whitney U-Test, ns=P > 0.05, *=P < 0.05, ****=P < 0.0001. Exact P values: (B), wild type vs. Iho1C7Δ/C7Δ P = 1.27e-10, wild type vs. Spo11−/− P = 0.1198, wild type vs. Ankrd31−/− P = 5.99e-10, Iho1C7Δ/C7Δ vs. Spo11−/− P < 2.2e-16, (C), comparison of >70% and <70% synapsed spermatocytes in wild type P = 0.06574, Iho1C7Δ/C7Δ P = 0.7645, Spo11−/− P = 0.01217, Ankrd31−/− P = 0.04398; comparison of spermatocytes with >70% synapsis, wild type vs. Iho1C7Δ/C7Δ P < 2.2e-16, Iho1C7Δ/C7Δ vs. Spo11−/− P < 2.2e-16, Iho1C7Δ/C7Δ vs. Ankrd31−/− P < 2.2e-16. DG Linear regression (lines), the best-fit slope +/− standard error and the significance of slope deviation from zero (two-tailed F test, P) are shown. Source data are provided as a Source Data file.
Fig. 7
Fig. 7. IHO1-HORMAD1 complex and ANKRD31 are redundantly necessary for meiotic DSBs.
A, B, D Numbers of small MEI4-REC114 co-clusters (A), MEI4 intensities in MEI4-REC114 co-clusters (B, data points show median cluster intensities per cell), and DMC1 focus numbers (D) in spermatocytes of adult mice. Zygo-pachytene (D), only in SC-defective backgrounds) is equivalent to a mix of late-zygotene and early pachytene stages which are indistinguishable if SC is defective. Pooled data is shown from 6 (A, B) or 2 (D) mice of each genotype. Bars are medians, n=cell numbers. Two-tailed Mann Whitney U-Test, ns=P > 0.05, *=P < 0.05, **=P < 0.01, ***=P < 0.001, ****=P < 0.0001. Exact P values: (A), wild type (wt) versus Ankrd31−/− pre-leptotene P = 5.35e-13, early zygotene P = 0.0001596, all the others P < 2.2e-16, (B), all comparisons in pre-leptotene and leptotene P < 2.2e-16, early zygotene, wt vs. Ankrd31−/− P = 0.3047, Ankrd31−/− vs. Iho1C7Δ/C7Δ P = 0.001186, Ankrd31−/− vs. Hormad1−/− P = 7.19e-5, (D), leptotene, wt vs. Ankrd31−/− P = 1.07e-6, Ankrd31−/− vs. Iho1C7Δ/C7Δ P = 0.01621, Iho1C7Δ/C7Δ vs. Ankrd31−/− Iho1C7Δ/C7Δ P = 5.28e-5, Ankrd31−/− vs. Hormad1−/− P = 0.1945, Hormad1−/− vs. Ankrd31−/− Hormad1−/− P = 0.175, early zygotene, wt vs. Ankrd31−/− P = 5.82e-10, Ankrd31−/− vs. Iho1C7Δ/C7Δ P= 0.00041, Iho1C7Δ/C7Δ vs. Ankrd31−/− Iho1C7Δ/C7Δ P = 1.47e-13, Ankrd31−/− vs. Hormad1−/− P = 0.0002882, Hormad1−/− vs. Ankrd31−/− Hormad1−/− P < 2.2e-16, late zygotene, wt vs. Ankrd31−/− P = 0.0004372, Ankrd31−/− vs. Iho1C7Δ/C7Δ P = 1.48e-13, Iho1C7Δ/C7Δ vs. Ankrd31−/− Iho1C7Δ/C7Δ P = 5.35e-16, Ankrd31−/− vs. Hormad1−/− P < 2.2e-16, Hormad1−/− vs. Ankrd31−/− Hormad1−/− P = 2.49e-11, early pachytene, wt vs. Ankrd31−/− P = 0.0001234, Ankrd31−/− vs. Iho1C7Δ/C7Δ P = 1.1e-10. C Immunostaining in leptotene spermatocytes from adult mice. Bars, 10 µm. E Radiograph of immunoprecipitated and radioactively labeled SPO11-oligo complexes from testes of adult mice. Bar, SPO11-specific signal, asterisk, nonspecific labelling, and arrowhead, immunoglobulin heavy-chain. Radioactive signals were background-corrected (Iho1−/−, signal=0) and normalized to wild-type control (1). Means and standard deviations are from n = 2 biological replicates. F Schematic summary of phenotypes caused by the disruption of IHO1-HORMAD1 complex and/or ANKRD31. G Model for the assembly of DSB-factor clusters on axis. Black arrows represent promotion of (i) IHO1 phosphorylation and (ii) seeding or (iii) growth of DSB-factor clusters by CDC7-DBF4, IHO1 (in particular, phosphorylated IHO1 C-terminus) and ANKRD31, respectively. See also related Supplementary Fig. 10 and 11 and Supplementary Table 6. Source data are provided as a Source Data file.

Update of

References

    1. Hunter N. Meiotic Recombination: The Essence of Heredity. Cold Spring Harb. Perspect. Biol. 2015;7:a016618. doi: 10.1101/cshperspect.a016618. - DOI - PMC - PubMed
    1. Vrielynck N, et al. A DNA topoisomerase VI-like complex initiates meiotic recombination. Science. 2016;351:939–943. doi: 10.1126/science.aad5196. - DOI - PubMed
    1. Robert T, et al. The TopoVIB-Like protein family is required for meiotic DNA double-strand break formation. Science. 2016;351:943–949. doi: 10.1126/science.aad5309. - DOI - PubMed
    1. Keeney S, Giroux CN, Kleckner N. Meiosis-specific DNA double-strand breaks are catalyzed by Spo11, a member of a widely conserved protein family. Cell. 1997;88:375–384. doi: 10.1016/S0092-8674(00)81876-0. - DOI - PubMed
    1. Bergerat A, et al. An atypical topoisomerase II from Archaea with implications for meiotic recombination. Nature. 1997;386:414–417. doi: 10.1038/386414a0. - DOI - PubMed