. 2024 Apr 5;15(1):2942.
doi: 10.1038/s41467-024-47142-6.

Cryo-EM structures of pannexin 1 and 3 reveal differences among pannexin isoforms

Affiliations

Cryo-EM structures of pannexin 1 and 3 reveal differences among pannexin isoforms

Nazia Hussain et al. Nat Commun. .

Abstract

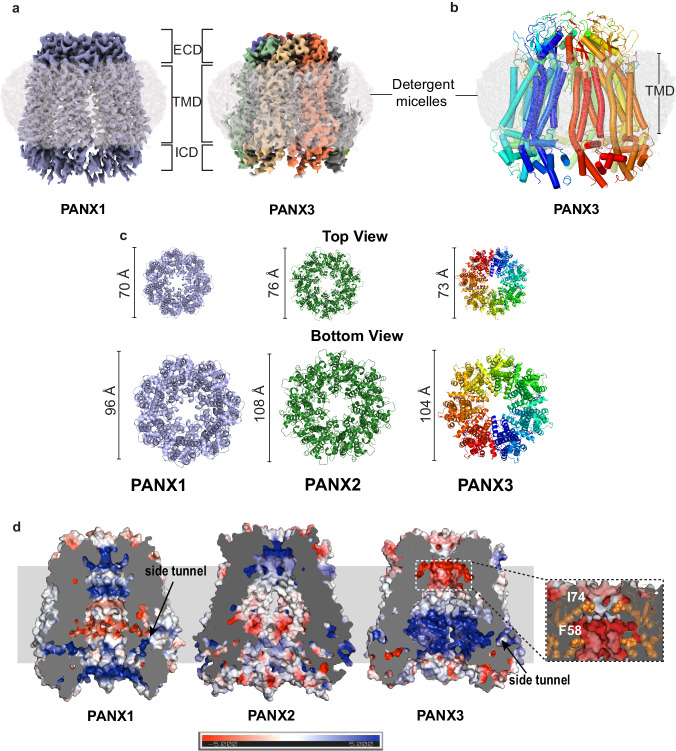
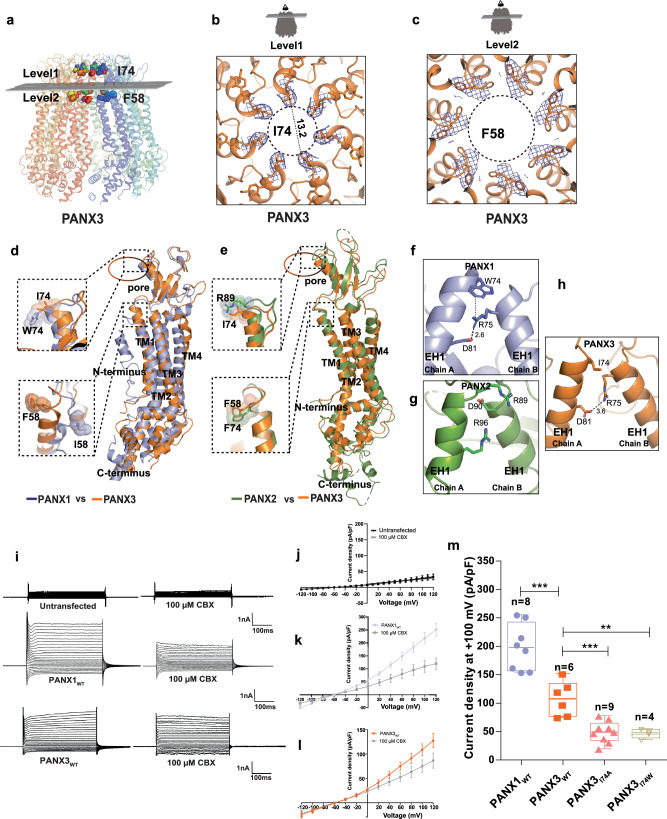
Pannexins are single-membrane large-pore channels that release ions and ATP upon activation. Three isoforms of pannexins 1, 2, and 3, perform diverse cellular roles and differ in their pore lining residues. In this study, we report the cryo-EM structure of pannexin 3 at 3.9 Å and analyze its structural differences with pannexin isoforms 1 and 2. The pannexin 3 vestibule has two distinct chambers and a wider pore radius in comparison to pannexins 1 and 2. We further report two cryo-EM structures of pannexin 1, with pore substitutions W74R/R75D that mimic the pore lining residues of pannexin 2 and a germline mutant of pannexin 1, R217H at resolutions of 3.2 Å and 3.9 Å, respectively. Substitution of cationic residues in the vestibule of pannexin 1 results in reduced ATP interaction propensities to the channel. The germline mutant R217H in transmembrane helix 3 (TM3), leads to a partially constricted pore, reduced ATP interaction and weakened voltage sensitivity. The study compares the three pannexin isoform structures, the effects of substitutions of pore and vestibule-lining residues and allosteric effects of a pathological substitution on channel structure and function thereby enhancing our understanding of this vital group of ATP-release channels.


Conflict of interest statement

The authors declare no competing interests.

Figures

Fig. 1
Fig. 1. Structural comparison of PANX3 with other isoforms.
a The cryo-EM map for PANX1 (blue) and PANX3 (protomers colored individually) viewed parallel to the membrane plane and surrounded by the detergent micelle (gray). b The modeled structure of PANX3 displaying heptameric organization and embedded in a detergent micelle that marks the transmembrane boundary. c Top (extracellular) and bottom (cytosolic) views of PANX1, 2 and PANX3 exhibiting differences in the dimensions in PANX isoforms at the extracellular and intracellular faces of the channel. d Sagittal section of surface electrostatics of PANX1 (PDB ID: 6WBF), PANX2 (PDB ID: 7XLB), and PANX3 colored according to potential from −5 (red) to +5 (blue) (kBTec−1) viewed parallel to the membrane plane. The inset shows the position of the residues I74 and F58 (orange spheres) forming first and second constrictions, respectively in PANX3.
Fig. 2
Fig. 2. PANX3 pore and affect of substitutions on channel properties.
a Transverse sections of PANX3 at two distinct levels are presented, illustrating the locations of two constrictions. Specifically, I74 and F58 in PANX3 contribute to the formation of the first and second constrictions, respectively. b A close-up of the first constriction seen from above in PANX3 formed by I74. The density for the residue (I74) at 7.5 σ is shown. c A close up of the second constriction formed by F58 in PANX3. The density for the residue (F58) at 7.5 σ is shown. d Superposition of PANX1 and PANX3 displaying the position of residues 58 and 74 with a rmsd of 3.2 Å for 302 Cα atoms, e Superposition of PANX2 (PDB ID: 7XLB) and PANX3 exhibits the differences in the pore residues, R89 and I74 in PANX2 and PANX3 respectively with a rmsd of 5.4 Å for 288 atoms aligned; F74 in PANX2 acquires similar position as F58 in PANX3. f Cation-pi interaction(dotted lines) between W74 and R75 in PANX1 (PDB ID: 6WBF) is lost in PANX3. g Hydrogen bond interaction between R75 and D81 in PANX1 is also observed in PANX3 similar to PANX1. All the distances depicted in the figure are in angstroms (Å). h Pore residue (R89, D90) in PANX2 do not form any interactions with neighboring residues unlike PANX1 and PANX3 il, Representative traces for whole-cell current for HEK293 untransfected cells(mock) and HEK293 cells expressing PANX1WT and PANX3 with and without CBX (100 µM) application. Current density-voltage plot for untransfected, PANX1 and PANX3 in presence and absence of CBX. Each point represents the mean of n = 5 (untransfected), n = 4 (PANX1) and n = 6 (PANX3) individual recordings, and the error bar represents SEM. m Current density is plotted for the PANX1WT (n = 8) and PANX3WT (n = 6) and its mutants, PANX3I74A (n = 9), PANX3I74W (n = 4), the error bar represents SEM. n represents the number of cells used for independent recordings; a two-tailed unpaired t-test is used for calculating the significance, ***p < 0.001; n.s., not significant, PANX1WT vs PANX3WT (P value < 0.0001), PANX3WT vs PANXI74A (P value = 0.0005), PANX3WT vs PANXI74W (P value = 0.0047), The whiskers represent minimum and maximum value, the left edge of the box represents 25% quartile and the right edge represents 75% quartile, the middle line represents median. Box plot statistics for PANX1WT are, minimum (154.5), 25% percentile (156.9), median (198.0), 75% percentile (242.8), maximum (255.6), for PANX3WT, minimum (75.03), 25% percentile (77.00), median (108.6), 75% percentile (134.4), maximum (152.0), for PANX3I74A, minimum (49.96), 25% percentile (56.77), median (64.21), 75% percentile (77.97), maximum (97.97), for PANX3I74W, minimum (36.24), 25% percentile (38.92), median (48.44), 75% percentile (53.84), maximum (55.14), raw traces and the IV curve for the PANX3 mutants are presented in Supplementary Fig. 12.
Fig. 3
Fig. 3. PANX1 pore substitution mutant, PANX1WR/RD constricts the channel.
a The superposition of PANX1 (blue) and PANX1WR/RD (violet) illustrates that in PANX1WR/RD, R74 and D75 serve as pore residues, contrasting with W74 and R75 in PANX1WT. b A cross-section of superposed PANX1WT and PANX1WR/RD displays the reduction of pore. c The superposition of PANX1WR/RD and PANX2 unveils the pore residues in PANX2, with the density for R74 and D75 in PANX1WR/RD contoured at 9.0 σ. d A cross-section of superposed PANX2 and PANX1WR/RD displays the position of arginine at the pore. The distances depicted in the figure are in angstroms (Å). e, f The hole profile displays similar pore radius for PANX1WR/RD and PANX2, The line represents the minimum radius for PANX2 at 2.7 Å formed by the first constriction (R89) in PANX2 channel. Units of both X and Y-axes are in angstroms (Å). g The binding affinity for the PANX1WR/RD was determined to be 67 ± 17 µM, n = 3 independent experiments, error bar represents S.D.
Fig. 4
Fig. 4. Vestibular cationic residues in PANX1 alter ATP interactions and affect channel currents.
a The position of the mutants selected for ATP-γS binding and whole patch clamp experiments is displayed. b Microscale thermophoresis profile for PANX1R24A shows the binding of 94 ± 15 µM. c MST data reveals a complete loss of binding in PANX1R128A mutant. d The binding affinity for the putative ATP binding site (R75) in PANX1 was determined to be 114 ± 28 µM, suggesting that R75 is not the sole residue responsible for ATP-γS binding in PANX1, n = 3 independent experiments, error bar represents S.D. e Current density is plotted for the PANX1WT(n = 8) and the mutants, PANX1R75A(n = 11), PANX1R217H(n = 6), PANX1WR/RD(n = 11), PANX1K24A(n = 5) PANX1R128A(n = 7), and untransfected(n = 7) the error bar represents SEM. n represents the number of cells used for independent recordings; a two-tailed unpaired t-test is used for calculating the significance, ***p < 0.001; n.s., not significant, PANX1WT vs PANX1R75A (P value < 0.0001), PANX1WT vs PANX1WR/RD (P value < 0.0001), PANX1WT vs PANXR217H (P value < 0.0001), PANX1WT vs Untransfected (P value < 0.0001), PANX1WT vs PANXK24A (P value = 0.0022), PANX1WT vs PANXR128A (P value < 0.0001). The whiskers represent minimum and maximum value, the left edge of the box represent 25% quartile and the right edge represents 75% quartile, the middle line represents median. Box plot statistics are follows, for PANX1WT, minimum (154.5), 25% percentile (156.9), median (198.0), 75% percentile (242.8), maximum (255.6), for PANX1R217H are as follows, minimum (71.99), 25% percentile (82.77.), median (97.37), 75% percentile (113.5), maximum (116.9), for PANX1R75A, minimum (87.15), 25% percentile (101.4), median (121.7), 75% percentile (135.7), maximum (168.8), for PANX1WR/RD are as follows, minimum (69.0), 25% percentile (88.1), median (100.2), 75% percentile (129.4), maximum (142.5), for PANX1R128A, minimum (36.5), 25% percentile (40.1), median (49.3), 75% percentile (54.9), maximum (73.7), for PANX1K24A, minimum (107.0), 25% percentile (115.6), median (127.8), 75% percentile (130.7), maximum (130.9), for untransfected, minimum (20.9), 25% percentile (23.5), median (27.0), 75% percentile (62.0), and maximum (68.6), raw traces and the IV curve for the PANX1 mutants are presented in Supplementary Fig. 11. f Normalized conductance-voltage (GV-curve) plot for PANX1WT(n = 8), PANX1R75A(n = 6), and PANX1WR/RD(n = 4) suggests that the pore residues are not involved in the voltage sensitivity of the channel, conductance-voltage(GV-curve) plot for PANX1R217H exhibits a reduction in the voltage sensitivity of the channel, n = 4; the error bar represents SEM. g The normalized G-V values were fitted with the Boltzmann equation, and the voltage at which the half-maximal activation, V50, occurred along with slope factor, k, was calculated for all the constructs.
Fig. 5
Fig. 5. PANX1 germline mutant, PANX1R217H alters channel properties.
a A cross-section of superposed structures of PANX1WT (blue) and PANX1R217H (red); the inset shows the altered conformation of the residue (W74) at the extracellular entrance of the pore. The dashed line represents the reduced pore cross-section distance in PANX1R217H(red); the W74 rotates by 80° at the χ2 torsion angle, reducing the pore diameter by 3.8 Å compared to PANX1WT (Supplementary Movie 1). The density corresponding to W74, depicted at 5.0 σ, is illustrated in the PANX1R217H mutant channel. b The residue R75 in PANX1R217H forms a salt bridge interaction with D81 of the adjacent subunit, mirroring the interaction observed in PANX1WT. c The structural superposition of PANX1WT and PANX1R217H exhibits a disrupted hydrogen-bond network, owing to the mutation, displayed in the inset. For clarity, only one subunit is shown, and arrows indicate the direction of the movement of the mutant in comparison to PANX1WT. The distances displayed in the figure are in angstroms (Å). d Weak apparent binding affinity of the PANX1R217H with ATP-γs was determined to be 186 ± 70 µM compared to 18 ± 4 µM of PANX1WT, n = 3 independent experiments, error bar represents S.D.
Fig. 6
Fig. 6. Representation of ion/ATP conducting pathway in PANX1 and PANX3.
The minimum radius is observed at the first constriction in PANX isoforms. a The minimum radius is 4.8 Å for PANX3 at the constriction formed by I74. b The PANX1WT has a minimum radius of 4.2 Å formed by W74. c The constriction point is created by W74 in PANX1R217H. The constriction point is 2.4 Å in PANX1R217H. d 2D representation of the hole profile. The line represents the minimum radius for PANX1WT at 4.2 Å formed by the first constriction (W74) in PANX1 channels.
Fig. 7
Fig. 7. Schematic of PANX isoforms.
A schematic of the three PANX isoforms displaying differences in their structural organization. The residues lining the pore at the extracellular domain are distinct among the three isoforms. The distance between residues at the constriction point are indicated.

References

    1. Panchin Y, et al. A ubiquitous family of putative gap junction molecules. Curr. Biol. 2000;10:R473–R474. doi: 10.1016/S0960-9822(00)00576-5. - DOI - PubMed
    1. Ma W, Hui H, Pelegrin P, Surprenant A. Pharmacological characterization of pannexin-1 currents expressed in mammalian cells. J. Pharm. Exp. Ther. 2009;328:409–418. doi: 10.1124/jpet.108.146365. - DOI - PMC - PubMed
    1. Penuela S, Gehi R, Laird DW. The biochemistry and function of pannexin channels. Biochim Biophys. Acta. 2013;1828:15–22. doi: 10.1016/j.bbamem.2012.01.017. - DOI - PubMed
    1. Velasquez S, Eugenin EA. Role of Pannexin-1 hemichannels and purinergic receptors in the pathogenesis of human diseases. Front. Physiol. 2014;5:96. doi: 10.3389/fphys.2014.00096. - DOI - PMC - PubMed
    1. Makarenkova HP, Shestopalov VI. The role of pannexin hemichannels in inflammation and regeneration. Front. Physiol. 2014;5:63. doi: 10.3389/fphys.2014.00063. - DOI - PMC - PubMed

MeSH terms