. 2024 Apr 5;15(1):2966.
doi: 10.1038/s41467-024-47002-3.

Concomitant medication, comorbidity and survival in patients with breast cancer

Affiliations

Concomitant medication, comorbidity and survival in patients with breast cancer

Elise Dumas et al. Nat Commun. .

Abstract

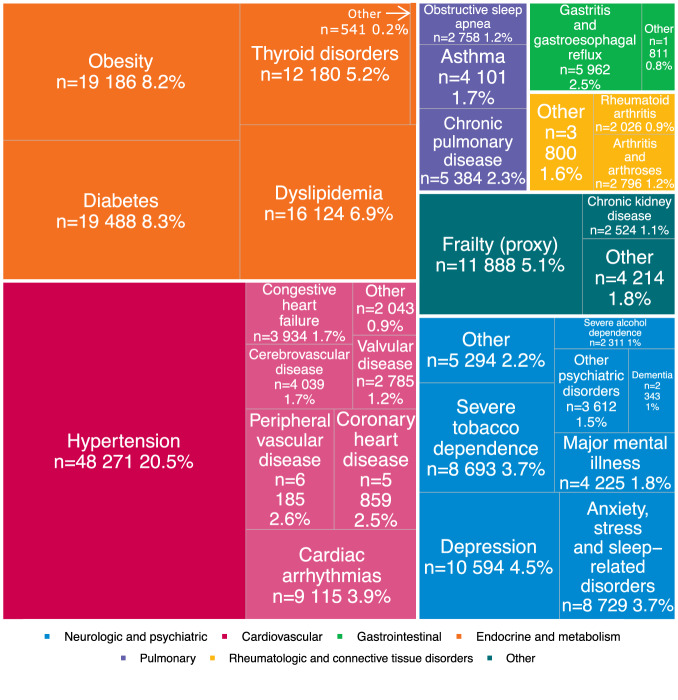
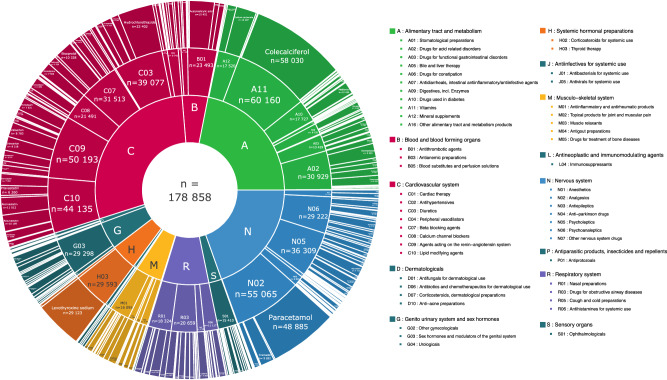
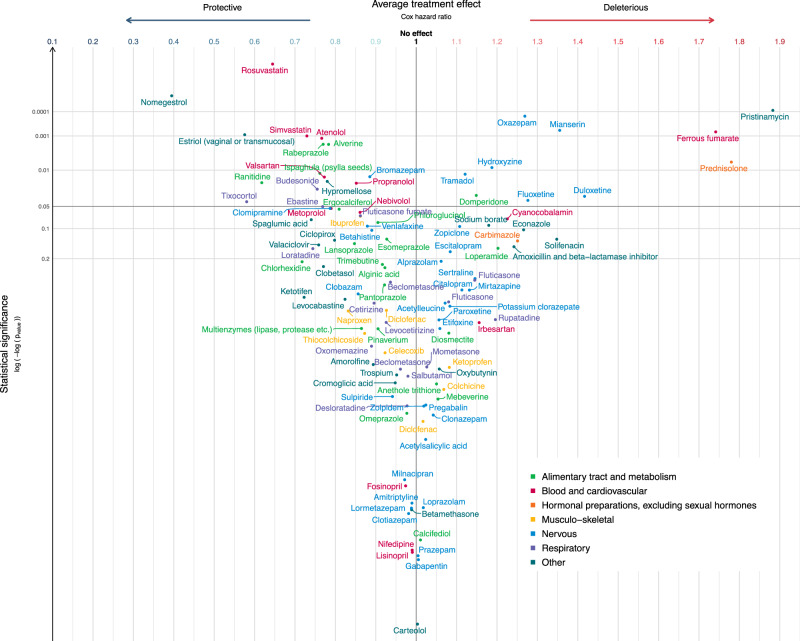
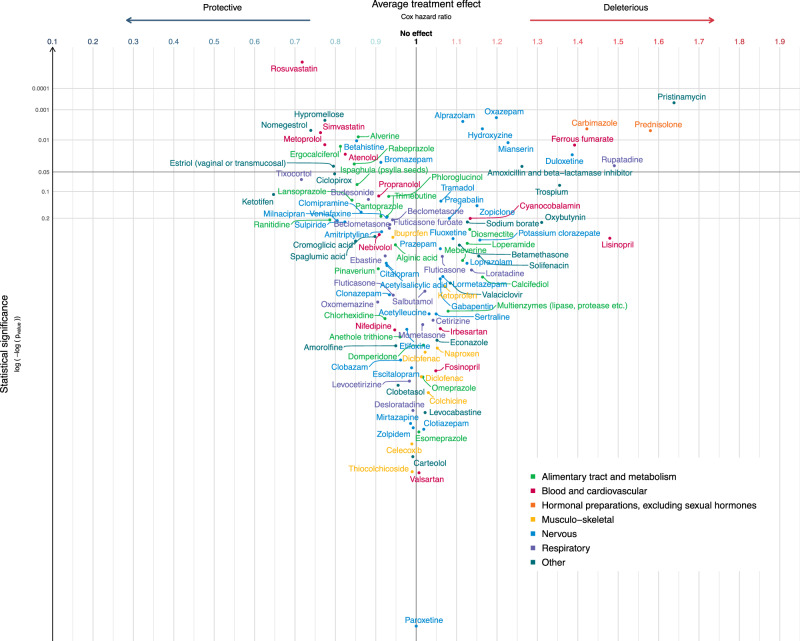
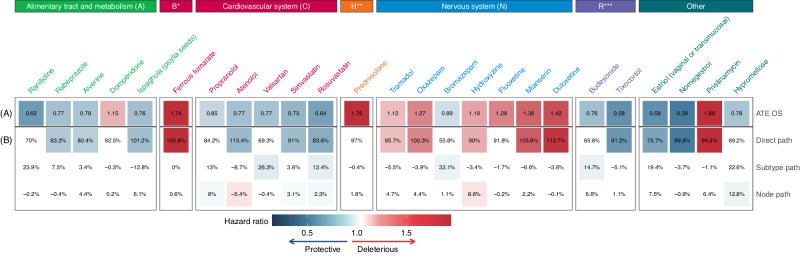
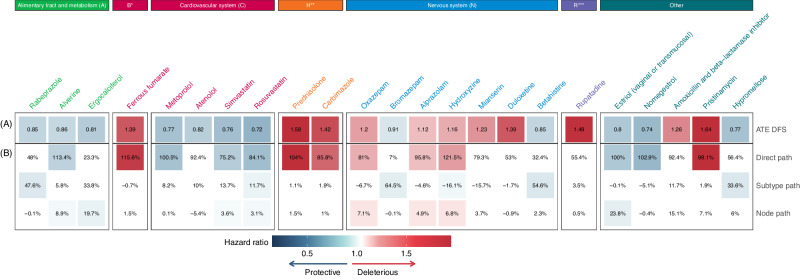
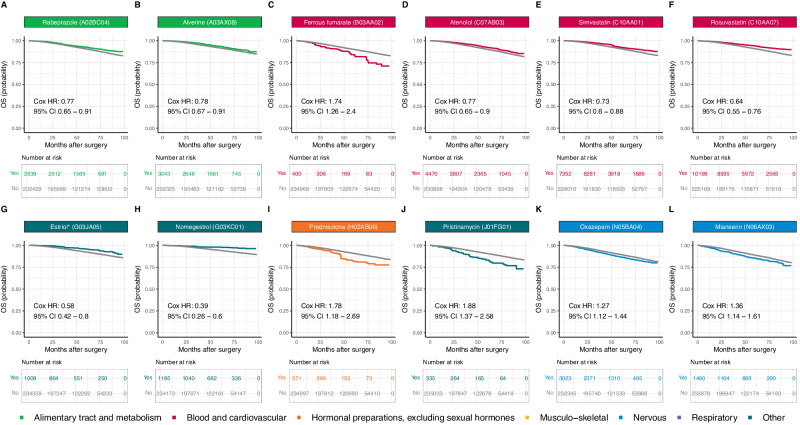
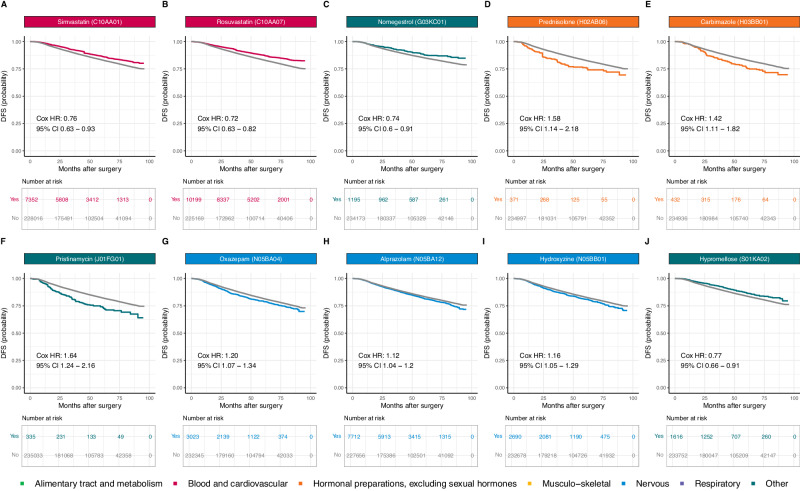
Between 30% and 70% of patients with breast cancer have pre-existing chronic conditions, and more than half are on long-term non-cancer medication at the time of diagnosis. Preliminary epidemiological evidence suggests that some non-cancer medications may affect breast cancer risk, recurrence, and survival. In this nationwide cohort study, we assessed the association between medication use at breast cancer diagnosis and survival. We included 235,368 French women with newly diagnosed non-metastatic breast cancer. In analyzes of 288 medications, we identified eight medications positively associated with either overall survival or disease-free survival: rabeprazole, alverine, atenolol, simvastatin, rosuvastatin, estriol (vaginal or transmucosal), nomegestrol, and hypromellose; and eight medications negatively associated with overall survival or disease-free survival: ferrous fumarate, prednisolone, carbimazole, pristinamycin, oxazepam, alprazolam, hydroxyzine, and mianserin. Full results are available online from an interactive platform ( https://adrenaline.curie.fr ). This resource provides hypotheses for drugs that may naturally influence breast cancer evolution.


Conflict of interest statement

The authors declare no competing interests.

Figures

Fig. 1
Fig. 1. Distribution of comorbid conditions (by disease) in the total population.
Diseases are color-coded by category. Percentages of the total population are reported. In each category, comorbid conditions with fewer than 2000 cases were regrouped into the “Other” category to improve readability. In the neurologic and psychiatric diseases category, “Other” includes anorexia or bulimia (n = 114, 0%), cognitive disabilities (n = 791, 0.3%), epilepsy (n = 1278, 0.5%), hemiplegia, paraplegia or palsy (n = 1600, 0.7%), multiple sclerosis (n = 719, 0.3%), other substance use disorder (n = 244, 0.1%), and Parkinson’s disease (n = 989, 0.4%). In the cardiovascular diseases category, “Other” includes coagulopathy (n = 743, 0.3%“), hemoglobinopathy (n = 104, 0%), and pulmonary embolism (n = 1217, 0.5%). In the gastrointestinal diseases category, “Other” includes inflammatory bowel disease (n = 1022, 0.4%), pancreatic disease (n = 232, 0.1%), and peptic ulcer disease (n = 576, 0.2%). In the endocrine and metabolic diseases category, “Other” includes other endocrine disorders (n = 541, 0.2%). In the rheumatologic and connective tissue disorders category, “Other” includes connective tissue diseases (n = 1102, 0.5%), fibromyalgia (n = 324 0.1%), osteoporosis (n = 1817, 0.8%), and rheumatic diseases (n = 664, 0.3%). In the other diseases category, “Other” includes hereditary metabolic disorders (n = 459, 0.2%), myopathies, or disorders of muscles (n = 562, 0.2%), HIV/AIDS (n = 316, 0.1%), organ or tissue transplant (n = 186 0.1%), other immune deficiency (n = 141, 0.1%), chronic hepatitis (n = 1001, 0.4%), cirrhosis (n = 879, 0.4%), and steatosis and hereditary diseases (n = 1046, 0.4%). The data can be further explored on the interactive ADRENALINE web application (https://adrenaline.curie.fr/comorbidity_description). Source data are provided as a Source Data file. Abbreviations: HIV: human immunodeficiency virus; AIDS: acquired immunodeficiency syndrome.
Fig. 2
Fig. 2. Distribution of concomitant medications by ATC code, for ATC level 1 (inner ring), ATC level 2 (middle ring), and ATC level 5 (outer ring).
Concomitant medications are color-coded by ATC level. Raw data for ATC classes for which the data cannot be read on the graph can be accessed in Supplementary Data 1 or via the interactive display available online at https://adrenaline.curie.fr/comed_description. Source data are provided as a Source Data file. ATC Anatomical Therapeutic Chemical.
Fig. 3
Fig. 3. Estimated average treatment effect (ATE) for overall survival (OS) for the 113 medications passing the adjustment quality test.
Medications are represented by circles color-coded by ATC level and linked to the full name of the medication. The ATE (i.e. the Cox hazard ratio, HR) is plotted on the x-axis. Lower HRs (protective effect of the medication, increasing overall survival in breast cancer) are displayed on the left. Higher HRs (deleterious effect of the medication, decreasing overall survival in breast cancer) are displayed on the right. An HR of 1 (no effect of the medication on overall survival in breast cancer) is indicated by a vertical line. We used two-sided Wald tests with robust covariances for statistical inference. No adjustment for multiple comparisons was made at this stage of the pipeline. Statistical significance is plotted on the y-axis. Lower p-values (high statistical significance) are displayed at the top. Higher p-values (low statistical significance) are displayed at the bottom. An interactive display is available via the ADRENALINE web application (https://adrenaline.curie.fr/survival_analysis). Source data are provided as a Source Data file. *Estriol (vaginal or transmucosal). ATE average treatment effect, ATC Anatomical Therapeutic Chemical.
Fig. 4
Fig. 4. Estimated average treatment effect (ATE) for disease-free survival (DFS) for the 113 medications passing the adjustment quality test.
Medications are represented by circles color-coded by ATC level and linked to the full name of the medication. The ATE (i.e. the Cox hazard ratio, HR) is plotted on the x-axis. Lower HRs (protective effect of the medication, increasing disease-free survival in breast cancer) are displayed on the left. Higher HRs (deleterious effect of the medication, decreasing disease-free survival in breast cancer) are displayed on the right. An HR of 1 (no effect of the medication on disease-free survival in breast cancer) is indicated by a vertical line. We used two-sided Wald tests with robust covariances for statistical inference. No adjustment for multiple comparisons was made at this stage of the pipeline. Statistical significance is plotted on the y-axis. Lower p-values (high statistical significance) are displayed at the top. Higher p-values (low statistical significance) are displayed at the bottom. An interactive display is available via the ADRENALINE web application (https://adrenaline.curie.fr/survival_analysis). Source data are provided as a Source Data file. Abbreviations: ATE: average treatment effect; ATC: Anatomical Therapeutic Chemical.
Fig. 5
Fig. 5. Mediation analyzes for the 25 medications with a significant protective or deleterious effect for overall survival (OS).
Medications are grouped and color-coded by ATC level. Significant protective associations are shown in blue. Significant deleterious associations are shown in red. Non-significant associations are shown in white. A Average treatment effect (ATE) of the medication (Cox hazard ratio, HR). B Breakdown of the ATE into three path-specific effects (expressed as percentages): direct path, subtype path and node path. Source data are provided as a Source Data file. ATE average treatment effect, ATC Anatomical Therapeutic Chemical, HR hazard ratio, B* blood and blood-forming organs, H** systemic hormonal preparations, excluding sex hormones and insulins, R*** respiratory system.
Fig. 6
Fig. 6. Mediation analyzes for the 23 medications with a significant protective or deleterious effect for disease-free survival (DFS).
Medications are grouped and color-coded by ATC level. Significant protective associations are shown in blue. Significant deleterious associations are shown in red. Non-significant associations are shown in white. (A) Average treatment effect (ATE) of the medication (Cox hazard ratio, HR). (B) Breakdown of the ATE into three path-specific effects (expressed as percentages): direct path, subtype path, and node path. Source data are provided as a Source Data file. ATE average treatment effect, ATC Anatomical Therapeutic Chemical, HR hazard ratio, A* alimentary tract and metabolism, B** blood and blood-forming organs, H*** systemic hormonal preparations, excluding sex hormones and insulins, R**** respiratory system.
Fig. 7
Fig. 7. Adjusted Kaplan-Meier survival curves for the 12 medications with a significant HR after adjustment for multiple testing for overall survival (OS).
A Rabeprazole (A02BC04); B Alverine (A03AX08); C Ferrous fumarate (B03AA02); D Atenolol (C07AB03); E Simvastatin (C10AA01); F Rosuvastatin (C10AA07); G Estriol* (vaginal or transmucosal) (G03JA05); H Nomegestrol (G03KC01); I Prednisolone (H02AB06); J Pristinamycin (J01FG01); K Oxazepam (N05BA04); L Mianserin (N06AX03). Survival curves for patients not on medication at the time of diagnosis are displayed in gray. Survival curves for patients with concomitant medication are color-coded by medication ATC level. The survival curves for all the other medications are available via the ADRENALINE web application (https://adrenaline.curie.fr/survival_analysis). Source data are provided as a Source Data file. * Vaginal or transmucosal. ATC Anatomical Therapeutic Chemical.
Fig. 8
Fig. 8. Adjusted Kaplan-Meier survival curves for the 10 medications with a significant HR after adjustment for multiple testing for disease-free survival (DFS).
A Simvastatin (C10AA01); B Rosuvastatin (C10AA07); C Nomegestrol (G03KC01); D Prednisolone (H02AB06); E Carbimazole (H03BB01); F Pristinamycin (J01FG01); G Oxazepam (N05BA04); H Alprazolam (N05BA12); I Hydroxyzine (N05BB01); J Hypromellose (S01KA02). Survival curves for patients not on medication at the time of diagnosis are displayed in gray. Survival curves for patients with concomitant medication are color-coded by medication ATC level. The survival curves for all the other medications are available via the ADRENALINE web application (https://adrenaline.curie.fr/survival_analysis). Source data are provided as a Source Data file. ATC Anatomical Therapeutic Chemical.
Fig. 9
Fig. 9. Causal inference pipeline of the study (left) and illustration for one medication (ranitidine, ATC code A02BA02, right).
Details are provided in the Methods. Abbreviations: PS propensity score, IPTW inverse probability of treatment weighting, SMD standardized mean difference, ATE average treatment effect, HR hazard ratio, ATC Anatomical Therapeutic Chemical, CT chemotherapy, TNBC triple-negative breast cancer, OS overall survival, DFS disease-free survival.

References

    1. Cho H, Mariotto AB, Mann BS, Klabunde CN, Feuer EJ. Assessing non-cancer-related health status of US cancer patients: other-cause survival and comorbidity prevalence. Am. J. Epidemiol. 2013;178:339–349. doi: 10.1093/aje/kws580. - DOI - PMC - PubMed
    1. Kimmick G, et al. Comorbidity burden and guideline-concordant care for breast cancer. J. Am. Geriatr. Soc. 2014;62:482–488. doi: 10.1111/jgs.12687. - DOI - PMC - PubMed
    1. Patnaik JL, Byers T, DiGuiseppi C, Denberg TD, Dabelea D. The influence of comorbidities on overall survival among older women diagnosed with breast cancer. J. Natl Cancer Inst. 2011;103:1101–1111. doi: 10.1093/jnci/djr188. - DOI - PMC - PubMed
    1. Aye PS, et al. Use of non-cancer medications in new zealand women at the diagnosis of primary invasive breast cancer: prevalence, associated factors and effects on survival. Int J. Environ. Res Public Health. 2020;17:E7962. doi: 10.3390/ijerph17217962. - DOI - PMC - PubMed
    1. Calip GS, et al. Polypharmacy and adherence to adjuvant endocrine therapy for breast cancer. JOP. 2017;13:e451–e462. doi: 10.1200/JOP.2016.018317. - DOI - PubMed