. 2024 Jun;43(11):2127-2165.
doi: 10.1038/s44318-024-00084-7. Epub 2024 Apr 5.

Limited oxygen in standard cell culture alters metabolism and function of differentiated cells

Affiliations

Limited oxygen in standard cell culture alters metabolism and function of differentiated cells

Joycelyn Tan et al. EMBO J. 2024 Jun.

Erratum in

Abstract

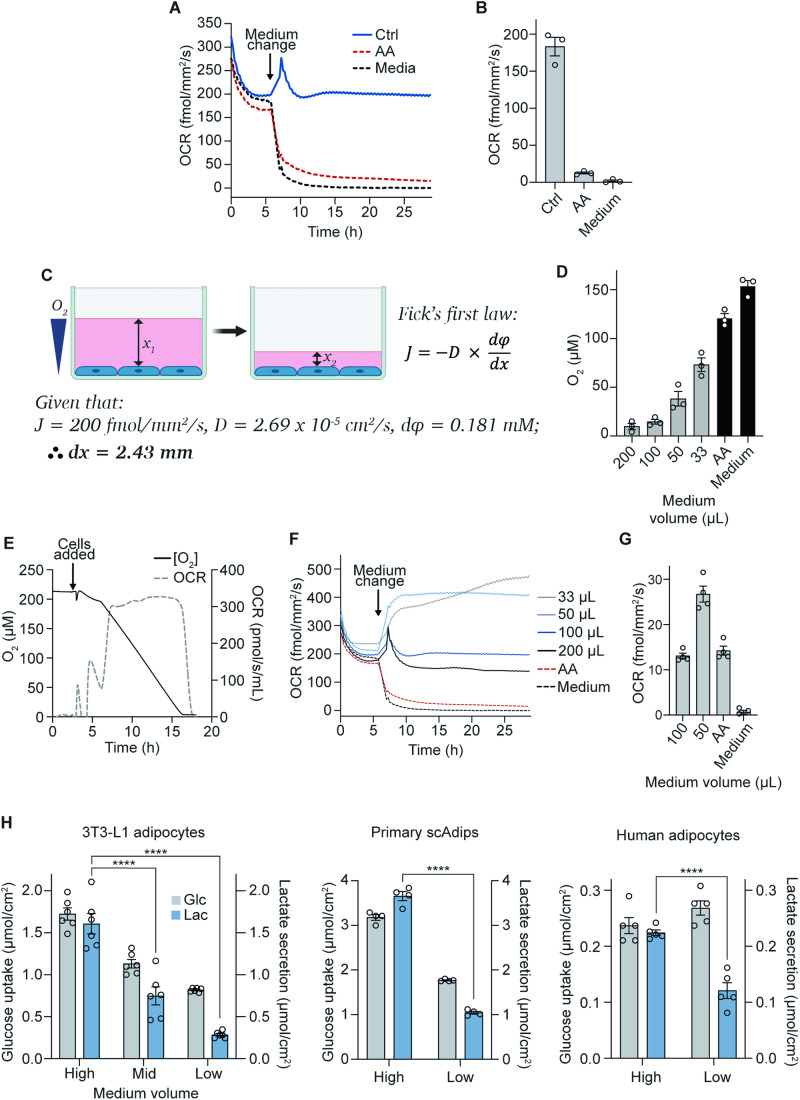
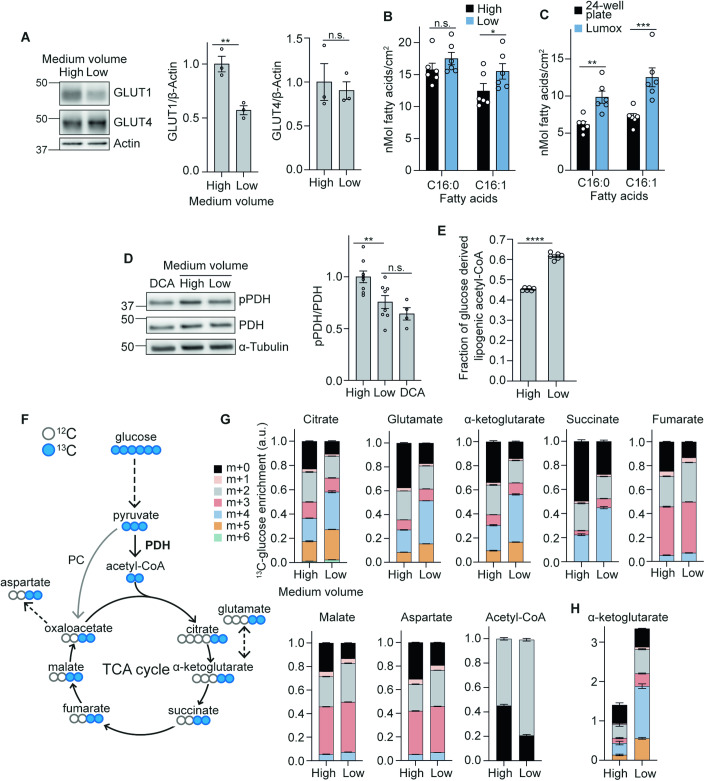
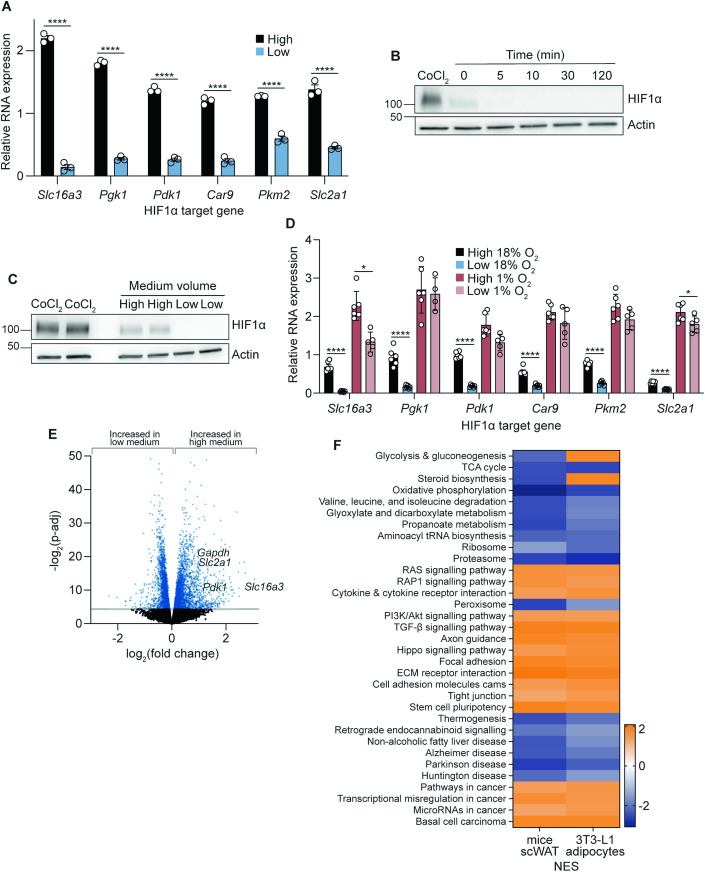
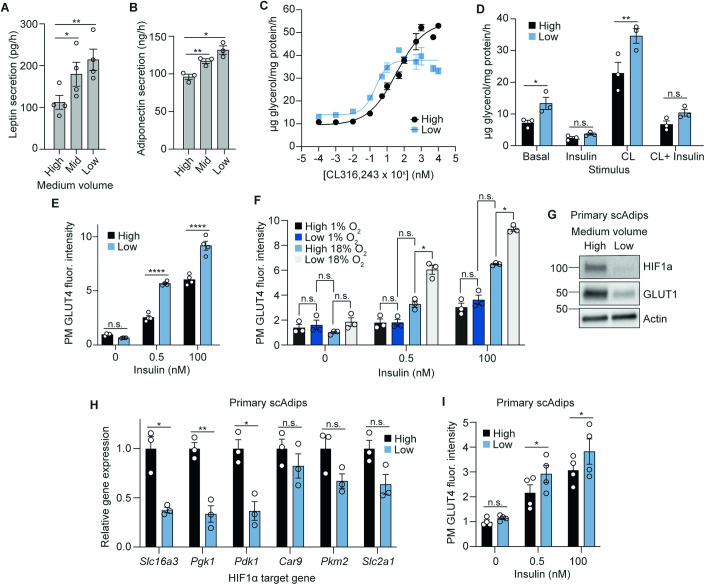
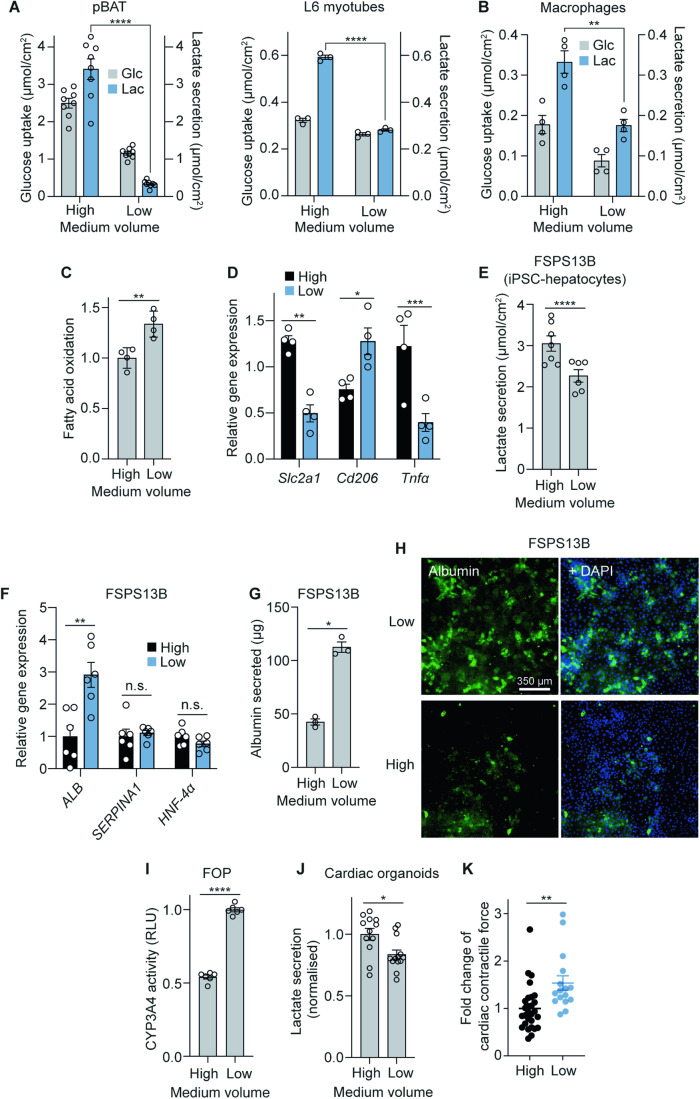
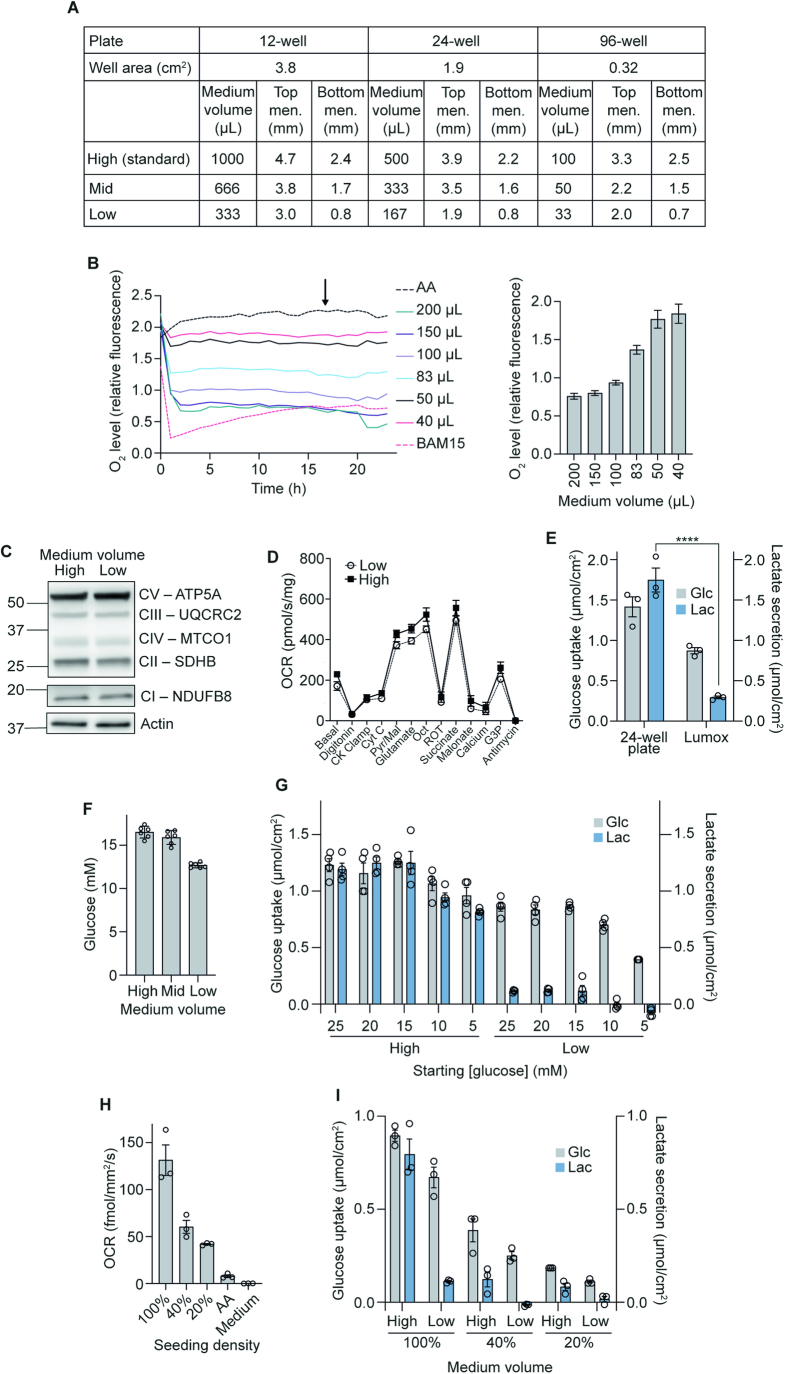
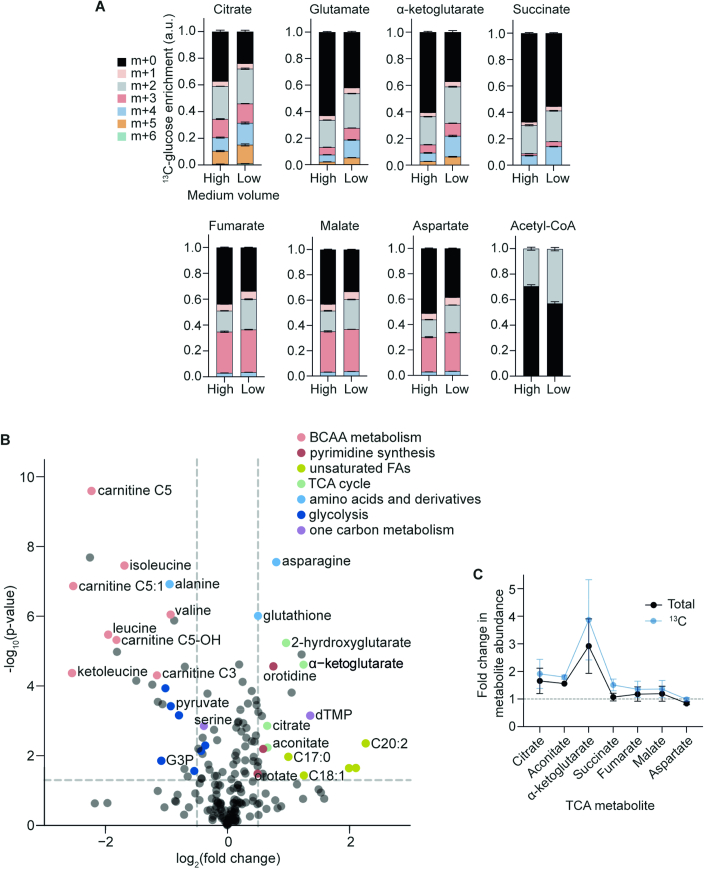
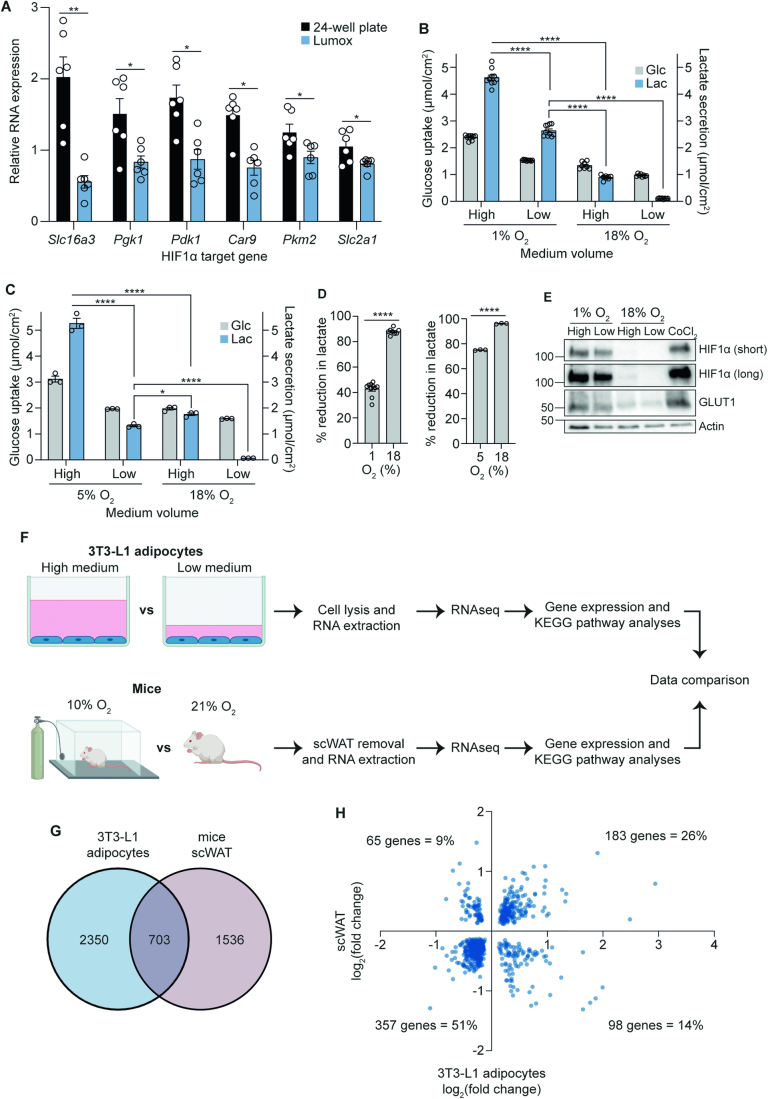
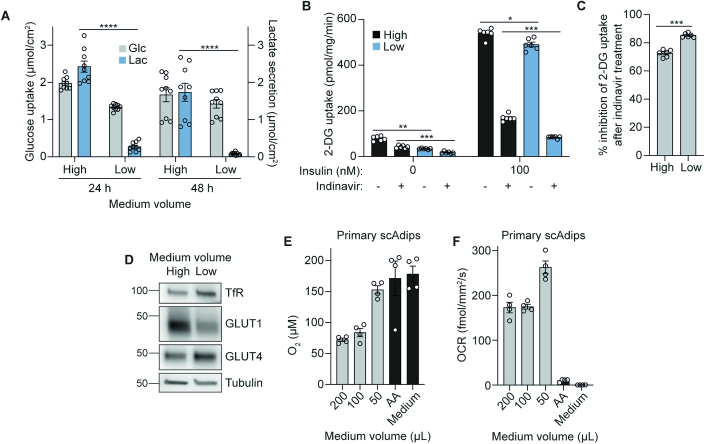
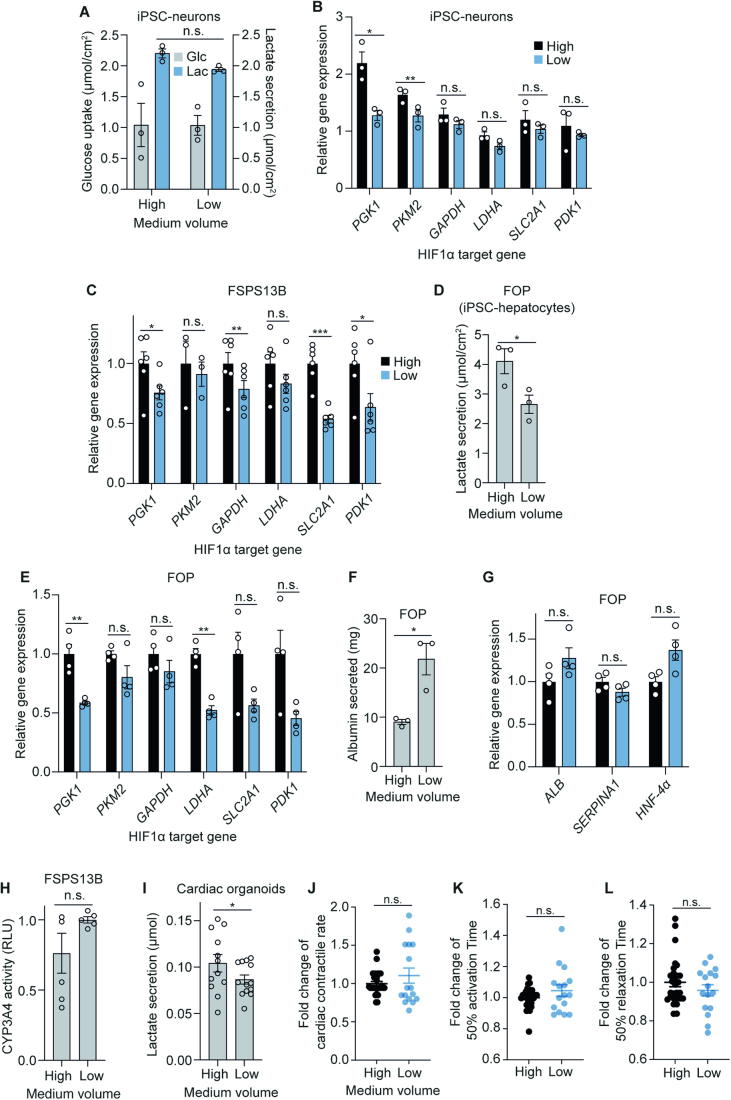
The in vitro oxygen microenvironment profoundly affects the capacity of cell cultures to model physiological and pathophysiological states. Cell culture is often considered to be hyperoxic, but pericellular oxygen levels, which are affected by oxygen diffusivity and consumption, are rarely reported. Here, we provide evidence that several cell types in culture actually experience local hypoxia, with important implications for cell metabolism and function. We focused initially on adipocytes, as adipose tissue hypoxia is frequently observed in obesity and precedes diminished adipocyte function. Under standard conditions, cultured adipocytes are highly glycolytic and exhibit a transcriptional profile indicative of physiological hypoxia. Increasing pericellular oxygen diverted glucose flux toward mitochondria, lowered HIF1α activity, and resulted in widespread transcriptional rewiring. Functionally, adipocytes increased adipokine secretion and sensitivity to insulin and lipolytic stimuli, recapitulating a healthier adipocyte model. The functional benefits of increasing pericellular oxygen were also observed in macrophages, hPSC-derived hepatocytes and cardiac organoids. Our findings demonstrate that oxygen is limiting in many terminally-differentiated cell types, and that considering pericellular oxygen improves the quality, reproducibility and translatability of culture models.

Keywords: Cell Culture; Hypoxia; Metabolism/Adipocytes; Oxygen Tension.


Conflict of interest statement

The authors declare no competing interests.

Figures

Figure 1
Figure 1. Oxygen is limiting for adipocyte respiration under standard culture conditions.
(A) 3T3-L1 adipocyte oxygen consumption rate (OCR) under control (100 µL), mitochondrial complex III inhibitor antimycin A (AA) treatment, or cell-free/medium-only conditions (96-well plate). Baseline OCR was measured for 6 h before starting AA treatment and removing cells from medium-only wells (representative of n = 3 biological replicates). (B) OCR measurements were taken after 20 h from (A) (n = 3 biological replicates). (C) Schematic representation of experimental setup and Fick’s first law of diffusion, which states that the rate of diffusion (J) is proportional to the concentration gradient (φ) and is inversely proportional to the diffusion length (x), where D is the diffusion coefficient. (D) Pericellular oxygen concentration at different medium volumes in 96-well plates (n = 3 biological replicates). (E) Oroboros measurements showing oxygen concentration and rate of OCR of 3T3-L1 adipocytes in a closed system (n = 3 biological replicates). (F) 3T3-L1 adipocyte OCR at different medium volumes, AA treatment, or medium-only conditions in 96-well plates. Baseline OCR (at 100 µL medium) was measured for 6 h before altering medium volumes or starting AA and medium-only treatments (representative of n = 3 biological replicates). (G) OCR under 1% oxygen with different medium volumes in 96-well plates (n = 4 biological replicates). (H) Extracellular medium glucose and lactate measurements from 3T3-L1 adipocytes (n = 6 biological replicates), primary subcutaneous white adipose tissue (scAdips) (n = 4 biological replicates), and human adipocytes (n = 5 biological replicates) 16 h after medium volume change. High = 1 mL, Mid = 0.67 mL, Low = 0.33 mL (in a 12-well plate) from hereafter unless stated otherwise. Data information: Data were represented as mean ± SEM (B, D, G, H). ****p < 0.0001 by two-way ANOVA with Šidák correction for multiple comparisons (H). See also Fig. EV1. Source data are available online for this figure.
Figure 2
Figure 2. Lowering medium volumes increases mitochondrial glucose oxidation.
(A) Western blot and quantification of GLUT1 and GLUT4 after 16 h of medium volume change (n = 3 biological replicates). (B) De novo lipogenesis (DNL) of palmitate (C16:0) and palmitoleate (C16:1) during 16 h of culture in high or low medium volumes in 12-well plates (n = 6 biological replicates). (C) DNL of palmitate and palmitoleate after 16 h in 24-well or gas-permeable Lumox plates (n = 6 biological replicates). (D) Western blot and quantification of phospho-pyruvate dehydrogenase (pPDH) over total PDH after 16 h of medium volume change in 12-well plates, with dichloroacetate (DCA) as a positive control (n = 4–8 biological replicates). (E) Fraction of newly synthesised lipids after 16 h of medium volume change and U13C-glucose labelling in 12-well plates (n = 6 biological replicates). (F) Schematic of 13C enrichment in TCA cycle metabolites after one cycle of U13C-glucose labelling. PC, pyruvate carboxylase. (G) Graphs show the fractional abundance of each isotopologue after 16 h medium volume change (n = 4–6 biological replicates). (H) Total abundance of α-ketoglutarate after 16 h medium volume change (n = 4–6 biological replicates). Data information: Data were represented as mean ± SEM (AE, G, H). n.s. non-significant; *p < 0.05, **p < 0.01, ****p < 0.0001 by paired two-tailed Student’s t-test (A, D and E) or by two-way ANOVA with Šidák correction for multiple comparisons (B, C). See also Fig. EV2. Source data are available online for this figure.
Figure 3
Figure 3. Lowering medium volumes induces a widespread transcriptional response reminiscent of physiological hypoxia.
(A) Relative RNA expression of HIF1α target genes after 16 h medium volume change in 12-well plates (n = 3 biological replicates). (B) Western blot of hypoxia-inducible factor (HIF) 1α at various time points after the transition to low medium volumes in 12-well plates, with 500 µM CoCl2 as a positive control (n = 3 biological replicates). (C) Western blot of HIF1α after 16 h medium volume change in 12-well plates, with 500 µM CoCl2 as positive control (n = 3 biological replicates). (D) Relative RNA expression of HIF1α target genes cultured in either 1 or 18% incubator oxygen for 16 h with different medium volumes in 12-well plates (n = 4–6 biological replicates). (E) Volcano plot of differentially expressed genes after 16 h medium volume change in 12-well plates (n = 6 biological replicates). (F) KEGG pathway analyses of 3T3-L1 adipocytes after 16 h medium volume change in 12-well plates (n = 6 biological replicates) and subcutaneous white adipose tissue (scWAT) from mice kept in 10 or 21% oxygen for 4 weeks (n = 10 biological replicates). Orange (positive NES) represents upregulated KEGG pathways in high medium (3T3-L1 adipocytes) or in 10% oxygen (mice scWAT). Blue (negative NES) represents upregulated KEGG pathways in low medium (3T3-L1 adipocytes) or in 21% oxygen (mice scWAT). NES, normalised enrichment score. Data information: Data were represented as mean ± SEM (A, D). *p < 0.05, ****p < 0.0001 by paired Student’s t-tests (A, D). p-adj threshold of 0.05 in (E) is the adjusted p value after controlling for the false discovery rate (FDR) with the Benjamini–Hochberg procedure. The raw p values were determined using the Wald test. See also Fig. EV3. Source data are available online for this figure.
Figure 4
Figure 4. Lowering medium volumes improves adipocyte function in both 3T3-L1s and scAdips.
(A) Rate of leptin secretion under different medium volume conditions in 12-well plates (n = 4 biological replicates). (B) Rate of adiponectin secretion under different medium volume conditions in 12-well plates (n = 3 biological replicates). (C) Dose-response curve of the lipolytic drug, CL316,243 treatment in 12-well plates (n = 3–7 biological replicates). (D) Rate of lipolysis measured by glycerol release, upon 100 nM insulin or 1 nM CL316,243 stimulation (n = 3 biological replicates). (E) Fluorescence intensity of plasma membrane (PM) GLUT4 upon insulin stimulation after 48 h medium volume change in 96-well plates (n = 4 biological replicates). (F) Fluorescence intensity of PM GLUT4 upon insulin stimulation after 48 h culture in either 1 or 18% incubator oxygen with medium volume changes in 96-well plates (n = 3 biological replicates). (G) Western blot of HIF1α and GLUT1 from primary scAdips after 16 h medium volume change (12-well plate), with 500 µM CoCl2 as positive control (n = 4 biological replicates). (H) Relative RNA expression of HIF1α target genes in primary scAdips after 16 h medium volume change (12-well plate) (n = 3 biological replicates). (I) Fluorescence intensity of primary scAdips PM GLUT4 upon insulin stimulation after 48 h medium volume change in 96-well plates (n = 4 biological replicates). Data information: Data were represented as mean ± SEM (A, B, DF, H, I). n.s. non-significant; *p < 0.05, **p < 0.01, ****p < 0.0001 by one/two-way ANOVA with Šidák correction for multiple comparisons (A, B, DF and I), or by paired Student’s t-tests (H). See also Fig. EV4. Source data are available online for this figure.
Figure 5
Figure 5. Lowering medium volumes reduces lactate production and improves functional outcomes in other cell types and organoids.
(A) Extracellular medium glucose and lactate measurements after 16 h medium volume change in 12-well plates in murine brown adipocytes (pBAT) (n = 8 biological replicates) and L6 myotubes (n = 3 biological replicates). (B) Extracellular measurements of primary macrophage medium glucose and lactate 16 h after medium volume change in 24-well plates (n = 4 biological replicates). (C) Fatty acid oxidation in primary macrophages after 16 h medium volume change in 24-well plates (n = 4 biological replicates). (D) Relative RNA expression of HIF1α target gene Slc2a1, anti-inflammatory marker Cd206, and inflammatory marker Tnfα in primary macrophages after 16 h medium volume change in 24-well plates (n = 4 biological replicates). (E) Lactate secretion in FSPS13B iPSC-derived hepatocytes (High = 1 mL, Low = 0.5 mL) after medium volume change in 12-well plates throughout differentiation (n = 6–7 biological replicates). (F) Relative RNA expression of hepatocyte differentiation marker genes in FSPS13B hepatocytes after medium volume change in 12-well plates throughout differentiation (n = 6 biological replicates). (G) Albumin secretion over 24 h by FSPS13B hepatocytes after medium volume change in 12-well plates throughout differentiation (n = 3 biological replicates). (H) Immunofluorescence of albumin in FSPS13B hepatocytes after medium volume change throughout differentiation (n = 3 biological replicates). Scale bar = 350 µm. (I) Relative CYP3A4 activity in FOP hepatocytes after medium volume change throughout differentiation (n = 6 biological replicates). (J) Lactate secretion in cardiac organoids after 48 h of medium volume change in 96-well plates (normalised) (n = 3–6 technical replicates from n = 3 biological replicates). High = 150 µL, Low = 50 µL. (K) Cardiac contractile force (normalised) (n = 2–17 technical replicates from n = 4 biological replicates). Data information: Data were represented as mean ± SEM (AG, IK). n.s. non-significant; *p < 0.05, **p < 0.01, ***p < 0.001, ****p < 0.0001 by one/two-way ANOVA with Šidák correction for multiple comparisons (A, B, D) or by paired/unpaired two-tailed Student’s t-test (C, EG, I, J, K). See also Fig. EV5. Source data are available online for this figure.
Figure EV1
Figure EV1. Changes in glucose metabolism in low medium is due to increased oxygen availability.
(A) Table of medium volumes used in this study and the corresponding medium heights of both top and bottom menisci. Images of each plate-type containing different medium volumes were used to measure menisci heights. Known well diameters were used to convert menisci heights from pixels to mm. ‘High’ refers to the standard culture volumes used. (B) Representative trace of fluorescence intensity indicative of pericellular oxygen concentrations under different medium volumes, measured for 24 h in 96-well plates. The bar graph shows relative oxygen levels taken at 16 h (arrow in representative trace) (n = 4 biological replicates). AA antimycin A. (C) Western blot of mitochondrial respiratory complexes I–V after 16 h of medium volume change in 12-well plates (n = 3 biological replicates). (D) Oxygen consumption rate (OCR) of permeabilised 3T3-L1 adipocytes upon different substrate stimulation after 16 h of medium volume change (n = 5 biological replicates). (E) Extracellular medium glucose and lactate measurements in 24-well or Lumox plates after 16 h culture in high or low medium volumes (n = 3 biological replicates). (F) Medium glucose concentration after 16 h of medium volume change in 12-well plates (n = 6 biological replicates). (G) Extracellular medium glucose and lactate measurements after 16 h medium volume change with different starting glucose concentrations in 12-well plates. (n = 4 biological replicates). (H) OCR measurements from different cell densities in 96-well plates (n = 3 biological replicates). (I) Extracellular medium glucose and lactate measurements after 16 h medium volume change with different cell densities in 12-well plates measured by DNA concentration. (n = 3 biological replicates). Data information: Data were represented as mean ± SEM (B, DI). ****p < 0.0001 by two-way ANOVA with Šidák correction for multiple comparisons (E).
Figure EV2
Figure EV2. Lowering medium volumes rewires cellular metabolism.
(A) Fractional abundance of each isotopologue after 4 h medium volume change (n = 6 biological replicates). (B) Volcano plot of differentially regulated metabolites after 16 h medium volume change. Metabolites of interest which are significantly changed (p < 0.05) are highlighted according to their metabolic pathways (n = 6 biological replicates). BCAA branched-chain amino acid, FA fatty acid, G3P glyceraldehyde−3−phosphate. (C) Fold change of total and U13C-glucose labelled TCA metabolite abundance after 16 h medium volume change in 12-well plates (n = 4 biological replicates). Data information: Data were represented as mean ± SEM (A, C). p value threshold of 0.05 (B) was determined using differential metabolite analysis (DMA) with Student’s t-test.
Figure EV3
Figure EV3. Reducing oxygen availability causes metabolic and transcriptional rewiring.
(A) Relative RNA expression of HIF1α target genes in 3T3-L1 adipocytes cultured in either 24-well or gas-permeable Lumox plates (n = 6 biological replicates). (B) Extracellular medium glucose and lactate measurements after 16 h medium volume change (12-well plate) in 1 or 18% oxygen incubators (n = 8–10 biological replicates). (C) Extracellular medium glucose and lactate measurements after 16 h medium volume change (12-well plate) in 5 or 18% oxygen incubators (n = 3 biological replicates). (D) Percentage reduction in lactate production calculated from Fig. EV3B (1% O2) (n = 8–10 biological replicates) and EV3C (5% O2) (n = 3 biological replicates). (E) Western blot of HIF1α (after both short and long imaging exposures) and GLUT1 after 16 h medium volume change at 1 or 18% O2 in 12-well plates (n = 3 biological replicates). (F) Schematic representation of the RNAseq experimental workflow. RNA extracted from 3T3-L1 adipocytes (cultured in high or low medium for 16 h in 12-well plates) or scWAT (obtained from mice kept in 10 or 21% O2 for 4 weeks) were sequenced. The two sets of analysed data were then compared. (G) Venn diagram showing the overlapping differentially expressed genes (p-adj < 0.05) from both 3T3-L1 adipocytes (high vs low medium) (n = 6 biological replicates) and mice scWAT (10 vs 21% O2) (n = 10 biological replicates). (H) Fold change of the 703 differentially expressed genes in 3T3-L1 adipocytes (y-axis) and mice scWAT (x-axis) from the intersection in Fig. EV3D, showing a 77% directional concordance. Data information: Data were represented as mean ± SEM (AD). *p < 0.05, **p < 0.01, ****p < 0.0001 by two-way ANOVA with Šidák correction for multiple comparisons (B, C), or by paired/unpaired Student’s t-tests (A, D).
Figure EV4
Figure EV4. Effects of lowering medium volumes on 3T3-L1 adipocyte glucose metabolism and oxygen use in primary scAdips.
(A) Extracellular measurements of 3T3-L1 medium glucose and lactate 24 or 48 h after medium volume change in 12-well plates (n = 3 technical replicates from n = 3 biological replicates). (B) 2-deoxyglucose (DG) uptake after insulin stimulation and 200 µM indinavir (GLUT4 inhibitor) treatment. Cells were cultured in high or low medium for 48 h in 24-well plates prior to the experiment (n = 6 biological replicates). (C) Percentage inhibition of 2-DG uptake after indinavir treatment, calculated from the difference between +/− indinavir treated conditions, as a percentage of -indinavir 2-DG uptake upon 100 nM insulin stimulation. Graph shows the percentage of 2-DG uptake that is GLUT4-dependent (i.e. inhibited by indinavir) (n = 6 biological replicates). (D) Western blot of GLUT1 and GLUT4 in 3T3-L1s after 48 h medium volume change (12-well plate) (n = 6 biological replicates). (E) The pericellular oxygen concentration of primary scAdips cultured with different medium volumes in 96-well plates (n = 4 biological replicates). AA antimycin A. (F) OCR of primary scAdips cultured with different medium volumes in 96-well plates (n = 4 biological replicates). Data information: Data were represented as mean ± SEM (AD). *p < 0.05, **p < 0.01, ***p < 0.001, ****p < 0.0001 by two-way ANOVA with Šidák correction for multiple comparisons (A. B), or by paired two-tailed Student’s t-test (C).
Figure EV5
Figure EV5. Effects of low medium volumes on other primary and hPSC-derived cell types.
(A) Extracellular medium glucose and lactate measurements from iPSC-derived neurones after 16 h medium volume change in 6-well plates (n = 3 biological replicates). (B) Relative RNA expression of HIF1α target genes in iPSC-derived neurones after 16 h medium volume change in 12-well plates (n = 3 biological replicates). (C) Relative RNA expression of HIF1α target genes in FSPS13B hepatocytes cultured under different medium volumes in 12-well plates throughout differentiation (n = 3–6 biological replicates). (D) Lactate secretion in FOP hepatocytes after medium volume change in 12-well plates throughout differentiation (n = 3 biological replicates). (E) Relative RNA expression of HIF1α target genes in FOP hepatocytes cultured under different medium volumes in 12-well plates throughout differentiation (n = 4 biological replicates). (F) Albumin secretion over 24 h by FOP hepatocytes after medium volume change in 12-well plates throughout differentiation (n = 3 biological replicates). (G) Relative RNA expression of hepatocyte differentiation marker genes in FOP hepatocytes after medium volume change in 12-well plates throughout differentiation (n = 4 biological replicates). (H) Relative CYP3A4 activity in FSPS13B hepatocytes after medium volume change throughout differentiation (n = 5 biological replicates). (I) Lactate secretion by cardiac organoids after 48 h of medium volume change (n = 3–6 technical replicates from n = 3 biological replicates). High = 150 µL, Low = 50 µL. (J) Contractile rate (normalised) (n = 2–17 technical replicates from n = 4 biological replicates). (K) Time from 50% activation to peak (normalised) (n = 2–17 technical replicates from n = 4 biological replicates). (L) Time from peak to 50% relaxation (normalised) (n = 2–17 technical replicates from n = 4 biological replicates). Data information: All data were represented as mean ± SEM (AL). n.s. non-significant; *p < 0.05, **p < 0.01, ***p < 0.001 by two-way ANOVA (A) or by paired/unpaired two-tailed Student’s t-test (BL).

References

    1. Abo KM, Sainz de Aja J, Lindstrom-Vautrin J, Alysandratos K-D, Richards A, Garcia-de-Alba C, Huang J, Hix OT, Werder RB, Bullitt E et al (2022) Air-liquid interface culture promotes maturation and allows environmental exposure of pluripotent stem cell-derived alveolar epithelium. JCI Insight 7:e155589 10.1172/jci.insight.155589 - DOI - PMC - PubMed
    1. Alvarez MJ, Shen Y, Giorgi FM, Lachmann A, Ding BB, Ye BH, Califano A (2016) Functional characterization of somatic mutations in cancer using network-based inference of protein activity. Nat Genet 48:838–847 10.1038/ng.3593 - DOI - PMC - PubMed
    1. Anders S, Pyl PT, Huber W (2015) HTSeq-a Python framework to work with high-throughput sequencing data. Bioinformatics 31:166–169 10.1093/bioinformatics/btu638 - DOI - PMC - PubMed
    1. Anvari G, Bellas E (2021) Hypoxia induces stress fiber formation in adipocytes in the early stage of obesity. Sci Rep 11:21473 10.1038/s41598-021-00335-1 - DOI - PMC - PubMed
    1. Argus JP, Wilks MQ, Zhou QD, Hsieh WY, Khialeeva E, Hoi XP, Bui V, Xu S, Yu AK, Wang ES et al (2018) Development and application of FASA, a model for quantifying fatty acid metabolism using stable isotope labeling. Cell Rep 25:2919–2934.e8 10.1016/j.celrep.2018.11.041 - DOI - PMC - PubMed