. 2024 Sep;29(9):2787-2798.
doi: 10.1038/s41380-024-02540-6. Epub 2024 Apr 5.

Social experience in adolescence shapes prefrontal cortex structure and function in adulthood

Affiliations

Social experience in adolescence shapes prefrontal cortex structure and function in adulthood

Dan C Li et al. Mol Psychiatry. 2024 Sep.

Abstract

During adolescence, the prefrontal cortex (PFC) undergoes dramatic reorganization. PFC development is profoundly influenced by the social environment, disruptions to which may prime the emergence of psychopathology across the lifespan. We investigated the neurobehavioral consequences of isolation experienced in adolescence in mice, and in particular, the long-term consequences that were detectable even despite normalization of the social milieu. Isolation produced biases toward habit-like behavior at the expense of flexible goal seeking, plus anhedonic-like reward deficits. Behavioral phenomena were accompanied by neuronal dendritic spine over-abundance and hyper-excitability in the ventromedial PFC (vmPFC), which was necessary for the expression of isolation-induced habits and sufficient to trigger behavioral inflexibility in socially reared controls. Isolation activated cytoskeletal regulatory pathways otherwise suppressed during adolescence, such that repression of constituent elements prevented long-term isolation-induced neurosequelae. Altogether, our findings unveil an adolescent critical period and multi-model mechanism by which social experiences facilitate prefrontal cortical maturation.


Conflict of interest statement

COMPETING INTERESTS

The authors declare no competing interests.

Figures
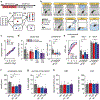
Fig. 1
Fig. 1. Social isolation during adolescence causes persistent reward-related behavioral effects despite re-socialization (RS) in adulthood or non-social environmental enrichment (EE).
a Timeline of adolescent isolation, RS, and EE procedures. b Timeline of behavioral tasks. Novelty-suppressed feeding (NSF). Forced-swim test (FST). c Responses across training (session: F5,150 = 53.5, p < 0.001; session × group: F15,150 < 1). d Left panel. Choice test responses (reinforcement: F1,34 = 17.8, p < 0.001; session × group: F3,34 = 5.25, p = 0.004). Right panel. Choice test response preference ratios (F3,34 = 7.80, p < 0.001). e Left panel. Success rate by which mice acquired a new, lever-press response (lever presses/total responses) across sessions (session: F3,102 = 120, p < 0.001; session × group: F9,102 < 1). Right panels. Response rate during first (F3,34 = 3.22, p = 0.035) and final session (F3,34 = 3.61, p = 0.023). f Break point during progressive ratio task (F3,34 = 11.3, p < 0.001). g Amount of sucrose solution consumed during one-hour session (F3,34 = 8.17, p < 0.001). h Latency to approach food during NSF task (F3,34 < 1). i Total time spent immobile during the FST (F3,34 < 1). Data presented as individual points or mean ± S.E.M. *p < 0.05 (post-hoc) between the bars positioned below the line terminals. #p = 0.070. Not significant (ns). See Supplementary Table 1 for complete statistics.
Fig. 2
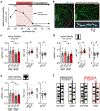
Fig. 2. Social isolation during adolescence produces persistent dendritic spine over-abundance on deep-layer vmPFC neurons.
a Schematic of the developmental trajectory of dendritic spine densities on excitatory PFC neurons (adapted from [65, 97]). b Dendritic spine imaging in the vmPFC (blue bar) of Thy1-YFP-expressing mice. Prelimbic (PL). Infralimbic (IL). Right, bottom. Representative three-dimensional dendritic spine reconstruction. Scale bar = 20 μm (top). Scale bar = 2 μm (bottom). Mushroom spine (M). Thin spine (T). c Left panel. Dendritic spine density for all spines imaged at postnatal day 42 (“adol”) or 70 (“adult”) (age: F1,141 = 33.2, p < 0.001; isolation: F1,141 = 9.22, p = 0.003; age × isolation: F1,141 = 1.24, p = 0.267). Right panels. Spine density proportions for all spines (iso/soc: t72 = 2.54, p = 0.013; adult/adol: t84 = 2.19, p = 0.031). d, e Left panels. Dendritic spine density stratified by thin- (age: F1,141 = 20.4, p < 0.001; isolation: F1,141 = 10.6, p < 0.001; age × isolation: F1,141 < 1) and mushroom-type spines (age: F1,141 = 11.9, p = 0.001; isolation: F1,141 < 1; age × isolation: F1,141 < 1). Right panels. Spine density proportions stratified by thin- (iso/soc: t72 = 2.07, p = 0.042; adult/adol: t84 = 1.86, p = 0.066) and mushroom-type spines (iso/soc: t72 = 1.40, p = 0.165; adult/adol: t84 = 1.24, p = 0.218). f Summarized consequence of isolation – failure of thin-type dendritic spine pruning during adolescence. Data presented as individual points (solid=per animal; semi-transparent=per dendrite). *p < 0.05. #p = 0.066. p < 0.05 in one-sample test vs. 1. See Supplementary Table 2 for complete statistics.
Fig. 3
Fig. 3. Intrinsic and synaptic hyper-excitability among deep-layer vmPFC neurons following adolescent social isolation.
a Recordings were collected from layer V vmPFC neurons, identified by YFP expression. b Action potential firing frequency in response to depolarizing current injection (current × isolation: F3,123 = 4.41, p = 0.006). c Membrane potential deflection in response to hyperpolarizing current injection (current × isolation F4,164 = 5.35, p < 0.001). d Membrane voltage required to elicit action potential (t32 = 2.38, p = 0.012). e, f Frequency and amplitude of spontaneous EPSC (sEPSC) events (t32 = 1.81, p = 0.04; t32 = 0.387, p = 0.10). g Ratio of AMPAR- to NMDAR-mediated of evoked EPSCs (t32 = 0.49, p = 0.317). Data presented as individual points. *p < 0.05 (main effect or post-hoc). See Supplementary Table 3 for complete statistics.
Fig. 4
Fig. 4. vmPFC neuron activity bidirectionally modulates flexible decision making.
a Timeline of isolation and behavioral procedure assessing behavioral flexibility. b, c Viral-mediated rM3Ds and hM4Di targeting the vmPFC (blue bar). d Responses across training (session: F8,64 = 14.7, p < 0.001; session × virus: F8,64 = 1.32, p = 0.005). e Choice test responses following CNO (test 1; reinforcement: F1,20 = 9.65, p = 0.006; reinforcement × virus: F1,20 = 12.2, p = 0.002) and vehicle administration (test 2; reinforcement: F1,13 = 31.3, p < 0.001; reinforcement × virus: F1,13 = 3.04, p = 0.105). f Choice test response preference ratios following CNO (test 1; t20 = 3.78, p = 0.001) and vehicle administration (test 2; t13 < 1). g Responses across training (session: F6,246 = 22.3, p < 0.001; session × isolation × virus: F6,246 = 0.67, p = 0.675) h Choice test responses (reinforcement: F1,42 = 36.1, p < 0.001; reinforcement × isolation × virus: F1,42 = 7.28, p = 0.010). i Choice test response preference ratios (isolation: F1,42 = 1.53, p = 0.223; virus: F1,42 = 3.81, p = 0.058; isolation × virus: F1,42 = 6.39, p = 0.015). Data presented as individual points or mean ± S.E.M. *p < 0.05 (main effect or post-hoc). p < 0.05 (one-sample test vs. 1). See Supplementary Table 4 for complete statistics.
Fig. 5
Fig. 5. Viral-mediated Rock2 knockdown (KD) in the vmPFC during adolescence, but not adulthood, blocks long-term behavioral deficits following social isolation.
a Experimental timeline and ROCK2-LIMK-cofilin pathway regulation of actin dynamics and dendritic spine structure. b Quantification of ROCK2 (t14 = 2.29, p = 0.038), LIMK (t14 = 1.87, p = 0.073) and cofilin (t14 = 2.47, p = 0.027) phosphorylation in vmPFC. Values normalized to loading controls (HSP-70) and expressed as fold change from socially reared controls. Representative blots show target protein (black arrow) and HSP-70 loading controls (no arrow). c Correlation between ROCK2 and cofilin phosphorylation (F1,14 = 5.75, p = 0.031). 95% confidence interval (grey shading). df Viral-mediated expression of Rock2 shRNA or scrambled shRNA constructs targeting the vmPFC, particularly highlighting equivalent transduction patterns in the isolation groups. All groups are represented in the supplementary materials. g Timelines of viral infusions inducing adolescent- or adult-onset Rock2 knockdown (KD). h, l Responses across training for adolescent- (session: F5,160 = 66.4, p < 0.001; session × isolation × virus: F5,160 < 1) and adult-onset KD (session: F5,120 = 66.8, p < 0.001; session × isolation × virus: F5,120 < 1). i, m Left panels. Choice test responses for adolescent- (reinforcement: F1,32 = 46.4, p < 0.001; reinforcement × isolation × virus: F1,32 = 5.70, p = 0.023) and adult-onset KD (reinforcement: F1,24 = 34.5, p < 0.001; reinforcement × isolation × virus: F1,24 < 1). Right panels. Choice test response preference ratios for adolescent- (isolation: F1,32 = 8.87, p = 0.005; virus: F1,32 < 1; isolation × virus: F1,32 = 4.55, p = 0.041) and adult-onset KD (isolation: F1,24 = 11.8, p = 0.002; virus: F1,24 < 1; isolation × virus: F1,24 < 1). j, n Break point during progressive ratio task for adolescent- (isolation: F1,32 = 24.3, p < 0.001; virus: F1,32 = 9.34, p = 0.005; isolation × virus: F1,32 = 4.18, p = 0.049) and adult-onset KD (isolation: F1,24 = 21.5, p < 0.001; virus: F1,24 = 1.90, p = 0.181; isolation × virus: F1,24 = 2.98, p = 0.097). k, o Amount of sucrose solution consumed following adolescent- (isolation: F1,32 = 2.83, p = 0.102; virus: F1,32 = 5.70, p = 0.023; isolation × virus: F1,32 = 4.28, p = 0.047) and adult-onset KD (isolation: F1,24 = 7.24, p = 0.013; virus: F1,24 < 1; isolation × virus: F1,24 < 1). Data presented as individual points or mean ± S.E.M. *p < 0.05 (main effect or post-hoc). #p = 0.070. See Supplementary Table 5 for complete statistics.

References

    1. Baumeister RF, Leary MR. The need to belong: desire for interpersonal attachments as a fundamental human motivation. Psychol Bull. 1995;117:497–529. - PubMed
    1. Leigh-Hunt N, Bagguley D, Bash K, Turner V, Turnbull S, Valtorta N, et al. An overview of systematic reviews on the public health consequences of social isolation and loneliness. Public Health. 2017;152:157–71. 10.1016/j.puhe.2017.07.035. - DOI - PubMed
    1. Matthews GA, Tye KM. Neural mechanisms of social homeostasis. Ann N. Y Acad Sci 2019;1457:5–25. 10.1111/nyas.14016. - DOI - PMC - PubMed
    1. Li DC, Hinton EA, Gourley SL. Persistent behavioral and neurobiological consequences of social isolation during adolescence. Semin Cell Dev Biol. 2021;118:73–82. 10.1016/j.semcdb.2021.05.017. - DOI - PMC - PubMed
    1. Spear LP. The adolescent brain and age-related behavioral manifestations. Neurosci Biobehav Rev. 2000;24:417–63. 10.1016/s0149-7634(00)00014-2. - DOI - PubMed

LinkOut - more resources