. 2025 Feb;43(2):258-268.
doi: 10.1038/s41587-024-02186-3. Epub 2024 Apr 5.

Gene trajectory inference for single-cell data by optimal transport metrics

Affiliations

Gene trajectory inference for single-cell data by optimal transport metrics

Rihao Qu et al. Nat Biotechnol. 2025 Feb.

Abstract

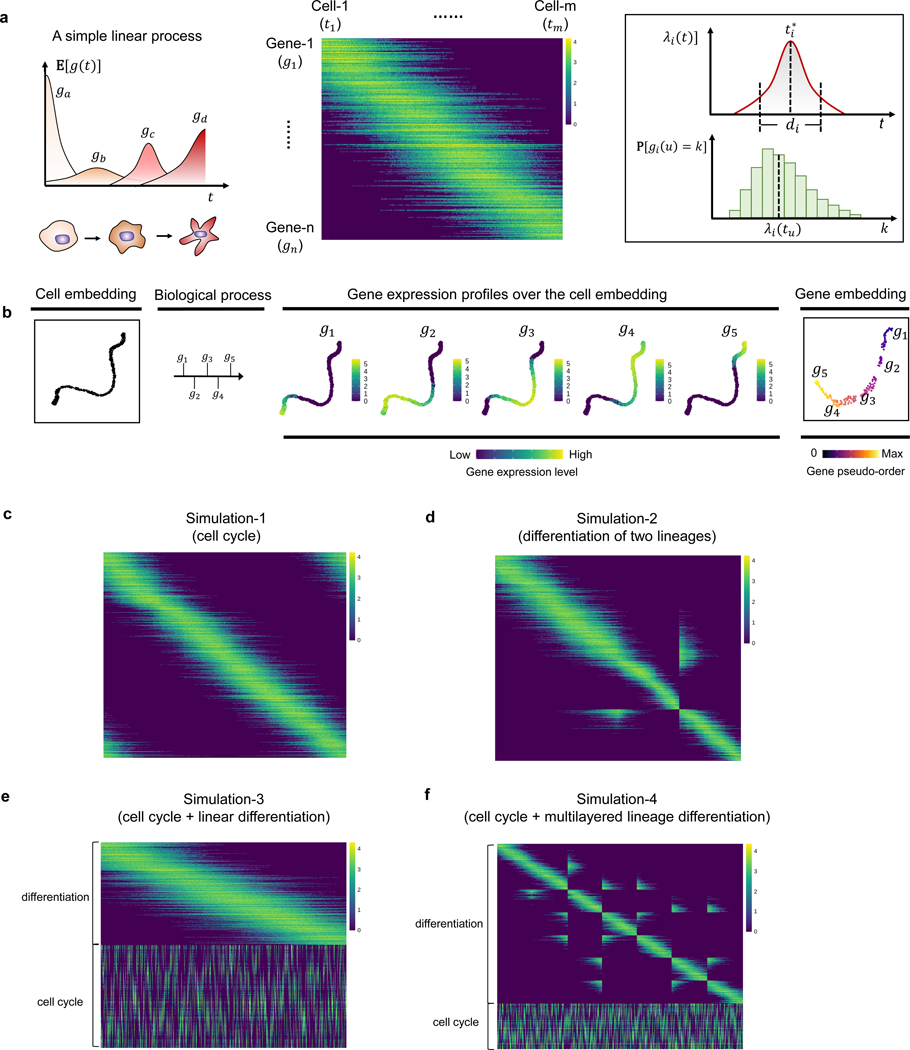
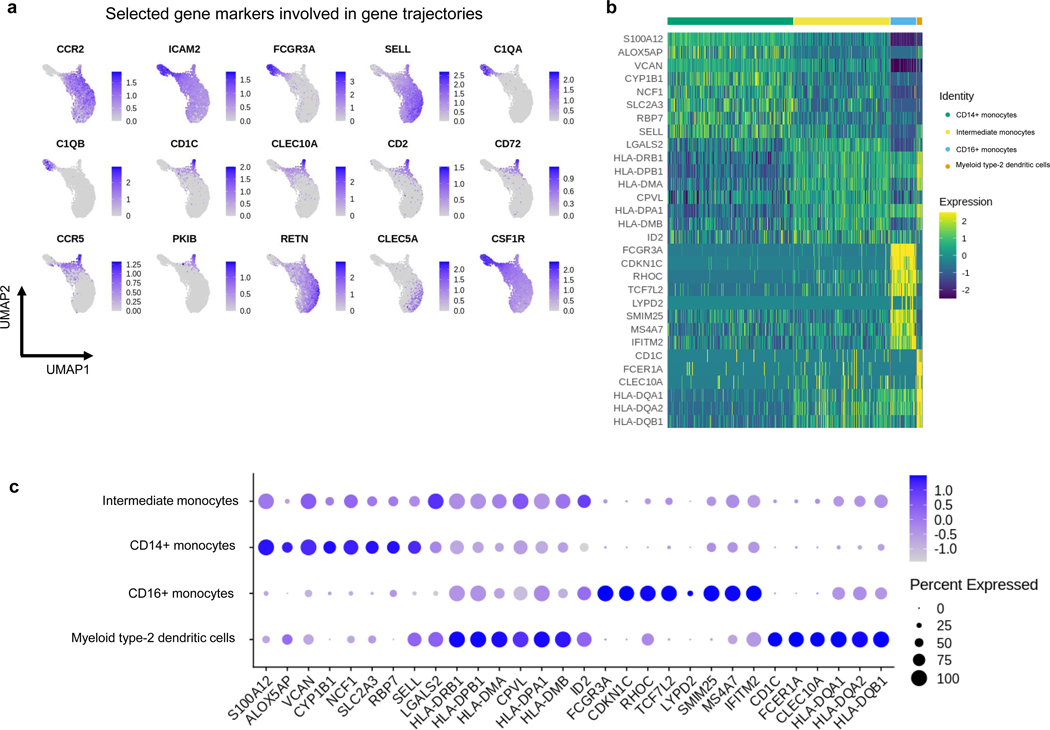
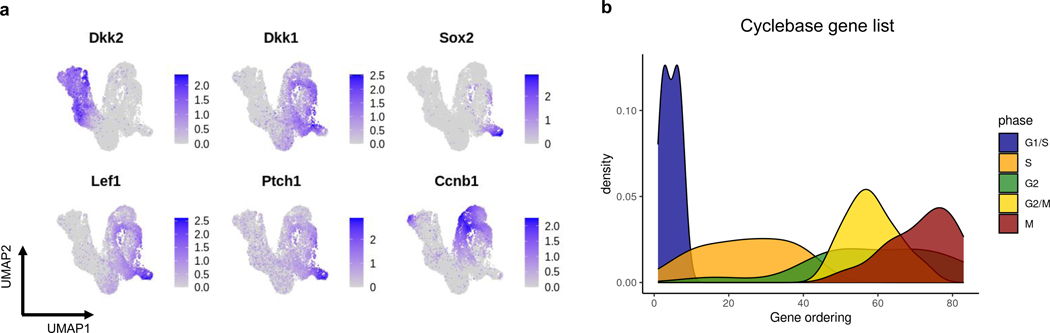
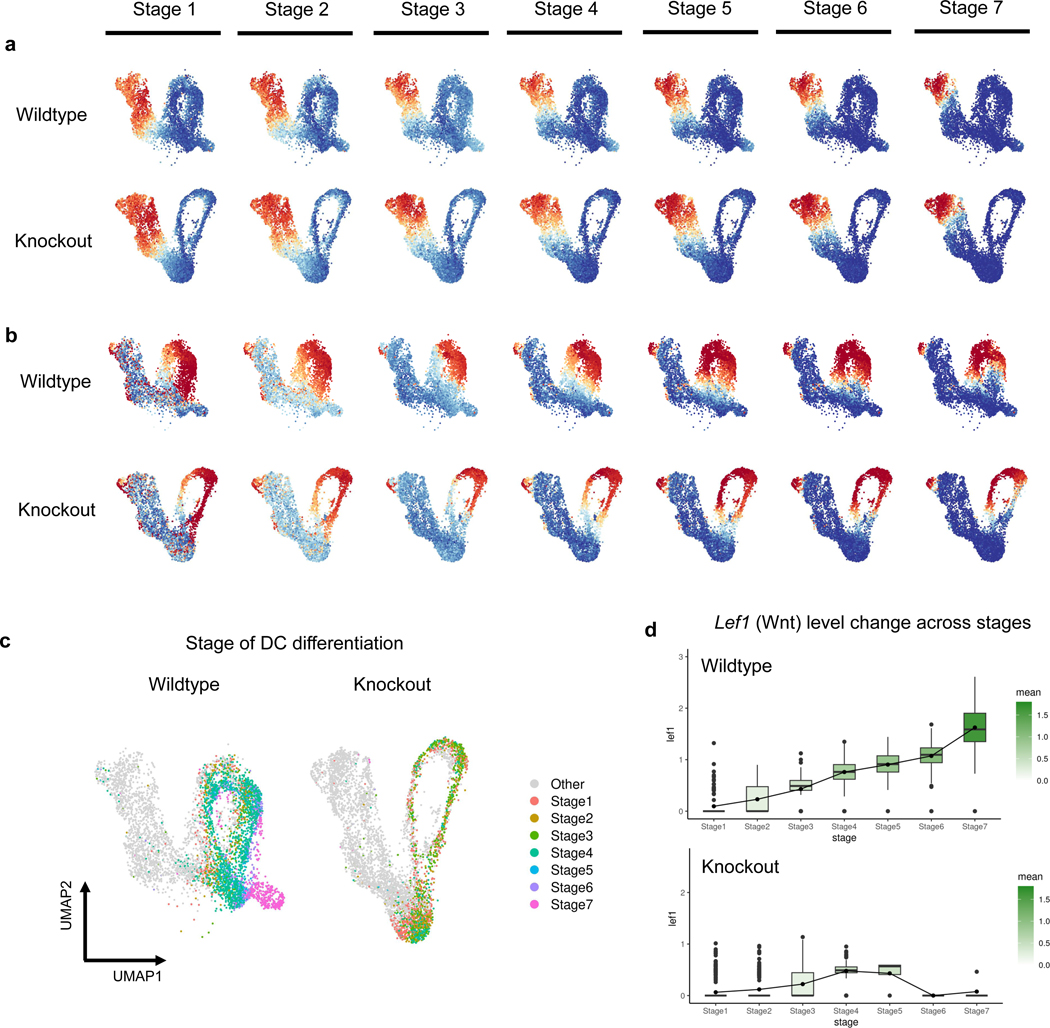
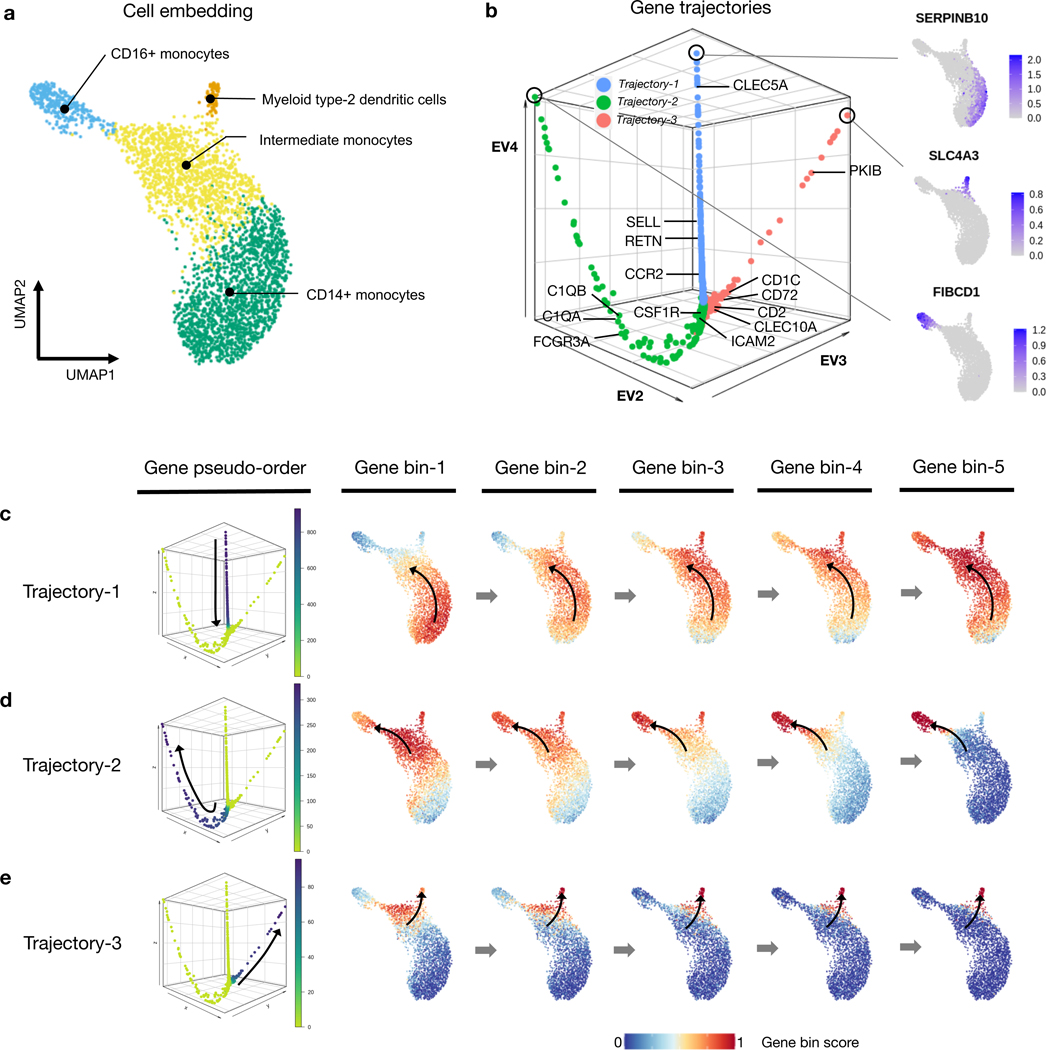
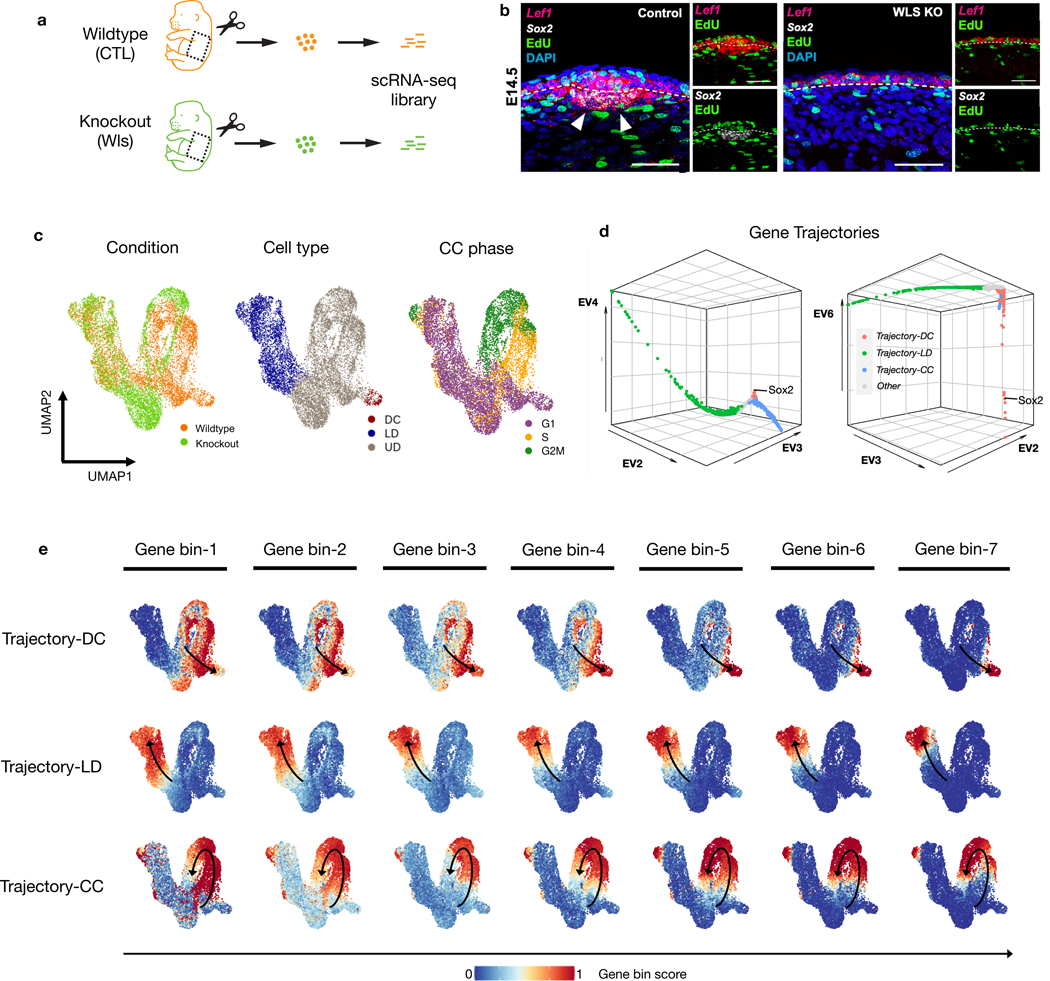
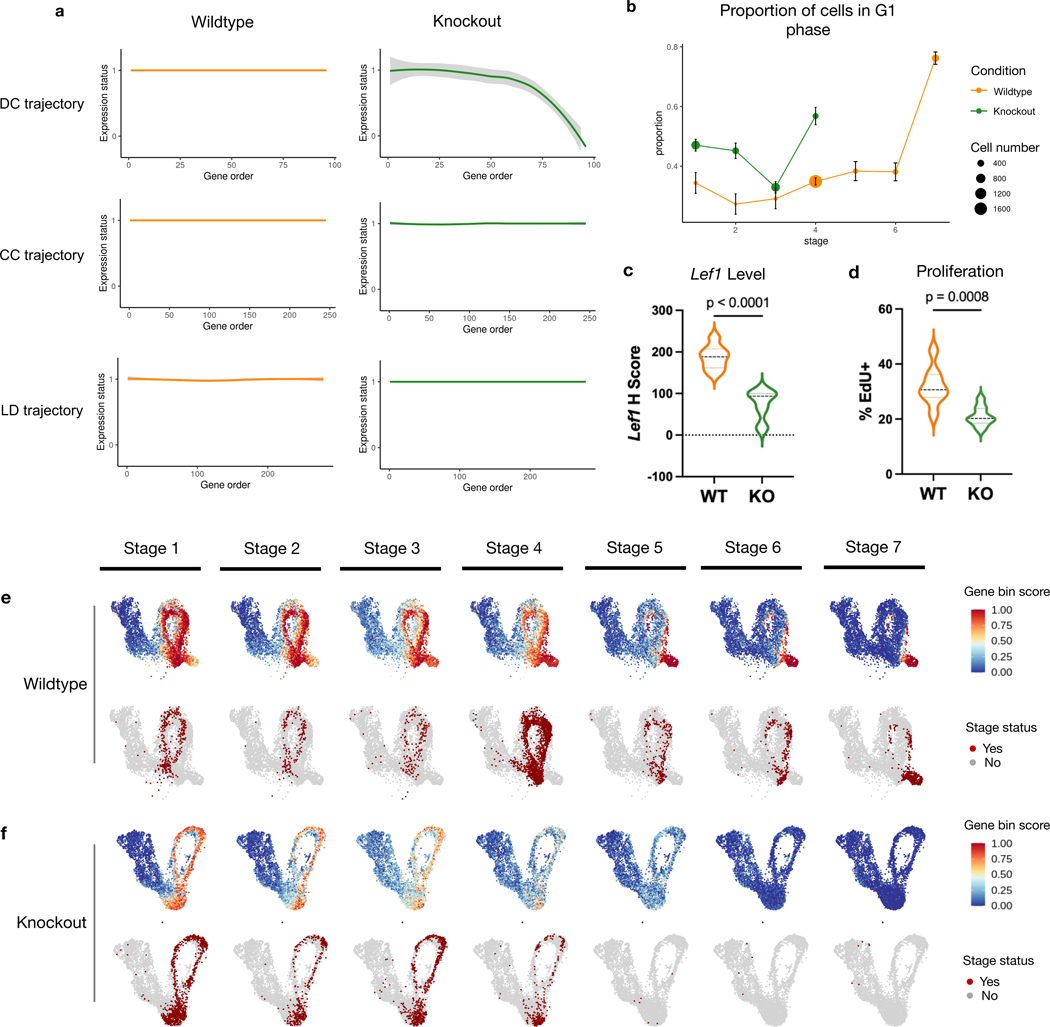
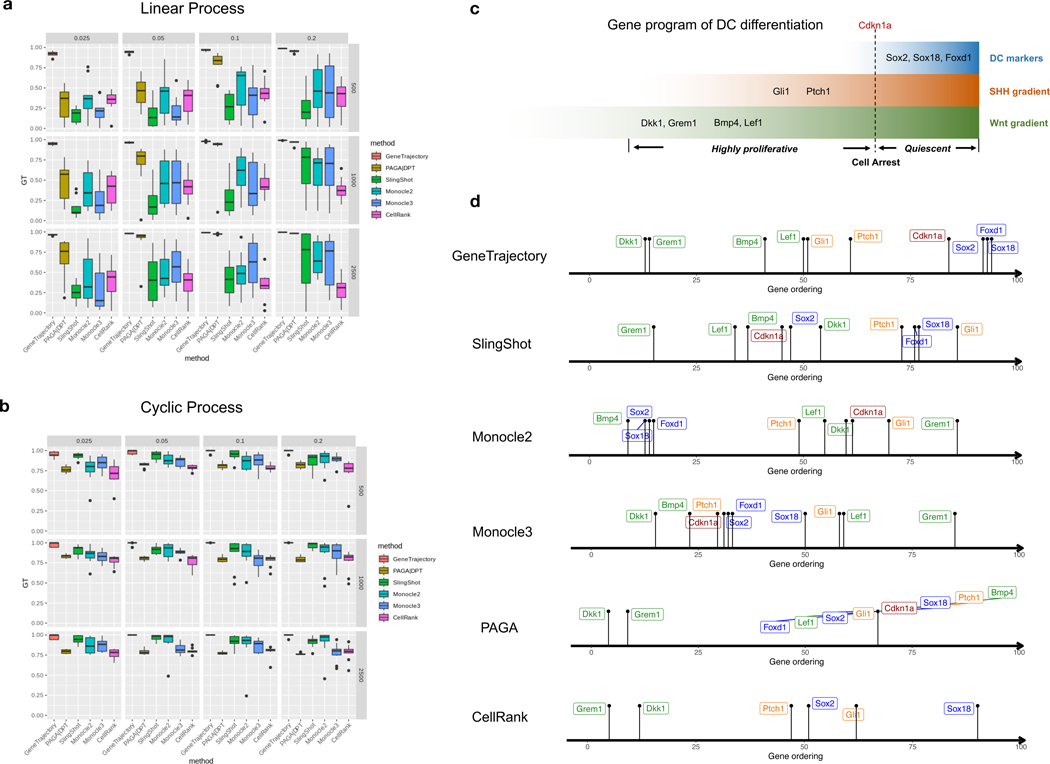
Single-cell RNA sequencing has been widely used to investigate cell state transitions and gene dynamics of biological processes. Current strategies to infer the sequential dynamics of genes in a process typically rely on constructing cell pseudotime through cell trajectory inference. However, the presence of concurrent gene processes in the same group of cells and technical noise can obscure the true progression of the processes studied. To address this challenge, we present GeneTrajectory, an approach that identifies trajectories of genes rather than trajectories of cells. Specifically, optimal transport distances are calculated between gene distributions across the cell-cell graph to extract gene programs and define their gene pseudotemporal order. Here we demonstrate that GeneTrajectory accurately extracts progressive gene dynamics in myeloid lineage maturation. Moreover, we show that GeneTrajectory deconvolves key gene programs underlying mouse skin hair follicle dermal condensate differentiation that could not be resolved by cell trajectory approaches. GeneTrajectory facilitates the discovery of gene programs that control the changes and activities of biological processes.


Conflict of interest statement

Competing interests: R.A.F. is an advisor to GlaxoSmithKline, Zai Lab and Ventus Therapeutics. F.S. is employed as a director by PCMGF Limited. I.D.O. is the founder and president of Plythera and receives research funding from Ventus Therapeutics and SenTry.

Figures

Extended Data Fig. 1:
Extended Data Fig. 1:. Simulation framework and dataset visualization.
a. Illustration of GeneTrajectory simulation framework. A simple linear differentiation process simulation is shown. Each cell is associated with a pseudotime t along the process. For each gene, its expected expression level is modeled as a bell-shaped function of t, its real expression level in a given cell is drawn from a Poisson distribution (see details in Methods). b. GeneTrajectory analysis on the simulated data in a. The first panel shows the UMAP embedding of cells; the second panel delineates the progressive dynamics of the simulated biological process with five genes selected along each process; the 3rd–7th panels show the expression of selected genes in the cell embedding following their pseudotemporal order; The 8th panel displays the UMAP embedding of genes, colored by the ground truth of gene pseudo-order. c–f. Gene-by-cell count matrices visualized by heatmaps (in log scale). Each row corresponds to a gene, each column corresponds to a cell. Each heatmap corresponds to a simulation example in Fig. 2.
Extended Data Fig. 2:
Extended Data Fig. 2:. Myeloid cell type stratification.
a. UMAPs of selected well-studied myeloid gene markers identified along gene trajectories. b. Heatmap of cell-type specific gene markers (showing for each cell type the genes with the highest fold change in the average expression between that cell type and the remaining ones). c. Dot plot of cell-type specific gene markers in b. The color here indicates the average expression level of each gene in the corresponding cell type (after scaling).
Extended Data Fig. 3:
Extended Data Fig. 3:. Dermal cell type stratification.
a. UMAPs of gene expression profiles. b. Distribution of genes associated with different cell cycle phases along the CC gene trajectory.
Extended Data Fig. 4:
Extended Data Fig. 4:. Gene dynamics comparison between the wild type and Wls mutant.
a. Gene bin plots of the LD gene trajectory, split by condition. b. Gene bin plots of the CC gene trajectory, split by condition. c. Cell UMAPs are colored by the cell states which are categorized into multiple stages, split by two conditions. d. Change of Lef1 (Wnt) level across all stages, split by condition. Lef1 level is uniformly lower in the Wls KO than in the wild type. The box represents the interquartile range (IQR), with the line inside the box indicating the median. Whiskers extend to a maximum of 1.5× IQR beyond the box, with outliers represented as individual points.
Extended Data Fig. 5:
Extended Data Fig. 5:. Gene ordering results obtained by different methods on the dermal condensate genesis data.
The orderings of key genes activated during the dermal condensate differentiation process are delineated. Cell cycle effects were regressed out when constructing the cell graph.
Fig. 1:
Fig. 1:. Overview of GeneTrajectory.
a, Illustration of two scenarios when a linear process and a cyclic process are dependent or independent with each other, resulting in cell manifolds with different intrinsic dimensions and requiring distinct pseudotime parametrizations. b, Schematic of the major workflow of GeneTrajectory. c, Construction of cell kNN graph. d, Computation of graph-based OT (Wasserstein) distances between paired gene distributions (four representative genes are shown) over the cell graph. Gene distributions are defined by their normalized expression levels over cells. e, Heatmap of OT (Wasserstein) distances for genes g1-g4 in d. f, Construction of gene graph based on gene-gene affinities (transformed from gene-gene Wasserstein distances). g, Sequential identification of gene trajectories using a diffusion-based strategy. The initial node (terminus-1) is defined by the gene with the largest distance from the origin in the diffusion map embedding. A random-walk procedure is then employed on the gene graph to select the other genes that belong to the trajectory terminated at terminus-1. After retrieving genes for the first trajectory, we identify the terminus of the subsequent gene trajectory among the remaining genes and repeat the steps above. This is done iteratively until all detectable trajectories are extracted. h, Diffusion map visualization of gene trajectories.
Fig. 2:
Fig. 2:. GeneTrajectory performance assessment based on simulation experiments.
a, Simulation of a cycling process (CC). The cell embedding and gene embedding showcase the same topology that has a ring-shaped structure. b, Simulation of a differentiation process with two lineages. The cell embedding and gene embedding showcase the same topology that has a bifurcating tree structure. c, Simulation of a linear differentiation process coupled with CC. The cell embedding and gene embedding showcase distinct topologies. Cells are organized along a cylinder-shaped manifold that has an intrinsic dimension of two. Genes that contribute to the two processes are deconvolved and organized along a ring-shaped trajectory and a linear trajectory. d, Simulation of a multi-level lineage differentiation process coupled with CC. The cell embedding and gene embedding showcase distinct topologies. Cells are organized along a coral-shaped manifold that has an intrinsic dimension of two. Genes that contribute to the two processes are deconvolved and organized along a ring-shaped trajectory and a multilayered-tree-structured trajectory. (a and b are visualized by t-SNE (t-distributed stochastic neighbor embedding); c and d are visualized by UMAP (uniform manifold approximation and projection). The first column shows the cell embedding; The second column delineates the progressive dynamics of the simulated process with five genes selected along each process; the third to seventh columns show the expression of selected genes in the cell embedding following their pseudotemporal order; the eighth column displays the embedding of genes, colored by the ground truth of gene pseudo-order)
Fig. 3:
Fig. 3:. Gene trajectory inference on a myeloid scRNA-seq dataset.
a, UMAP of myeloid cell population colored by cell types. b, DM (diffusion map) embedding of the gene graph based on gene-gene Wasserstein distances, visualized using the three leading non-trivial eigenvectors. Three prominent gene trajectories are identified. Expression profiles of the genes at the terminus of these trajectories are shown, each indicating a distinct myeloid cell state. c-e, Gene bin plots showing the gene expression activities along each gene trajectory (Trajectory 1 (c), Trajectory 2 (d) and Trajectory 3 (e)) over the cell embedding. Genes along each trajectory are ordered and then split into five equal-sized bins. Gene bin score is defined by the proportion of genes (from each bin) expressed in each cell. Arrows indicate the path of gene distribution progression over the cells.
Fig. 4:
Fig. 4:. GeneTrajectory deconvolves two mixed processes during DC genesis.
a, Experimental design of extracting skin tissue from a pair of WT and Wls KO embryos at day E14.5 for scRNA-seq. b, FISH images (scale bar = 50μm) showing the spatial distribution of Lef1, Sox2, EdU nucleotide and DAPI in the upper dermis of WT and Wls KO. EdU is a nucleotide that is incorporated by cells in the S-phase of the CC. n=8 (WT) and n=9 (KO) embryos examined over four biologically independent experiments with similar results. c, UMAP of cells color coded by cell types, conditions, and CC phases. d, DM (diffusion map) embedding of the gene graph to visualize three identified gene trajectories (two different combinations of leading non-trivial eigenvectors are displayed). e, Gene bin plots delineating the dynamics of each process (including DC differentiation, LD differentiation and CC), in which genes along each trajectory are split into seven equal-sized bins. Gene bin score is defined by the proportion of genes (from each bin) expressed in each cell. Arrows indicate the path of gene distribution progression over the cells. Upper dermis, UD; lower dermis, LD; dermal condensate, DC; cell cycle, CC; wildtype, WT; control, CTL; knockout, KO.
Fig. 5:
Fig. 5:. Gene dynamics comparative analysis.
a, Gene expression status (smoothed) along each gene trajectory in two conditions (0: expressed in fewer than 1% of cells, 1: otherwise). b, Change in G1 proportion across seven stages of DC differentiation. Error bar: mean ± s.e., n = the number of cells in each stage of the corresponding condition. Dots in stages 5–7 of the KO are omitted when the number of cells is ≤ 10. c, Lef1 transcript levels (H score) quantified by FISH in UD in two conditions. d, Percentage of Edu in UD in two conditions. EdU is a nucleotide incorporated by cells in the S-phase of CC. e, Gene bin plots of the DC gene trajectory over the WT cell embedding. Cells involved in the DC differentiation process are stratified into seven different stages. f, Gene bin plots of the DC gene trajectory over the Wls KO cell embedding. Cells involved in the DC differentiation process are stratified into seven different stages. Violin plots: n=8 (WT) and n=9 (KO) embryos examined over four biologically independent experiments. Statistical analysis was performed using two-sided student’s t-test. Lines indicate 75th, 50th and 25th percentiles.
Fig. 6:
Fig. 6:. GeneTrajectory outperforms other methods in inferring gene ordering along concurrent processes.
a-b, Comparison of GeneTrajectory with other approaches on simulated data (corresponding to the third simulation example in Fig. 2) of simultaneous linear process (a) and cyclic process (b), with varying sample size and sparsity level of the count matrix (the numbers in the vertical gray boxes correspond to sample size, and those in the horizontal gray boxes correspond to the percentage of nonzero entries in each count matrix). c, Schematic representation of the key genes activated during the DC differentiation process. d, Gene ordering results obtained by different methods on the DC genesis data. Box plots: The box represents the interquartile range (IQR), with the line inside the box indicating the median. Whiskers extend to a maximum of 1.5 × IQR beyond the box, with outliers represented as individual points.

Similar articles

Cited by

References

    1. Mahdessian D. et al. Spatiotemporal dissection of the cell cycle with single-cell proteogenomics. Nature 590, 649–654 (2021). - PubMed
    1. Scialdone A. et al. Computational assignment of cell-cycle stage from single-cell transcriptome data. Methods 85, 54–61 (2015). - PubMed
    1. Skinner SO et al. Single-cell analysis of transcription kinetics across the cell cycle. Elife 5, e12175 (2016). - PMC - PubMed
    1. Cao J, Zhou W, Steemers F, Trapnell C. & Shendure J. Sci-fate characterizes the dynamics of gene expression in single cells. Nature biotechnology 38, 980–988 (2020). - PMC - PubMed
    1. Qu R. et al. Decomposing a deterministic path to mesenchymal niche formation by two intersecting morphogen gradients. Developmental Cell 57, 1053–1067 (2022). - PMC - PubMed

Methods-only references

    1. Balasubramanian Mukund and Schwartz Eric L. The isomap algorithm and topological stability. Science, 295(5552):7–7, 2002. - PubMed
    1. Bernstein Mira, De Silva Vin, Langford John C, and Tenenbaum Joshua B. Graph approximations to geodesics on embedded manifolds. Technical report, Department of Psychology, Stanford University, 2000.
    1. Dassule Hèlène R, Lewis Paula, Bei Marianna, Maas Richard, and McMahon Andrew P. Sonic hedgehog regulates growth and morphogenesis of the tooth. Development, 127(22):4775–4785, 2000. - PubMed
    1. Carpenter April C, Rao Sujata, Wells James M, Campbell Kenneth, and Lang Richard A. Generation of mice with a conditional null allele for wntless. genesis, 48(9):554–558, 2010. - PMC - PubMed
    1. Satija Rahul, Farrell Jeffrey A, Gennert David, Schier Alexander F, and Regev Aviv. Spatial reconstruction of single-cell gene expression data. Nature biotechnology, 33(5):495–502, 2015. - PMC - PubMed

LinkOut - more resources