. 2024 Jun;20(6):719-740.
doi: 10.1038/s44320-024-00032-x. Epub 2024 Apr 5.

Genome-wide CRISPR screens identify novel regulators of wild-type and mutant p53 stability

Affiliations

Genome-wide CRISPR screens identify novel regulators of wild-type and mutant p53 stability

YiQing Lü et al. Mol Syst Biol. 2024 Jun.

Abstract

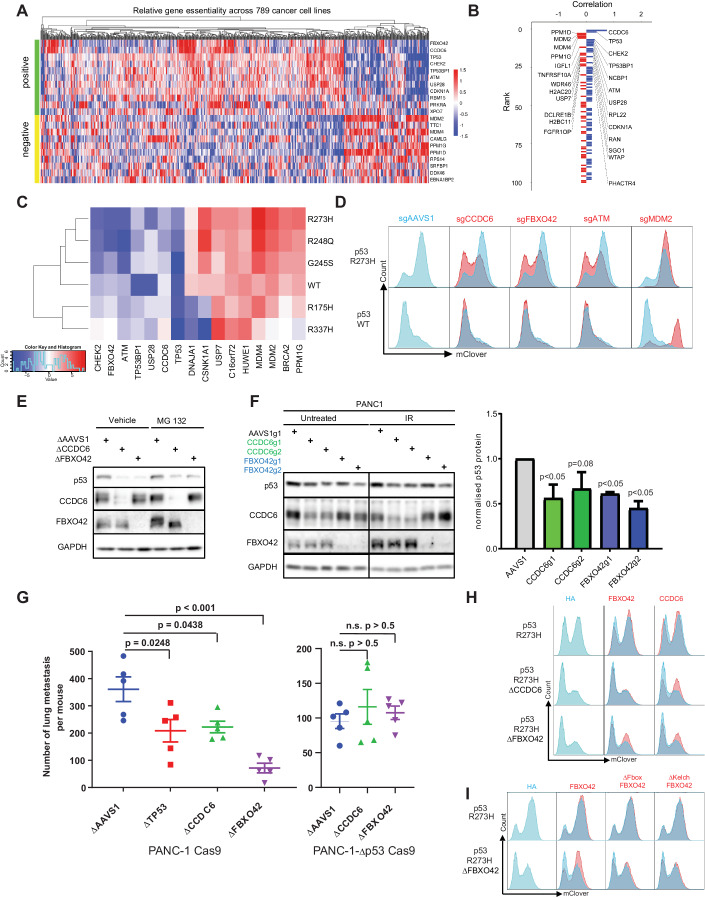
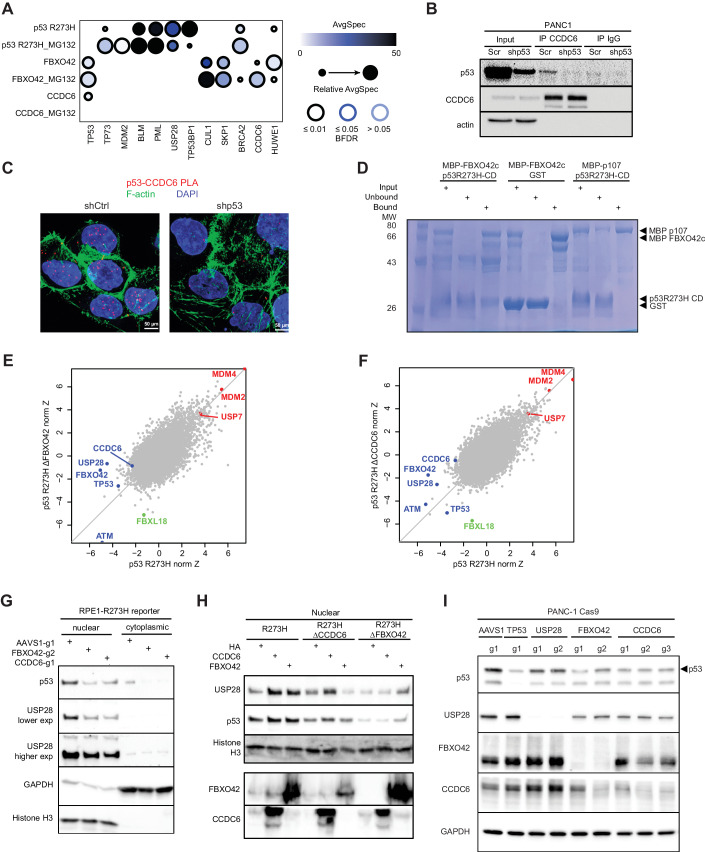
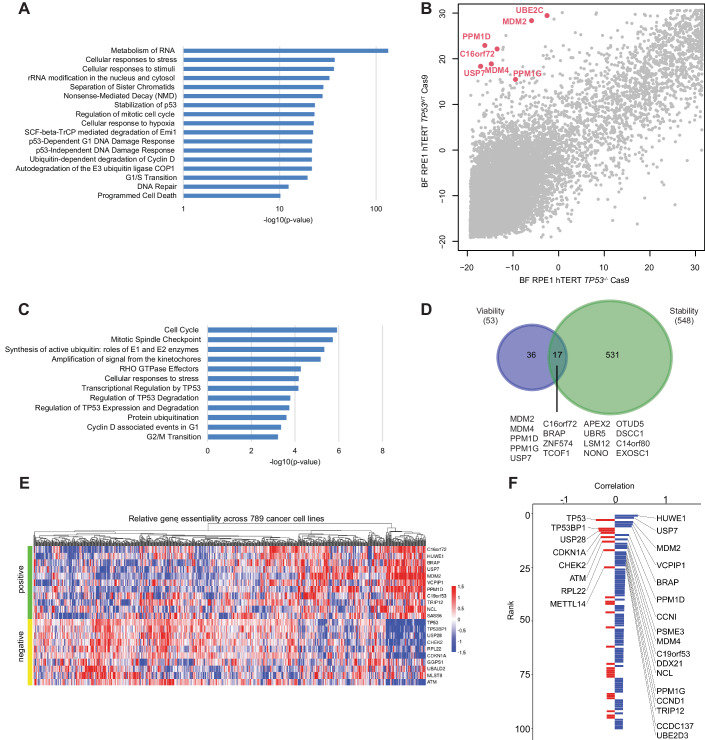
Tumor suppressor p53 (TP53) is frequently mutated in cancer, often resulting not only in loss of its tumor-suppressive function but also acquisition of dominant-negative and even oncogenic gain-of-function traits. While wild-type p53 levels are tightly regulated, mutants are typically stabilized in tumors, which is crucial for their oncogenic properties. Here, we systematically profiled the factors that regulate protein stability of wild-type and mutant p53 using marker-based genome-wide CRISPR screens. Most regulators of wild-type p53 also regulate p53 mutants, except for p53 R337H regulators, which are largely private to this mutant. Mechanistically, FBXO42 emerged as a positive regulator for a subset of p53 mutants, working with CCDC6 to control USP28-mediated mutant p53 stabilization. Additionally, C16orf72/HAPSTR1 negatively regulates both wild-type p53 and all tested mutants. C16orf72/HAPSTR1 is commonly amplified in breast cancer, and its overexpression reduces p53 levels in mouse mammary epithelium leading to accelerated breast cancer. This study offers a network perspective on p53 stability regulation, potentially guiding strategies to reinforce wild-type p53 or target mutant p53 in cancer.

Keywords: Breast Cancer; Fluorescence-based Stability Reporter; Genome-wide CRISPR Screening; Mutant p53; p53 Stability.


Conflict of interest statement

The authors declare no competing interests. ACG is an editorial advisory board member. This has no bearing on the editorial consideration of this article for publication.

Figures

Figure 1
Figure 1. CRISPR screen for regulators of wild-type and mutant p53 stability.
(A) Reporter design. Schematic of the fluorescence reporter based on a bicistronic p53-mClover stability sensor followed by a co-translational self-cleaving P2A peptide and mRFP that serves as an internal control. Any perturbation that specifically affects p53 stability would result in an altered mClover/RFP ratio (#2 horizontal axis), while any perturbation that results in overall increased transcription or general differences of proteostasis would affect RFP as well as p53-mClover (#1 diagonal axis). (B) Flow cytometry blots depicting the level of wild-type and mutant p53 protein reporters upon Nutlin-3a (10 μM, 24 h) treatment to inhibit the interaction between MDM2 and p53 and upon Nutlin-3a withdrawal (24 h). Results are reproducible over biological triplicates. (C) Flow cytometry blots depicting the levels of wild-type and p53 R273H protein reporters upon CRISPR/Cas9-mediated MDM2 depletion (top), or upon subsequent MDM2 overexpression (bottom), measured 7 days post-transduction. Results are reproducible over biological triplicates. (D) Schematic of the screening setup and analysis. Each clonal reporter line was transduced with a lentiviral genome-wide CRISPR knockout library (TKOv3). Infected populations were drug-selected and sorted by Fluorescence-Activated Cell Sorting (FACS) into mClover-low and mClover-high pools. sgRNA barcodes were amplified and their abundance in each pool was determined by next-generation sequencing. (E, F) Screen results for wild-type and p53 R273H protein reporters. Volcano plots displaying the perturbation effects (log 2-fold change, LFC) of each gene based on two replicates per screen. To compare among different screens (G, H), the perturbation effects of each gene were further normalized as normZ scores, considering both the LFC and false discovery rate (FDR) values. Hits were defined as having |normZ| ≥ 3. On the volcano plots, hits satisfying both FDR < 0.5, and LFC ≥ 1 (red) or LFC ≤ −0.8 (blue), are labeled in red for genes whose losses lead to increased p53 levels and blue for genes whose losses decreased p53. Screens were performed in two technical replicates. (G) Unsupervised hierarchy clustering of the wild-type and five screened p53 mutants, using the normalized screening results (normZ) of all 18053 genes. (H) UpSet plot displaying the relationships of hits shared amongst each mutant screened. The loss-of-function of an “up” (red) or “down” (blue) hit would result in the p53 mutant to destabilize or stabilize, respectively. Each column on the plot denotes a set of WT and/or p53 mutants, and the histogram above indicates the number of genes in this intersecting set; the filled-in cells denote which p53 (WT or mutants) is a part of this intersection. Source data are available online for this figure.
Figure 2
Figure 2. FBXO42-CCDC6 axis regulates mutant p53 protein stability.
(A) Heatmap of the essentiality scores of top correlated (positive) and anti-correlated (negative) genes with FBXO42 across 789 cancer cell lines screened in DepMap (depmap.org, generated using FIREWORK (Amici et al, 2020). (B) The 50 top genes correlated (blue) and anti-correlated (red) with FBXO42, based on coessentiality results from CRISPR screens in 789 cancer cell lines (depmap.org). (C) Heatmap displaying the screening results (as normZ scores) of selected hits across wild-type and five p53 mutants. A positive normZ (red) indicates that genetic ablation of a gene leads to increased p53 protein stability, and negative normZ (blue) indicates decreased p53 stability. (D) Flow cytometry blots depicting wild-type and R273H p53-mClover levels upon CRISPR/Cas9-mediated depletion of indicated genes. Independent sgRNAs different from the sgRNAs in the screening library were used (red) and the effects were compared against control guides targeting the AAVS1 safe harbor (blue). Results are reproducible over biological triplicates. (E) Representative Western Blot showing p53R273H-mClover protein levels in clonal RPE1 p53 R273H reporter cell line upon clonal depletion of CCDC6 or FBXO42, and upon proteasomal inhibition (10 µM MG132 for 12 h). GAPDH serves as a loading control. Results are reproducible over biological triplicates. (F) Representative Western Blot showing endogenous p53 R273H protein levels in PANC-1 cells upon depletion of CCDC6 and FBXO42, and upon genotoxic stress (IR 0.5 Gy, 24 h). GAPDH serves as a loading control. The bar graph depicts the quantification of p53 levels over three independent biological replicates (*p < 0.05, two-tailed t-test). Error bar = standard error of the mean (S.E.M.). Results are reproducible over biological triplicates. (G) Quantification of the metastatic lung colonization. The number of lung foci for each mouse injected with PANC1-Cas9 cells with the indicated genotype was plotted (n = 5 mice for each condition, with a mix of males and females housed in different cages). Mantel-Cox (log-ranked) test was used for statistical analysis. Error bar = S.E.M. (H) Flow cytometry blots depicting the p53R273H-mClover levels upon depletion of CCDC6 or FBXO42, and upon ectopic re-expression of CCDC6 or FBXO42. Results are reproducible over biological triplicates. (I) Flow cytometry blots depicting p53R273H-mClover levels upon depletion of FBXO42 and ectopic re-expression of ΔFbox FBXO42 (lacking aa 44–93) or ΔKelch FBXO42 (lacking aa 132–432). Results are reproducible over biological triplicates. Source data are available online for this figure.
Figure 3
Figure 3. Mapping the genetic interaction network of FBXO42-CCDC6 and mutant p53.
(A) Selected proximity interactors of p53 R273H, CCDC6, and FBXO42 as mapped by BioID using HEK293-Flp-In T-REx cell lines stably expressing each bait, with or without the proteasomal inhibitor MG 132 [5 μM, 24 h]. The intensity of the shade filling depicts the spectral count of each prey, the relative abundance of this prey compared across all baits is indicated by the circle size, and the confidence (Bayesian false discovery rate, BFDR) is by the intensity of the edge. (B) Interaction of p53 R273H and CCDC6 in PANC-1 cells validated using immunoprecipitation (IP). Lysates of PANC-1 cells with or without depletion of the endogenous p53 R273H protein were immunoprecipitated using an CCDC6-specific antibody or an IgG-isotype control, followed by Western blot analysis of the endogenous p53. β-actin serves as a loading control for lysate input. Results are reproducible over biological triplicates. (C) Proximity ligation assay (PLA) between endogenous CCDC6 and endogenous p53 R273H in PANC-1 cells using tetramethylrhodamine-5-isothiocyanate (TRITC) as a probe (red) and counterstained with DAPI (blue) and phalloidin-FITC (green) to visualize nuclear DNA and F-actin, respectively. RNAi-mediated depletion of the endogenous p53 R273H protein was used as a control to show specificity. Results are reproducible over biological triplicates. (D) In vitro evidence for a direct and specific interaction between the p53-R273H core domain (p53CD-R273H) and FBXO42c. The MBP-tagged Kelch domain of FBXO42 (MBP-FBXO42c, aa 105–360) and the core DNA-binding domain of p53 R273H (p53-CD-R273H, aa 90–311) were recombinantly expressed and purified from the Bl21DE3 E. coli strain. MBP-FBXO42c was pre-coupled to amylose resin. Following incubation of MBP-FBXO42c and p53-CD-R273H, amylose-resin coupled MBP-FBXO42c captured a fraction of p53-CD-R273H, which was found partly in the bound fraction. As a first specificity control, Amylose-coupled MBP-FBXO42c was unable to capture the unrelated protein GST in the bound fraction. A second specificity control was performed to show that p53-CD-R273H did not bind to the unrelated protein MBP-p107. In this control, no p53-CD-R273H was found in the bound fraction. The input, unbound, and bound fractions were resolved on SDS-PAGE and stained with Coomassie blue. Results are reproducible over biological triplicates. (E, F) Scatter plots of the perturbation effect of each gene as normalized Z-score (normZ), in the p53 R273H reporters before and after the loss of CCDC6 or FBXO42. Selected genes whose depletion resulted in p53 stabilization and destabilization are marked in red and green, respectively. Screens were performed in technical duplicates. (G, H) Representative Western blot results showing levels of USP28 and p53 in nuclear and cytoplasmic fractions of the p53 R273H reporter cell line with clonal depletion of FBXO42 or CCDC6, and upon the ectopic re-expression of CCDC6 or FBXO42. Histone H3 and GAPDH served as nuclear and cytoplasmic markers, respectively. Levels of CCDC6 and FBXO42 were measured from the total cell lysates (H). Results are reproducible over biological triplicates. (I) Total cellular USP28 and p53 levels in PANC-1 cells upon depletions of CCDC6, FBXO42, or USP28. Cell lines harboring AAVS1-g1, TP53-g1, FBXO42-g1, and CCDC6-g1 were further used in metastatic lung colonization experiment via tail vein injections (Fig. 2G; Appendix Fig. 4A). Results are reproducible over biological triplicates. Source data are available online for this figure.
Figure 4
Figure 4. Synthetic viability screen maps regulators of p53.
(A) Pathway analysis based on the top scoring genes from the protein stability reporter screens that resulted in increased wild-type or mutant p53 levels using Reactome pathway analysis. Selected Reactome pathways are shown. Fisher’s exact test based on the hypergeometric distribution was used for pathway enrichment analysis. (B) Synthetic viability screen in RPE1 cells. Bayesian Factors (BF) as a measurement of essentiality (high values indicate a lethal gene) are shown for all protein-coding genes in p53 wild-type (y-axis) versus p53 null (x-axis) background. All BFs were computed using the BAGEL2 algorithm (Kim and Hart, 2021). Screens were performed in technical triplicates. (C) Pathway analysis based on the top-scoring genes in the synthetic viability screen using Reactome pathway analysis. Selected Reactome pathways are shown. Fisher’s exact test based on the hypergeometric distribution was used for pathway enrichment analysis. (D) Venn diagram depicting the top scoring genes from the synthetic viability screen and the top scoring genes from the p53 stability screens whose mutation leads to increased p53 levels. The common genes from both screens are depicted. (E) Heatmap of the essentiality scores of top correlated (positive) and anti-correlated (negative) genes with C16orf72/HAPSTR1 across 789 cancer cell lines screened in DepMap (depmap.org, generated using FIREWORK (Amici et al, 2020). (F) The 50 top genes correlated (blue) and anti-correlated (red) with C16orf72/HAPSTR1, based on coessentiality results from CRISPR screens in 789 cancer cell lines (depmap.org). Source data are available online for this figure.
Figure 5
Figure 5. C16orf72/HAPSTR1 is a regulator of wild-type and mutant p53 stability.
(A) Clonogenic survival assays validating the synthetic viability between C16orf72/HAPSTR1 and p53. Assayed 13 days after plating, the surviving fractions of RPE1-hTERT-TP53+/+ or TP53−/− cells transduced with the indicated sgRNAs were normalized to those depleted with the non-targeting control guide. The two-tailed unpaired t-test was used for statistical analysis. Error bar = standard error of the mean (S.E.M.), n = 3, **p < 0.01, ***p < 0.001. Results are reproducible over biological triplicates. (B) Representative Western Blot results showing p53 and p21 protein levels in RPE1 cells transduced with the indicated sgRNAs. GAPDH serves as a loading control. Results are reproducible over biological triplicates. (C) Flow cytometry blots depicting the level of wild-type or p53R273H-mClover protein levels upon depletion of C16orf72/HAPSTR1. Results are reproducible over biological triplicates. (D) Interactors of C16orf72/HAPSTR1 as mapped by AP-MS in HEK293-Flp-In T-REx and U2OS-Flp-In T-REx cells stably expressing FLAG-tagged C16orf72/HAPSTR1. Mass spectrometry was performed in biological triplicates. (E) Representative Western Blot results showing p53 protein levels in parental RPE1 cells in response to depletions of C16orf72/HAPSTR1 and other known E3 ligases of p53 (MDM2, USP7, and HUWE1) using siRNAs. Results are reproducible over biological triplicates. (F) Flow cytometry blots depicting the level of p53R273H-mClover protein levels in a clonal p53R273H reporter RPE1 cell line depleted of C16orf72 and transduced with either full-length C16orf72 or a C16orf72 truncation mutant lacking the NLS or a control overexpression construct (HA). Results are reproducible over biological triplicates. (G) Flow cytometry blots depicting the level of p53R273H-mClover protein levels in a clonal p53R273H reporter RPE1 cell line depleted of C16orf72 and transduced with either full-length C16orf72 or a control overexpression construct (HA) with concomitant loss of either HUWE1 by transient siRNA knockdown (siHUWE1) or the corresponding non-targeting control (siNT) control. Results are reproducible over biological triplicates. (H) Co-immunoprecipitation (co-IP) showing an interaction of C16orf72/HAPSTR1 and USP7. HEK 293 cells stably transduced with an inducible FLAG-USP7 or FLAG-empty vector control vector were transfected with either an HA-tagged C16orf72/HAPSTR1 or an HA-empty control vector. Lysates with or without doxycycline-induction were co-immunoprecipitated using a FLAG-specific antibody, followed by Western Blot analysis of HA. GAPDH serves as a loading control for the lysate input. Results are reproducible over biological triplicates. Source data are available online for this figure.
Figure 6
Figure 6. C16orf72/HAPSTR1 functions as an oncogene and regulates p53 stability in the mammary gland.
(A) cBioPortal OncoPrint displaying a trend toward mutual exclusivity between genetic ablation of TP53 and C16orf72/HAPSTR1 amplification, and co-amplification between USP7 and C16orf72/HAPSTR1, among breast cancer patients. (B) In vivo cell competition assay in the mouse mammary glands. LSL-Cas9-EGFP (Trp53+/+) or the LSL-Cas9-EGFP; Trp53flox/flox (Trp53−/−) mice were intraductally injected with a mixture of control lentiviral particles expressing Cre and BFP as well as an sgRNA targeting the Tigre safe harbor, and experimental lentiviral particles expressing Cre and RFP as well as an sgRNA targeting Tigre, C16orf72/HAPSTR1, or Mdm2. The number of surviving cells that had been depleted of each gene was counted 12 days post injection and normalized to the number of cells depleted of Tigre in the same gland. This ratio was further normalized to the ratio of sgTigre:sgTigre in the LSL-Cas9-EGFP; Trp53flox/flox mouse. Two two-tailed unpaired t-test was used for statistical analysis. Error bar = standard error of the mean (S.E.M.), n = 3 glands, *p < 0.05. (C) Flow cytometry plot depicting the p53R273H-mClover levels in RPE1 reporter cells upon overexpression of C16orf72/HAPSTR1. Results are reproducible over biological triplicates. (D) Western blot analysis of wild-type p53 levels in human MCF10A mammary epithelial cells overexpressing C16orf72/HAPSTR1, assayed after treatment with Doxorubicin [2 μg/mL] for 6 h. Results are reproducible over biological triplicates. (E) Kaplan-Meier plots depicting the tumor-free survivals of tumor-prone LSL-Pi3kH1047R mice (left) and LSL-Pi3kH1047R; Trp53flox/flox mice (right) that were intraductally injected with lentiviral particles expressing Cre as well as C16orf72/HAPSTR1, USP7, Mdm2, or control (mRuby) (n = 5 for each condition; n.s. p > 0.25, log-rank test was used for statistical analysis). (F) Immunohistochemistry staining of p53 and GFP in mouse mammary hyperplasia and tumor from mice LSL-Pi3kH1047R; LSL-EGFP intraductally injected with lentiviral particles expressing Cre as well as C16orf72/HAPSTR1 or control. Stage-matched lesions from LV-C16orf72/HAPSTR1-Cre or LV-Ruby-Cre transduced LSL-Pi3kH1047R glands were stained for p53 and GFP in consecutive sections and counterstained by Hematoxylin. GFP serves as a lineage tracer to identify transduced cells. Scale bar = 100 μm. Source data are available online for this figure.

References

    1. Adams JR, Xu K, Liu JC, Agamez NM, Loch AJ, Wong RG, Wang W, Wright KL, Lane TF, Zacksenhaus E, et al. Cooperation between Pik3ca and p53 mutations in mouse mammary tumor formation. Cancer Res. 2011;71:2706–2717. - PubMed
    1. Alexandrova EM, Yallowitz AR, Li D, Xu S, Schulz R, Proia DA, Lozano G, Dobbelstein M, Moll UM. Improving survival by exploiting tumour dependence on stabilized mutant p53 for treatment. Nature. 2015;523:352–356. - PMC - PubMed
    1. Amici DR, Ansel DJ, Metz KA, Smith RS, Phoumyvong CM, Gayatri S, Chamera T, Edwards SL, O’Hara BP, Srivastava S, Brockway S, Takagishi SR, Cho BK, Goo YA, Kelleher NL, Ben-Sahra I, Foltz DR, Li J, Mendillo ML (2022) C16orf72/HAPSTR1 is a molecular rheostat in an integrated network of stress response pathways. Proc Natl Acad Sci USA 119(27):e2111262119 - PMC - PubMed
    1. Amici DR, Jackson JM, Truica MI, Smith RS, Abdulkadir SA, Mendillo ML (2020) FIREWORKS: a bottom-up approach to integrative coessentiality network analysis. Life Sci Alliance 4(2):e202000882 - PMC - PubMed
    1. Benslimane Y, Sanchez-Osuna M, Coulombe-Huntington J, Bertomeu T, Henry D, Huard C, Bonneil E, Thibault P, Tyers M, Harrington L. A novel p53 regulator, C16ORF72/TAPR1, buffers against telomerase inhibition. Aging Cell. 2021;20:e13331. - PMC - PubMed

Substances