The relationship between serum astroglial and neuronal markers and AQP4 and MOG autoantibodies
- PMID: 38580905
- PMCID: PMC10998414
- DOI: 10.1186/s12014-024-09466-9
The relationship between serum astroglial and neuronal markers and AQP4 and MOG autoantibodies
Abstract
Background: Certain demyelinating disorders, such as neuromyelitis optica spectrum disorder (NMOSD) and myelin oligodendrocyte glycoprotein antibody-associated disease (MOGAD) exhibit serum autoantibodies against aquaporin-4 (αAQP4) and myelin oligodendrocyte glycoprotein (αMOG). The variability of the autoantibody presentation warrants further research into subtyping each case.
Methods: To elucidate the relationship between astroglial and neuronal protein concentrations in the peripheral circulation with occurrence of these autoantibodies, 86 serum samples were analyzed using immunoassays. The protein concentration of glial fibrillary acidic protein (GFAP), neurofilament light chain (NFL) and tau protein was measured in 3 groups of subcategories of suspected NMOSD: αAQP4 positive (n = 20), αMOG positive (n = 32) and αMOG/αAQP4 seronegative (n = 34). Kruskal-Wallis analysis, univariate predictor analysis, and multivariate logistic regression with ROC curves were performed.
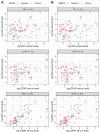
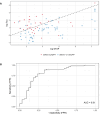
Results: GFAP and NFL concentrations were significantly elevated in the αAQP4 positive group (p = 0.003; p = 0.042, respectively), and tau was elevated in the αMOG/αAQP4 seronegative group (p < 0.001). A logistic regression model to classify serostatus was able to separate αAQP4 seropositivity using GFAP + tau, and αMOG seropositivity using tau. The areas under the ROC curves (AUCs) were 0.77 and 0.72, respectively. Finally, a combined seropositivity versus negative status logistic regression model was generated, with AUC = 0.80.
Conclusion: The 3 markers can univariately and multivariately classify with moderate accuracy the samples with seropositivity and seronegativity for αAQP4 and αMOG.
Keywords: Aquaporin 4; Autoantibody; Autoimmunity; Glial fibrillary acidic protein; Myelin oligodendrocyte glycoprotein; Neurofilament-light; Tau.
© 2024. The Author(s).
Conflict of interest statement
CD, RC, TG, MW, MS, AM, and GS are employees and JW is an officer of Meso Scale Diagnostics, LLC. Otherwise, the authors did not identify any potential, perceived or real conflicts of interest to disclose.
Figures


Update of
-
The relationship between serum astroglial and neuronal markers and AQP4 and MOG autoantibodies.Res Sq [Preprint]. 2023 Nov 29:rs.3.rs-3659922. doi: 10.21203/rs.3.rs-3659922/v1. Res Sq. 2023. Update in: Clin Proteomics. 2024 Apr 5;21(1):28. doi: 10.1186/s12014-024-09466-9. PMID: 38077014 Free PMC article. Updated. Preprint.
Similar articles
-
The relationship between serum astroglial and neuronal markers and AQP4 and MOG autoantibodies.Res Sq [Preprint]. 2023 Nov 29:rs.3.rs-3659922. doi: 10.21203/rs.3.rs-3659922/v1. Res Sq. 2023. Update in: Clin Proteomics. 2024 Apr 5;21(1):28. doi: 10.1186/s12014-024-09466-9. PMID: 38077014 Free PMC article. Updated. Preprint.
-
Serum Biomarker Profiles Discriminate AQP4 Seropositive and Double Seronegative Neuromyelitis Optica Spectrum Disorder.Neurol Neuroimmunol Neuroinflamm. 2024 Jan;11(1):e200188. doi: 10.1212/NXI.0000000000200188. Epub 2023 Dec 22. Neurol Neuroimmunol Neuroinflamm. 2024. PMID: 38134369 Free PMC article.
-
Serum Neurofilament Light and GFAP Are Associated With Disease Severity in Inflammatory Disorders With Aquaporin-4 or Myelin Oligodendrocyte Glycoprotein Antibodies.Front Immunol. 2021 Mar 16;12:647618. doi: 10.3389/fimmu.2021.647618. eCollection 2021. Front Immunol. 2021. PMID: 33796113 Free PMC article.
-
Glial fibrillary acidic protein as a biomarker in neuromyelitis optica spectrum disorder: a current review.Expert Rev Clin Immunol. 2023 Jan;19(1):71-91. doi: 10.1080/1744666X.2023.2148657. Epub 2022 Nov 30. Expert Rev Clin Immunol. 2023. PMID: 36378751 Review.
-
Neuromyelitis optica spectrum disorders: Features of aquaporin-4, myelin oligodendrocyte glycoprotein and double-seronegative-mediated subtypes.Rev Neurol (Paris). 2018 Jun;174(6):458-470. doi: 10.1016/j.neurol.2018.02.084. Rev Neurol (Paris). 2018. PMID: 29685427 Review.
References
-
- Jarius S, Ruprecht K, Kleiter I, Borisow N, Asgari N, Pitarokoili K, et al. MOG-IgG in NMO and related disorders: a multicenter study of 50 patients. Part 1: frequency, syndrome specificity, influence of disease activity, long-term course, association with AQP4-IgG, and origin. J Neuroinflammation. 2016;13:279. doi: 10.1186/s12974-016-0717-1. - DOI - PMC - PubMed
Grants and funding
LinkOut - more resources
Full Text Sources
Miscellaneous
