. 2024 Apr 1;326(4):C1248-C1261.
doi: 10.1152/ajpcell.00726.2023. Epub 2024 Mar 4.

Distinct subpopulations of human subcutaneous adipose tissue precursor cells revealed by single-cell RNA sequencing

Affiliations

Distinct subpopulations of human subcutaneous adipose tissue precursor cells revealed by single-cell RNA sequencing

Adeline Divoux et al. Am J Physiol Cell Physiol. .

Abstract

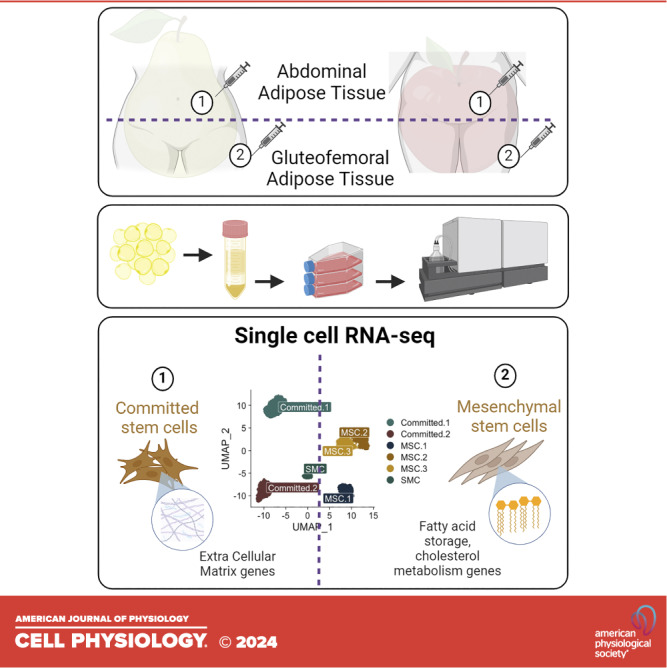
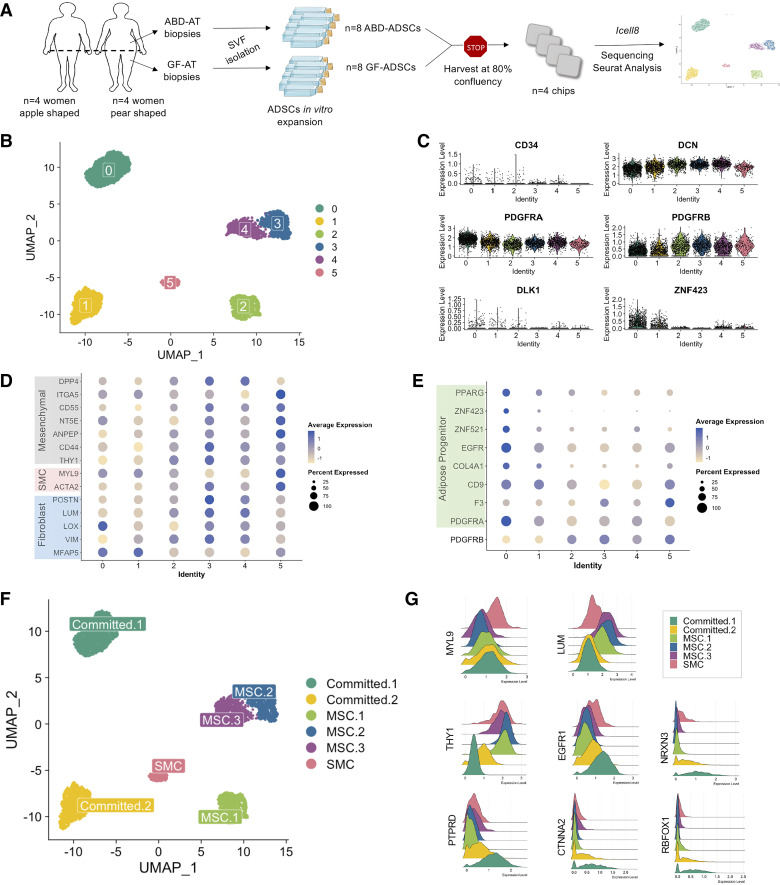
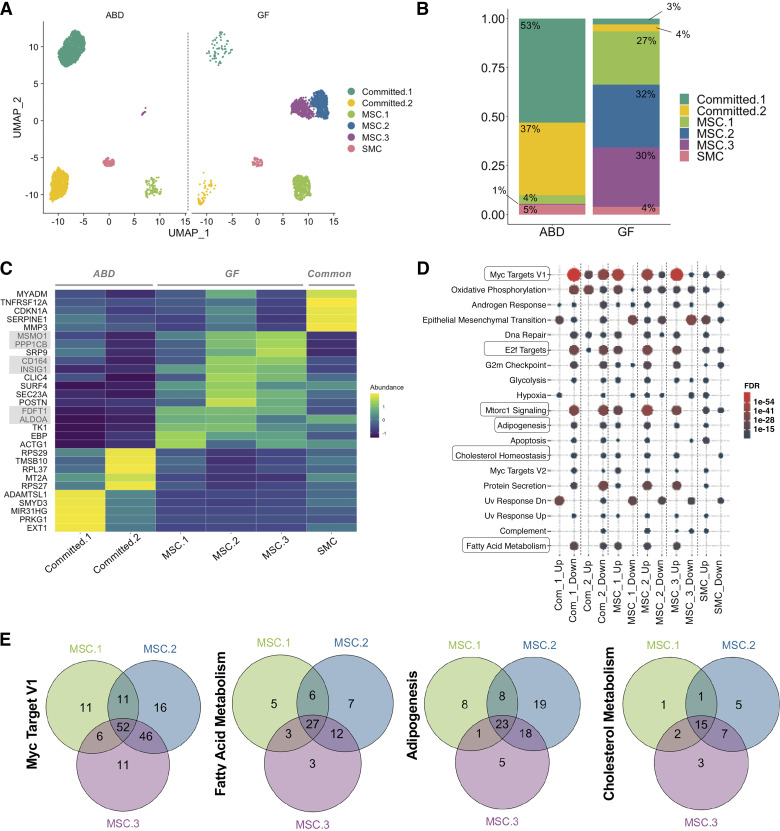
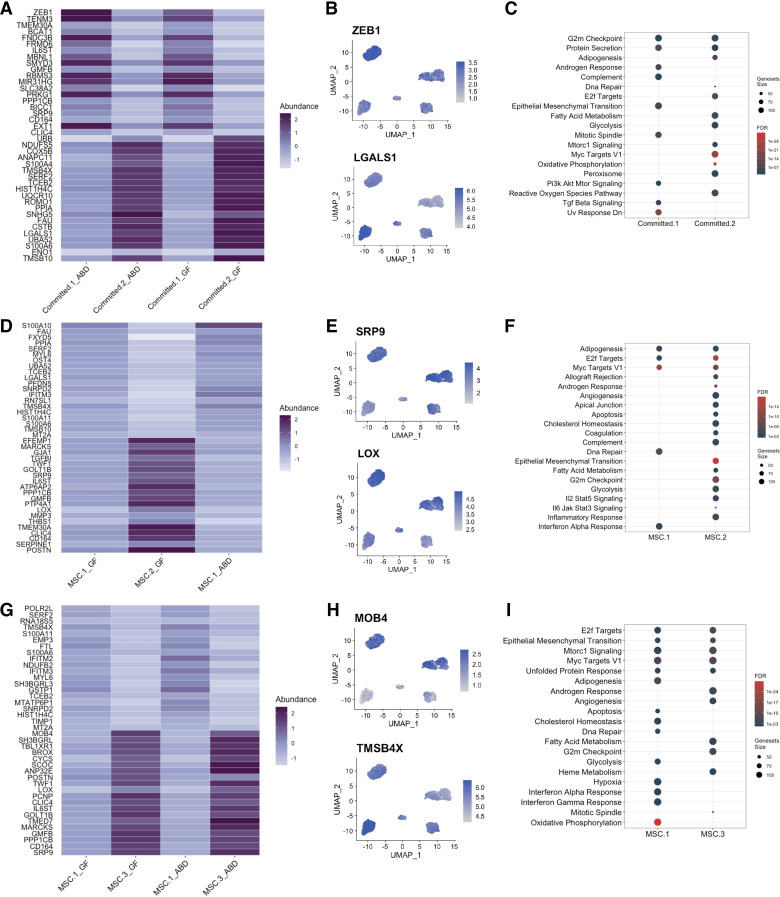
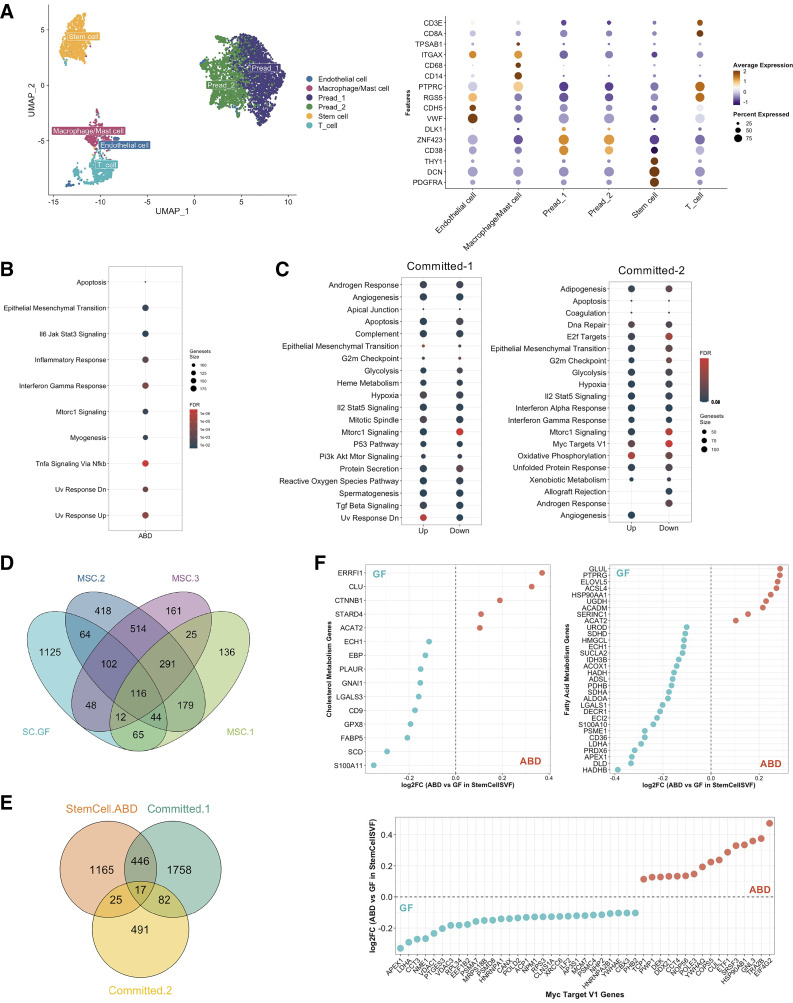
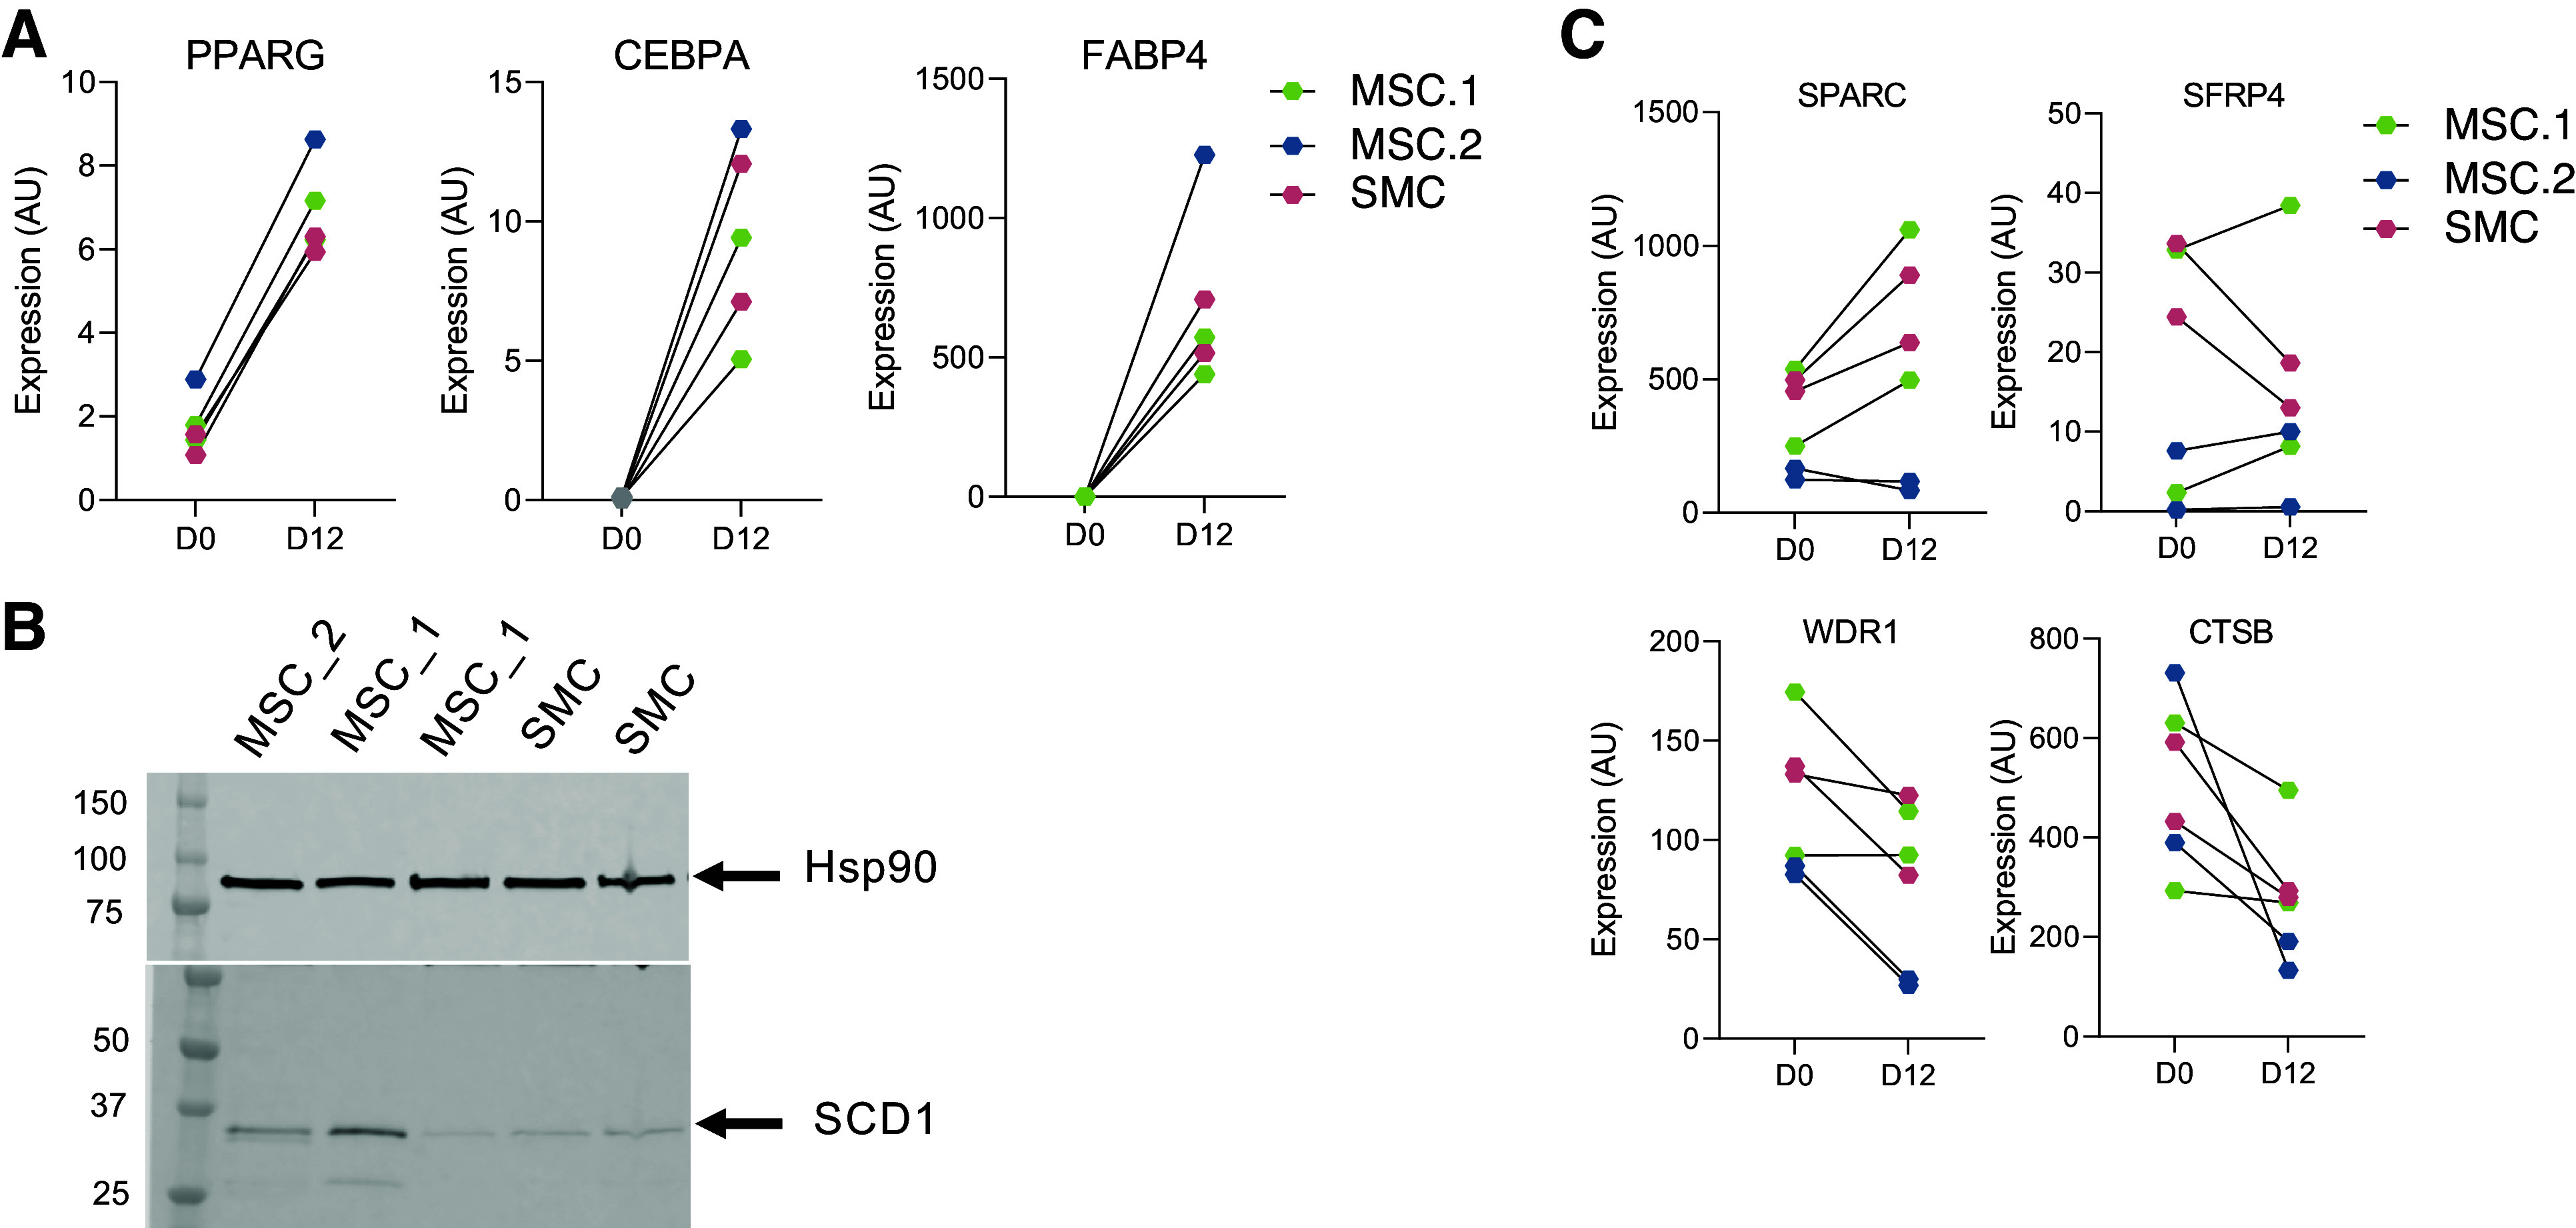
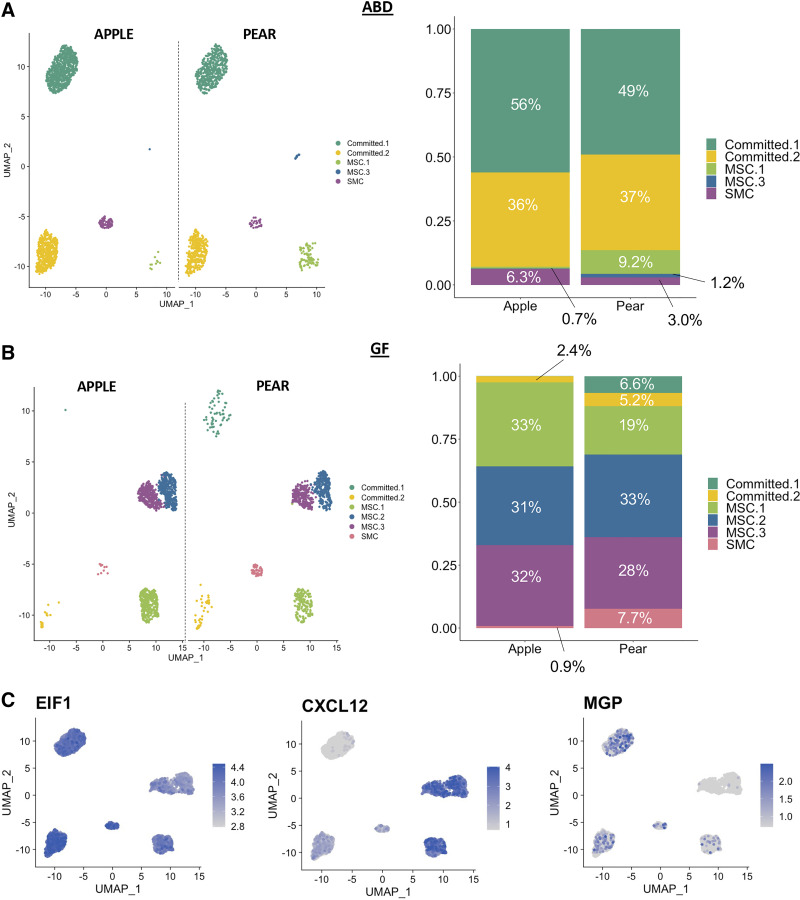
Adipose-derived stem cells (ADSCs) play an important role in the differential capacity for excess energy storage between upper body abdominal (ABD) adipose tissue (AT) and lower body gluteofemoral (GF) AT. We cultured ADSCs from subcutaneous ABD AT and GF AT isolated from eight women with differential body fat distribution and performed single-cell RNA sequencing. Six populations of ADSCs were identified and segregated according to their anatomical origin. The three ADSC subpopulations in GF AT were characterized by strong cholesterol/fatty acid (FA) storage and proliferation signatures. The two ABD subpopulations, differentiated by higher expression of committed preadipocyte marker genes, were set apart by differential expression of extracellular matrix and ribosomal genes. The last population, identified in both depots, was similar to smooth muscle cells and when individually isolated and cultured in vitro they differentiated less than the other subpopulations. This work provides important insight into the use of ADSC as an in vitro model of adipogenesis and suggests that specific subpopulations of GF-ADSCs contribute to the more robust capacity for GF-AT to expand and grow compared with ABD-AT in women.NEW & NOTEWORTHY Identification of distinct subpopulations of adipose-derived stem cells (ADSCs) in upper body abdominal subcutaneous (ABD) and lower body gluteofemoral subcutaneous (GF) adipose tissue depots. In ABD-ADSCs, subpopulations are more committed to adipocyte lineage. GF-ADSC subpopulations are enriched for genes involved in lipids and cholesterol metabolism. Similar depot differences were found in stem cell population identified in freshly isolated stoma vascular fraction. The repertoire of ADSCs subpopulations was different in apple-shaped versus pear-shaped women.

Keywords: abdominal adipose tissue; adipose-derived stem cells; cell identity; gluteofemoral adipose tissue; scRNA-seq.


Conflict of interest statement

No conflicts of interest, financial or otherwise, are declared by the authors.

Figures

None
Graphical abstract
Figure 1.
Figure 1.
A single-cell atlas of human culture adipose-derived stem cells (ADSCs) isolated from abdominal (ABD) and gluteofemoral (GF) adipose tissue (AT). Schematic of workflows used in the study of ADSCs isolated from abdominal (ABD) and gluteofemoral (GF) adipose tissue (AT), created with the material from Servier Medical Art https://creativecommons.org/licenses/by/4.0/ (A). UMAP showing six clusters from 4,182 ADSCs (B). Violin plots showing stem cells and committed preadipocyte marker genes in the 6 clusters (C). Dot-plot showing fibroblast, smooth muscle cell (SMC) and mesenchymal stem cell (MSC) marker genes expression in the 6 clusters (D). Dot-plot showing committed preadipocyte marker genes in the six clusters (E). UMAP showing the six clusters named (F). Ridge plot showing expression of marker genes used to label the 6 clusters (G). SVF, stroma vascular fraction.
Figure 2.
Figure 2.
Depot-specific adipose-derived stem cell (ADSC) subpopulations. UMAPs and stacked bar-plots showing the repartition of the ADSCs subpopulations according to the adipose tissue depot [abdominal (ABD) vs. gluteofemoral (GF)] (A and B). Heatmap representation of the top five most upregulated genes (higher fold change) in each cluster of cells (C). Dotplot showing the significant pathways that are upregulated in each cluster; selected pathways with FDR < 0.05 are represented (D). Venn diagrams showing the common and unique genes differentially expressed in mesenchymal stem cell (MSC)-1, MSC-2, and MSC-3 and belonging to “Myc Target V1,” Fatty acid metabolism,” “Adipogenesis,” and cholesterol metabolism” pathways (E). SMC, smooth muscle cell.
Figure 3.
Figure 3.
Unique transcriptome of depot specific adipose-derived stem cell (ADSC) subpopulations. Heatmap representation of the top 20 differentially expressed genes between Committed-1 and Committed-2 subpopulations in abdominal (ABD) and gluteofemoral (GF) depots (A). Feature plot showing expression of ZEB1 and LGALS1 genes (B). Dot-plot showing the significant pathways that are upregulated in each cluster, FDR < 0.05 (C). Heatmap representation of the top 20 differentially expressed genes between mesenchymal stem cell (MSC)-1 and MSC-2 subpopulations in ABD and GF depots (D). Feature plot showing expression of POSTN and SRP9 genes (E). Dot-plot showing the significant pathways that are upregulated in each cluster, FDR < 0.05 (F). Heatmap representation of the top 20 differentially expressed genes between MSC-1 and MSC-3 subpopulations (G). Feature plot showing expression of MOB4 and TMSB4X genes (H). Dot-plot showing the significant pathways that are upregulated in each cluster, FDR < 0.05 (I).
Figure 4.
Figure 4.
Comparison with in vivo data. UMAP of 5,817 stroma vascular fraction (SVF)-cells from abdominal (ABD) and gluteofemoral (GF) subcutaneous white adipose tissue of five healthy women and dot-plot showing expression of selected marker genes used to label the six clusters (A). Dot-plot showing the significant pathways that are upregulated in ABD vs. GF depot for the stem cell cluster, FDR < 0.05, no pathways were identified in GF depot (B). Dot-plot showing the significant pathways that are up- and downregulated in Committed-1 and Committed-2 clusters vs. all the other adipose-derived stem cell (ADSC)-clusters, FDR < 0.05 (C). Venn diagram displaying the number of overlapping genes that were upregulated in the stem cell (SC) cluster in GF and in each mesenchymal stem cell (MSC)-ADSC clusters (D). Venn diagram displaying the number of overlapping genes that were upregulated in the stem cell cluster in ABD and in each committed-ADSC clusters (E). Comparison of differentially expressed genes in MSC-2 and MSC-3 in relation to differences between ABD and GF stem cell cluster (F). Blue dots mean genes are upregulated in GF stem cells and red dots mean genes are upregulated in ABD stem cells.
Figure 5.
Figure 5.
Validation in vitro of the single-cell (sc)RNA-seq findings. Gene expression levels of adipogenic marker genes before (D0) and after differentiation (D12) in mesenchymal stem cell (MSC)-1, MSC-2 and SMC previously fluorescence-activated cell sorting (FACS) sorted (A). The colors describe the different subpopulations of adipose-derived stem cell (ADSC) isolated by FACS. Lines are drawn connecting values from before and after differentiation. Protein expression levels of adipocyte marker (SCD1) was measured on day 12 of differentiation of MSC-1, MSC-2 and SMC. Hsp90 were used as internal control (B). Gene expression levels of fibrotic and insulin resistant marker genes before (D0) and after differentiation (D12) (C). The colors describe the different subpopulations of ADSC isolated by FACS. Lines are drawn connecting values from before and after differentiation.
Figure 6.
Figure 6.
Adipose-derived stem cell (ADSC) clusters in metabolic conditions. UMAPs and stacked bar-plots showing the repartition of the ADSCs subpopulations according to the body shape (apple vs. pear) in abdominal (ABD) depot (A) and gluteofemoral (GF) depot (B). Feature plot showing expression of EIF1, CXCL12, and MGP genes (C).

Similar articles

Cited by

  • Enhancing adipose tissue plasticity: progenitor cell roles in metabolic health.
    Lecoutre S, Rebière C, Maqdasy S, Lambert M, Dussaud S, Abatan JB, Dugail I, Gautier EL, Clément K, Marcelin G. Lecoutre S, et al. Nat Rev Endocrinol. 2025 May;21(5):272-288. doi: 10.1038/s41574-024-01071-y. Epub 2025 Jan 6. Nat Rev Endocrinol. 2025. PMID: 39757324 Review.
  • Aging human abdominal subcutaneous white adipose tissue at single cell resolution.
    Whytock KL, Divoux A, Sun Y, Pino MF, Yu G, Jin CA, Robino JJ, Plekhanov A, Varlamov O, Smith SR, Walsh MJ, Sparks LM. Whytock KL, et al. Aging Cell. 2024 Nov;23(11):e14287. doi: 10.1111/acel.14287. Epub 2024 Aug 14. Aging Cell. 2024. PMID: 39141531 Free PMC article.
  • Potential Consequences of the Use of Adipose-Derived Stem Cells in the Treatment of Hepatocellular Carcinoma.
    Gładyś A, Mazurski A, Czekaj P. Gładyś A, et al. Int J Mol Sci. 2024 Jul 17;25(14):7806. doi: 10.3390/ijms25147806. Int J Mol Sci. 2024. PMID: 39063048 Free PMC article. Review.
  • Towards a consensus atlas of human and mouse adipose tissue at single-cell resolution.
    Loft A, Emont MP, Weinstock A, Divoux A, Ghosh A, Wagner A, Hertzel AV, Maniyadath B, Deplancke B, Liu B, Scheele C, Lumeng C, Ding C, Ma C, Wolfrum C, Strieder-Barboza C, Li C, Truong DD, Bernlohr DA, Stener-Victorin E, Kershaw EE, Yeger-Lotem E, Shamsi F, Hui HX, Camara H, Zhong J, Kalucka J, Ludwig JA, Semon JA, Jalkanen J, Whytock KL, Dumont KD, Sparks LM, Muir LA, Fang L, Massier L, Saraiva LR, Beyer MD, Jeschke MG, Mori MA, Boroni M, Walsh MJ, Patti ME, Lynes MD, Blüher M, Rydén M, Hamda N, Solimini NL, Mejhert N, Gao P, Gupta RK, Murphy R, Pirouzpanah S, Corvera S, Tang S, Das SK, Schmidt SF, Zhang T, Nelson TM, O'Sullivan TE, Efthymiou V, Wang W, Tong Y, Tseng YH, Mandrup S, Rosen ED. Loft A, et al. Nat Metab. 2025 May;7(5):875-894. doi: 10.1038/s42255-025-01296-9. Epub 2025 May 13. Nat Metab. 2025. PMID: 40360756 Review.

References

    1. Goodpaster BH, Thaete FL, Simoneau JA, Kelley DE. Subcutaneous abdominal fat and thigh muscle composition predict insulin sensitivity independently of visceral fat. Diabetes 46: 1579–1585, 1997. doi:10.2337/diacare.46.10.1579. - DOI - PubMed
    1. Smith SR, Lovejoy JC, Greenway F, Ryan D, deJonge L, de la Bretonne J, Volafova J, Bray GA. Contributions of total body fat, abdominal subcutaneous adipose tissue compartments, and visceral adipose tissue to the metabolic complications of obesity. Metabolism 50: 425–435, 2001. doi:10.1053/meta.2001.21693. - DOI - PubMed
    1. Després JP, Lemieux I. Abdominal obesity and metabolic syndrome. Nature 444: 881–887, 2006. doi:10.1038/nature05488. - DOI - PubMed
    1. Lee MJ, Wu Y, Fried SK. Adipose tissue heterogeneity: implication of depot differences in adipose tissue for obesity complications. Mol Aspects Med 34: 1–11, 2013. doi:10.1016/j.mam.2012.10.001. - DOI - PMC - PubMed
    1. Vague J. The degree of masculine differentiation of obesities: a factor determining predisposition to diabetes, atherosclerosis, gout, and uric calculous disease. Am J Clin Nutr 4: 20–34, 1956. doi:10.1093/ajcn/4.1.20. - DOI - PubMed

Publication types

LinkOut - more resources