. 2024 Jun 3;14(6):1018-1047.
doi: 10.1158/2159-8290.CD-23-1380.

Spatial Architecture of Myeloid and T Cells Orchestrates Immune Evasion and Clinical Outcome in Lung Cancer

Affiliations

Spatial Architecture of Myeloid and T Cells Orchestrates Immune Evasion and Clinical Outcome in Lung Cancer

Katey S S Enfield et al. Cancer Discov. .

Abstract

Understanding the role of the tumor microenvironment (TME) in lung cancer is critical to improving patient outcomes. We identified four histology-independent archetype TMEs in treatment-naïve early-stage lung cancer using imaging mass cytometry in the TRACERx study (n = 81 patients/198 samples/2.3 million cells). In immune-hot adenocarcinomas, spatial niches of T cells and macrophages increased with clonal neoantigen burden, whereas such an increase was observed for niches of plasma and B cells in immune-excluded squamous cell carcinomas (LUSC). Immune-low TMEs were associated with fibroblast barriers to immune infiltration. The fourth archetype, characterized by sparse lymphocytes and high tumor-associated neutrophil (TAN) infiltration, had tumor cells spatially separated from vasculature and exhibited low spatial intratumor heterogeneity. TAN-high LUSC had frequent PIK3CA mutations. TAN-high tumors harbored recently expanded and metastasis-seeding subclones and had a shorter disease-free survival independent of stage. These findings delineate genomic, immune, and physical barriers to immune surveillance and implicate neutrophil-rich TMEs in metastasis.

Significance: This study provides novel insights into the spatial organization of the lung cancer TME in the context of tumor immunogenicity, tumor heterogeneity, and cancer evolution. Pairing the tumor evolutionary history with the spatially resolved TME suggests mechanistic hypotheses for tumor progression and metastasis with implications for patient outcome and treatment. This article is featured in Selected Articles from This Issue, p. 897.


Figures

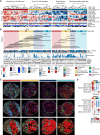
Figure 1. IMC workflow defines the single-cell spatial landscape of the NSCLC tumor microenvironment. A, TRACERx 100 IMC cohort. We developed and applied two IMC antibody panels, Pan-immune and T cells and stroma, to tissue microarrays (TMA) from clinical samples collected at surgical resection (created with BioRender.com). B, Targets of antibodies described in this study. Bold text indicates targets detected in both IMC panels. C, IMC data were acquired from stained TMAs and processed to identify single cells and their phenotypes. D, 40,000 μm2 crops of IMC images representing the markers from B with corresponding cell types from the pan-immune panel, unless annotated with an asterisk for the T cells and stroma panel only. E, A heat map of the z-score normalized median intensities of markers from the pan-immune panel across the identified cell subtypes. F, Proportion of major immune cell types identified in the pan-immune IMC data set per TMA core, calculated over the total tissue area (illustrated as blue and gold domains), tumor/epithelial compartment (gold domain), or the stromal compartment (blue domain). In two normal cores, the epithelial cell signal reflected very thin cells, which were not resolved into an epithelial compartment. All data from these cores are represented by the stroma compartment. Cell types color legend applies to D and F, where asterisks denote cell types identified in T cells and stroma panel only. LUAD, lung adenocarcinoma; LUSC, lung squamous cell carcinoma; NSCLC, non–small cell lung cancer; other, other non–small cell lung cancer histologies; IMC, imaging mass cytometry.
Figure 1.
IMC workflow defines the single-cell spatial landscape of the NSCLC tumor microenvironment. A, TRACERx 100 IMC cohort. We developed and applied two IMC antibody panels, Pan-immune and T cells and stroma, to tissue microarrays (TMA) from clinical samples collected at surgical resection (created with BioRender.com). B, Targets of antibodies described in this study. Bold text indicates targets detected in both IMC panels. C, IMC data were acquired from stained TMAs and processed to identify single cells and their phenotypes. D, 40,000 μm2 crops of IMC images representing the markers from B with corresponding cell types from the pan-immune panel, unless annotated with an asterisk for the T cells and stroma panel only. E, A heat map of the z-score normalized median intensities of markers from the pan-immune panel across the identified cell subtypes. F, Proportion of major immune cell types identified in the pan-immune IMC data set per TMA core, calculated over the total tissue area (illustrated as blue and gold domains), tumor/epithelial compartment (gold domain), or the stromal compartment (blue domain). In two normal cores, the epithelial cell signal reflected very thin cells, which were not resolved into an epithelial compartment. All data from these cores are represented by the stroma compartment. Cell types color legend applies to D and F, where asterisks denote cell types identified in T cells and stroma panel only. LUAD, lung adenocarcinoma; LUSC, lung squamous cell carcinoma; NSCLC, non–small cell lung cancer; other, other non–small cell lung cancer histologies; IMC, imaging mass cytometry.
Figure 2. Four TME classes in NSCLC defined by immune composition in tumor nests and surrounding stroma. A, Tumor cores were classified into four TME classes, derived by clustering immune cell densities in the tumor nest and stroma. Only LUAD (n = 65 cores, 35 tumors) and LUSC (n = 48, 23 tumors) tumor cores are featured, and corresponding clinical annotations are displayed. Regional growth patterns are shown for LUAD: lepidic (low grade), acinar and papillary (mid-grade), solid and cribriform (high grade). B, TME classifications displayed separately for LUAD and LUSC. Numbers indicate the number of cores with a given TME class for each histology subtype. The barplot shows the total expressed neoantigen count for all predicted HLA alleles in the range 0–269 for LUAD and 23–160 for LUSC, colored by their clonal and subclonal status. Horizontal lines connect tumor cores from the same multiregion tumor (n = 33 tumors). The annotation bars display tumor genomic features and PD-L1 tumor cell (TC) staining (SP142 IHC) for the corresponding tumor cores. C, Composite images and cell type maps of representative examples for each TME class. Crop insets are 82 μm in diameter. D, A heat map of T values derived from an LMEM of the major cell type density across TME classes, adjusted for histology subtype as a fixed effect and patient as a random effect. Significant relationships are indicated with an asterisk for P ≤ 0.05. TIL, tumor-infiltrating lymphocyte; MΦ, macrophage; LUAD, lung adenocarcinoma; LUSC, lung squamous cell carcinoma; NSCLC, non–small cell lung cancer; TME, tumor microenvironment; TMB, tumor mutation burden; muts/Mb, mutations per megabase; panCK, pancytokeratin; LMEM, linear mixed effects model.
Figure 2.
Four TME classes in NSCLC defined by immune composition in tumor nests and surrounding stroma. A, Tumor cores were classified into four TME classes, derived by clustering immune cell densities in the tumor nest and stroma. Only LUAD (n = 65 cores, 35 tumors) and LUSC (n = 48, 23 tumors) tumor cores are featured, and corresponding clinical annotations are displayed. Regional growth patterns are shown for LUAD: lepidic (low grade), acinar and papillary (mid-grade), solid and cribriform (high grade). B, TME classifications displayed separately for LUAD and LUSC. Numbers indicate the number of cores with a given TME class for each histology subtype. The barplot shows the total expressed neoantigen count for all predicted HLA alleles in the range 0–269 for LUAD and 23–160 for LUSC, colored by their clonal and subclonal status. Horizontal lines connect tumor cores from the same multiregion tumor (n = 33 tumors). The annotation bars display tumor genomic features and PD-L1 tumor cell (TC) staining (SP142 IHC) for the corresponding tumor cores. C, Composite images and cell type maps of representative examples for each TME class. Crop insets are 82 μm in diameter. D, A heat map of T values derived from an LMEM of the major cell type density across TME classes, adjusted for histology subtype as a fixed effect and patient as a random effect. Significant relationships are indicated with an asterisk for P ≤ 0.05. TIL, tumor-infiltrating lymphocyte; MΦ, macrophage; LUAD, lung adenocarcinoma; LUSC, lung squamous cell carcinoma; NSCLC, non–small cell lung cancer; TME, tumor microenvironment; TMB, tumor mutation burden; muts/Mb, mutations per megabase; panCK, pancytokeratin; LMEM, linear mixed effects model.
Figure 3. Spatial features associated with neoantigen burden and immune low TMEs. A, Correlation of densities of spatial cellular communities and the burden of expressed clonal, subclonal and total neoantigens predicted to bind intact HLA alleles, after accounting for HLA LOH, in LUAD (n = 31, 51 tumor cores) and LUSC (n = 17, 37 tumor cores). Bar plot shows the median neoantigen burden with whiskers extending to the 75th percentile. B, Comparison of the densities of spatial cellular communities in a given TME class compared with all other TME classes combined. LUAD: n = 21 TS:TIL+MΦ high cores, n = 20 T:TIL+MΦ excluded cores, n = 13 TS:Immune low cores, n = 11 TS:Neutrophil high cores. LUSC: n = 13 TS:TIL+MΦ high cores, n = 12 T:TIL+MΦ excluded cores, n = 8 TS:Immune low cores, n = 15 TS:Neutrophil high cores. Box sizes in A and B correspond to T values. C, Community and cell subtype maps from a LUAD tumor core with a high burden of expressed clonal neoantigens and high densities of C2:T-cell enriched and C6:macrophage and T cells communities. D, Community and cell subtype maps from a LUSC tumor core with a high burden of expressed clonal neoantigens and high densities of community C9:B cells and plasma cells. Single cells in C and D are colored by community according to the color legend below D or cell subtype as indicated. Scale bars, 200 μm. Middle, an enlargement of the area highlighted with a white box in the left plot with matched cell subtypes shown in the right plot. E, Schematic of αSMA+ fibroblast barrier score calculation. The barrier score measures the degree of spatial interpositioning of tumor cell–adjacent αSMA+ fibroblasts between CD8 T cells and their nearest tumor cell(s) in a tissue core. In the lower half of the schematic, three nearest tumor cells are defined for the green CD8 T cell, all six hops away. Tumor cell–adjacent αSMA+ fibroblasts are found on two of these three paths from CD8 T-cell to tumor cell, resulting in a barrier score of ⅔. F, Boxplot comparing the αSMA+ fibroblast barrier scores in a given TME class compared with all other TME classes combined in LUAD (n = 36, 57 tumor cores) and LUSC (n = 22, 45 tumor cores). Boxplots show median and lower and upper quartile values, and whiskers extend up to 1.5 × IQR above and below the quartiles. G, Representative IMC images and cell type maps from LUAD and LUSC tumor cores classified as TS:Immune low with a high barrier score. Scale bars, 200 μm. P values in A, B, and F and T values in A and B were calculated in a linear mixed-effects model with patient as a random effect, using smoking status as a fixed effect in A with a P value < 0.05 considered significant. LUAD, lung adenocarcinoma; LUSC, lung squamous cell carcinoma; panCK, pancytokeratin; TS, tumor/stroma; T, tumor; TIL, tumor-infiltrating lymphocytes; MΦ, macrophage; *, P < 0.05; **, P < 0.01.
Figure 3.
Spatial features associated with neoantigen burden and immune low TMEs. A, Correlation of densities of spatial cellular communities and the burden of expressed clonal, subclonal and total neoantigens predicted to bind intact HLA alleles, after accounting for HLA LOH, in LUAD (n = 31, 51 tumor cores) and LUSC (n = 17, 37 tumor cores). Bar plot shows the median neoantigen burden with whiskers extending to the 75th percentile. B, Comparison of the densities of spatial cellular communities in a given TME class compared with all other TME classes combined. LUAD: n = 21 TS:TIL+MΦ high cores, n = 20 T:TIL+MΦ excluded cores, n = 13 TS:Immune low cores, n = 11 TS:Neutrophil high cores. LUSC: n = 13 TS:TIL+MΦ high cores, n = 12 T:TIL+MΦ excluded cores, n = 8 TS:Immune low cores, n = 15 TS:Neutrophil high cores. Box sizes in A and B correspond to T values. C, Community and cell subtype maps from a LUAD tumor core with a high burden of expressed clonal neoantigens and high densities of C2:T-cell enriched and C6:macrophage and T cells communities. D, Community and cell subtype maps from a LUSC tumor core with a high burden of expressed clonal neoantigens and high densities of community C9:B cells and plasma cells. Single cells in C and D are colored by community according to the color legend below D or cell subtype as indicated. Scale bars, 200 μm. Middle, an enlargement of the area highlighted with a white box in the left plot with matched cell subtypes shown in the right plot. E, Schematic of αSMA+ fibroblast barrier score calculation. The barrier score measures the degree of spatial interpositioning of tumor cell–adjacent αSMA+ fibroblasts between CD8 T cells and their nearest tumor cell(s) in a tissue core. In the lower half of the schematic, three nearest tumor cells are defined for the green CD8 T cell, all six hops away. Tumor cell–adjacent αSMA+ fibroblasts are found on two of these three paths from CD8 T-cell to tumor cell, resulting in a barrier score of ⅔. F, Boxplot comparing the αSMA+ fibroblast barrier scores in a given TME class compared with all other TME classes combined in LUAD (n = 36, 57 tumor cores) and LUSC (n = 22, 45 tumor cores). Boxplots show median and lower and upper quartile values, and whiskers extend up to 1.5 × IQR above and below the quartiles. G, Representative IMC images and cell type maps from LUAD and LUSC tumor cores classified as TS:Immune low with a high barrier score. Scale bars, 200 μm. P values in A, B, and F and T values in A and B were calculated in a linear mixed-effects model with patient as a random effect, using smoking status as a fixed effect in A with a P value < 0.05 considered significant. LUAD, lung adenocarcinoma; LUSC, lung squamous cell carcinoma; panCK, pancytokeratin; TS, tumor/stroma; T, tumor; TIL, tumor-infiltrating lymphocytes; MΦ, macrophage; *, P < 0.05; **, P < 0.01.
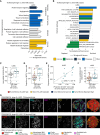
Figure 4. Neutrophil infiltration in LUSC is associated with distinct metabolic and immunosuppressive phenotypes. A, Gene Ontology (GO) biological processes enriched among upregulated genes in the TS:Neutrophil high TME class (n = 10 cores) compared with other TME classes combined (n = 28 cores) in LUSC (FDR < 0.01, gene ratio > 0.05). B, GSEA of hallmark gene sets compared between tumor cores from the Tumor/Stroma:Neutrophil high TME class and other TME classes combined, using the t-statistic derived from the limma–voom model on TMM-normalized gene expression. Significantly enriched pathways were colored by type of pathway (FDR < 0.05). C, Normalized enrichment score derived from single-sample GSEA visualized for TS:Neutrophil high and cores from other TME classes. The P value is derived from GSEA of LUSC as shown in A and adjusted for other hallmark pathways using the Benjamini–Hochberg method. D, Proportion of tumor cells assigned MCT4+ in TS:Neutrophil high tumor cores compared with tumor cores from other TME classes combined in LUSC. E, Spearman correlation coefficient and P value comparing the proportion of MCT4+ and CAIX+ tumor cells in TS:Neutrophil high LUSC TMEs. F, Median distance between LUSC tumor cells to their nearest endothelial cell per core in TS:Neutrophil high TME class compared with all other TME classes combined. G, Single-channel images and composite image alongside cell type map displaying tumor cells, neutrophils (MPO, yellow), endothelial cells (CD31, magenta), and regions of hypoxia (CAIX, cyan) and MCT4 (green) expression. Boxplots show median and lower and upper quartile values, and whiskers extend up to 1.5 × IQR above and below the quartiles. P values for D and F were calculated in a linear mixed-effects model with patient as the random-effect covariate. LUSC, lung squamous cell carcinoma; TS, tumor/stroma; FDR, false discovery rate; TMM, trimmed mean of M-values; panCK, pancytokeratin; *, P < 0.05; **, P < 0.01; ***, P < 0.001.
Figure 4.
Neutrophil infiltration in LUSC is associated with distinct metabolic and immunosuppressive phenotypes. A, Gene Ontology (GO) biological processes enriched among upregulated genes in the TS:Neutrophil high TME class (n = 10 cores) compared with other TME classes combined (n = 28 cores) in LUSC (FDR < 0.01, gene ratio > 0.05). B, GSEA of hallmark gene sets compared between tumor cores from the Tumor/Stroma:Neutrophil high TME class and other TME classes combined, using the t-statistic derived from the limma–voom model on TMM-normalized gene expression. Significantly enriched pathways were colored by type of pathway (FDR < 0.05). C, Normalized enrichment score derived from single-sample GSEA visualized for TS:Neutrophil high and cores from other TME classes. The P value is derived from GSEA of LUSC as shown in A and adjusted for other hallmark pathways using the Benjamini–Hochberg method. D, Proportion of tumor cells assigned MCT4+ in TS:Neutrophil high tumor cores compared with tumor cores from other TME classes combined in LUSC. E, Spearman correlation coefficient and P value comparing the proportion of MCT4+ and CAIX+ tumor cells in TS:Neutrophil high LUSC TMEs. F, Median distance between LUSC tumor cells to their nearest endothelial cell per core in TS:Neutrophil high TME class compared with all other TME classes combined. G, Single-channel images and composite image alongside cell type map displaying tumor cells, neutrophils (MPO, yellow), endothelial cells (CD31, magenta), and regions of hypoxia (CAIX, cyan) and MCT4 (green) expression. Boxplots show median and lower and upper quartile values, and whiskers extend up to 1.5 × IQR above and below the quartiles. P values for D and F were calculated in a linear mixed-effects model with patient as the random-effect covariate. LUSC, lung squamous cell carcinoma; TS, tumor/stroma; FDR, false discovery rate; TMM, trimmed mean of M-values; panCK, pancytokeratin; *, P < 0.05; **, P < 0.01; ***, P < 0.001.
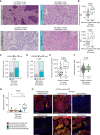
Figure 5. Neutrophil-rich TMEs are associated with activating mutations in PI3K and tumor-intrinsic CXCL8 upregulation. A, Representative crops of tumor-level H&E images with low TAN scores in the tumor nest and stroma (left) and high TAN scores in the tumor nest and stroma (right), inferred as the proportion of the neutrophil area in tumor/stroma from the total tumor/stroma tissue area. Scale bar, 50 μm; 400× magnification. B, Neutrophil cell density as defined by IMC compared between region-level TAN-low versus TAN-high tumor cores based on H&E scores in LUAD and LUSC. C and D, Proportion of tumor cores with (mut) and without (wt) PIK3CA driver mutations compared between TS:Neutrophil high versus other TME classes combined (C) and region-level TAN-High versus TAN-Low cores (D) in LUSC. P values were derived from a Chi-square test. E, Neutrophil cell density by PIK3CA mutation status, points colored by TME class assignment. F and G, TMM expression values for CXCL8 compared by PIK3CA mutation status (F) and between TME classes (G) in LUSC. H, Immunofluorescence images of CXCL8 RNAscope multiplexed with antibody staining of pancytokeratin (panCK) or MPO in an LUSC tumor region with a TS:Neutrophil high TME and subclonal PIK3CA mutation, and an LUSC patient with multiple TAN-high tumor regions and a clonal PIK3CA mutation. panCK and MPO examples for CRUK0075:R2 illustrate the same region of interest, whereas different regions of interest are shown for CRUK0468:R6. Scale bar, 100 μm. P values for B and E were calculated in a linear mixed-effects model with patient as the random-effect covariate. P values in F and G were derived from a limma–voom differential expression analysis correcting for multiple regions per tumor. ·, P < 0.1; *, P < 0.05; **, P < 0.01; ***, P < 0.001; LUAD, lung adenocarcinoma; LUSC, lung squamous cell carcinoma; TMM, trimmed mean of M-values; TS, tumor/stroma; TIL, tumor-infiltrating lymphocyte; MΦ, macrophage; TAN, tumor-associated neutrophils; H&E, hematoxylin and eosin; mt, mutant; wt, wild-type.
Figure 5.
Neutrophil-rich TMEs are associated with activating mutations in PI3K and tumor-intrinsic CXCL8 upregulation. A, Representative crops of tumor-level H&E images with low TAN scores in the tumor nest and stroma (left) and high TAN scores in the tumor nest and stroma (right), inferred as the proportion of the neutrophil area in tumor/stroma from the total tumor/stroma tissue area. Scale bar, 50 μm; 400× magnification. B, Neutrophil cell density as defined by IMC compared between region-level TAN-low versus TAN-high tumor cores based on H&E scores in LUAD and LUSC. C and D, Proportion of tumor cores with (mut) and without (wt) PIK3CA driver mutations compared between TS:Neutrophil high versus other TME classes combined (C) and region-level TAN-High versus TAN-Low cores (D) in LUSC. P values were derived from a Chi-square test. E, Neutrophil cell density by PIK3CA mutation status, points colored by TME class assignment. F and G, TMM expression values for CXCL8 compared by PIK3CA mutation status (F) and between TME classes (G) in LUSC. H, Immunofluorescence images of CXCL8 RNAscope multiplexed with antibody staining of pancytokeratin (panCK) or MPO in an LUSC tumor region with a TS:Neutrophil high TME and subclonal PIK3CA mutation, and an LUSC patient with multiple TAN-high tumor regions and a clonal PIK3CA mutation. panCK and MPO examples for CRUK0075:R2 illustrate the same region of interest, whereas different regions of interest are shown for CRUK0468:R6. Scale bar, 100 μm. P values for B and E were calculated in a linear mixed-effects model with patient as the random-effect covariate. P values in F and G were derived from a limma–voom differential expression analysis correcting for multiple regions per tumor. ·, P < 0.1; *, P < 0.05; **, P < 0.01; ***, P < 0.001; LUAD, lung adenocarcinoma; LUSC, lung squamous cell carcinoma; TMM, trimmed mean of M-values; TS, tumor/stroma; TIL, tumor-infiltrating lymphocyte; MΦ, macrophage; TAN, tumor-associated neutrophils; H&E, hematoxylin and eosin; mt, mutant; wt, wild-type.
Figure 6. Neutrophil infiltration is associated with recent subclonal expansion and poorer disease-free survival. A, Comparison of neutrophil cell density in primary tumors with metastasis-seeding clones detectable at time of surgery or during follow-up (metastasizing tumors) to tumors from patients who were metastasis-free and recurrence-free for more than 3 years of follow-up time (control) in LUAD (n = 28) and LUSC (n = 15) within the TRACERx discovery cohort. Maximum neutrophil density taken for tumors with multiple tumor cores. P values derived from one-tailed Wilcoxon test. B, Kaplan–Meier curves for DFS according to tumor-level TAN score in the validation cohort (n = 332 patients). P value derived from univariate Cox model adjusted for histology. C, Multivariable Cox proportional hazard regression analysis of DFS using tumor-level TAN score and tumor-level necrosis evaluation from H&E images of diagnostic tumor blocks. D, Recent subclonal expansion score, measured as the maximum cancer cell fraction of subclones at the terminus of the phylogenetic tree, compared between TAN-high and TAN-low tumor regions in LUAD and LUSC patients from the TRACERx 421 cohort. P values were derived from a linear mixed effects model with patient as random effect. E, Spatial ITH score of cell types and communities and ITH probabilities of TME classes in multiregion analysis (pan-immune n = 41 tumors, 112 cores). ITH score was calculated as the average standard deviation of the cell/community density in multiple regions per tumor and z-score transformed. ITH score of αSMA+ cells was derived from T cells and stroma panel (n = 39 tumors, 105 cores). ITH probability was calculated as 1 − probability of all regions having the same indicated TME class. F, Example phylogenetic tree depicting a stage IIIA LUSC case with a clonal PIK3CA mutation, high TAN scores, and recent subclonal expansion, including in a region (R5) that seeded a lymph node (LN) metastasis (FLN, FFPE LN). The metastasis-seeding lineage is highlighted in orange. Tumor-level TAN scores and regional subclonal expansion (SubExp) scores are reported for primary tumor regions. The reported TAN score represents the maximum of the tumor nest and stroma scores. Each cluster in the phylogenetic tree is assigned a color that is also represented in the region clone maps. The clone maps illustrate the prevalence of each clone within a region. G, IMC images shown for R5 and the LN metastasis. Scale bar, 200 μm. H, Summary schematic of the link between tumors with a neutrophil enriched microenvironment with tumor progression. ·, P < 0.1; *, P < 0.05; **, P < 0.01; ***, P < 0.001; LUAD, lung adenocarcinoma; LUSC, lung squamous cell carcinoma; ITH, intratumor heterogeneity.
Figure 6.
Neutrophil infiltration is associated with recent subclonal expansion and poorer disease-free survival. A, Comparison of neutrophil cell density in primary tumors with metastasis-seeding clones detectable at time of surgery or during follow-up (metastasizing tumors) to tumors from patients who were metastasis-free and recurrence-free for more than 3 years of follow-up time (control) in LUAD (n = 28) and LUSC (n = 15) within the TRACERx discovery cohort. Maximum neutrophil density taken for tumors with multiple tumor cores. P values derived from one-tailed Wilcoxon test. B, Kaplan–Meier curves for DFS according to tumor-level TAN score in the validation cohort (n = 332 patients). P value derived from univariate Cox model adjusted for histology. C, Multivariable Cox proportional hazard regression analysis of DFS using tumor-level TAN score and tumor-level necrosis evaluation from H&E images of diagnostic tumor blocks. D, Recent subclonal expansion score, measured as the maximum cancer cell fraction of subclones at the terminus of the phylogenetic tree, compared between TAN-high and TAN-low tumor regions in LUAD and LUSC patients from the TRACERx 421 cohort. P values were derived from a linear mixed effects model with patient as random effect. E, Spatial ITH score of cell types and communities and ITH probabilities of TME classes in multiregion analysis (pan-immune n = 41 tumors, 112 cores). ITH score was calculated as the average standard deviation of the cell/community density in multiple regions per tumor and z-score transformed. ITH score of αSMA+ cells was derived from T cells and stroma panel (n = 39 tumors, 105 cores). ITH probability was calculated as 1 − probability of all regions having the same indicated TME class. F, Example phylogenetic tree depicting a stage IIIA LUSC case with a clonal PIK3CA mutation, high TAN scores, and recent subclonal expansion, including in a region (R5) that seeded a lymph node (LN) metastasis (FLN, FFPE LN). The metastasis-seeding lineage is highlighted in orange. Tumor-level TAN scores and regional subclonal expansion (SubExp) scores are reported for primary tumor regions. The reported TAN score represents the maximum of the tumor nest and stroma scores. Each cluster in the phylogenetic tree is assigned a color that is also represented in the region clone maps. The clone maps illustrate the prevalence of each clone within a region. G, IMC images shown for R5 and the LN metastasis. Scale bar, 200 μm. H, Summary schematic of the link between tumors with a neutrophil enriched microenvironment with tumor progression. ·, P < 0.1; *, P < 0.05; **, P < 0.01; ***, P < 0.001; LUAD, lung adenocarcinoma; LUSC, lung squamous cell carcinoma; ITH, intratumor heterogeneity.

References

    1. Sorin M, Rezanejad M, Karimi E, Fiset B, Desharnais L, Perus LJM, et al. . Single-cell spatial landscapes of the lung tumour immune microenvironment. Nature 2023;614:548–54. - PMC - PubMed
    1. Ali HR, Jackson HW, Zanotelli VRT, Danenberg E, Fischer JR, Bardwell H, et al. . Imaging mass cytometry and multiplatform genomics define the phenogenomic landscape of breast cancer. Nat Cancer 2020;1:163–75. - PubMed
    1. Jackson HW, Fischer JR, Zanotelli VRT, Ali HR, Mechera R, Soysal SD, et al. . The single-cell pathology landscape of breast cancer. Nature 2020;578:615–20. - PubMed
    1. Danenberg E, Bardwell H, Zanotelli VRT, Provenzano E, Chin S-F, Rueda OM, et al. . Breast tumor microenvironment structures are associated with genomic features and clinical outcome. Nat Genet 2022;54:660–9. - PMC - PubMed
    1. Wang XQ, Danenberg E, Huang C-S, Egle D, Callari M, Bermejo B, et al. . Spatial predictors of immunotherapy response in triple-negative breast cancer. Nature 2023;621:868–76. - PMC - PubMed

Grants and funding