. 2024 Apr 16;5(4):101499.
doi: 10.1016/j.xcrm.2024.101499. Epub 2024 Apr 5.

Circulating microbiome DNA as biomarkers for early diagnosis and recurrence of lung cancer

Affiliations

Circulating microbiome DNA as biomarkers for early diagnosis and recurrence of lung cancer

Haiming Chen et al. Cell Rep Med. .

Abstract

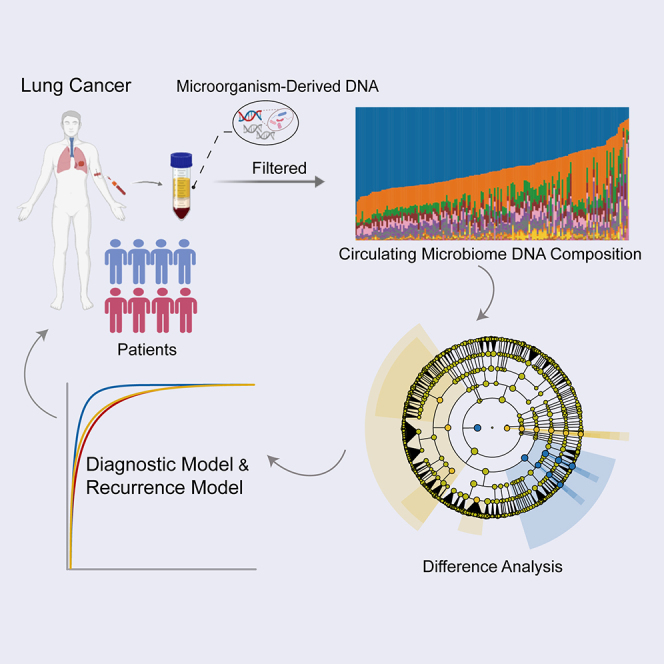
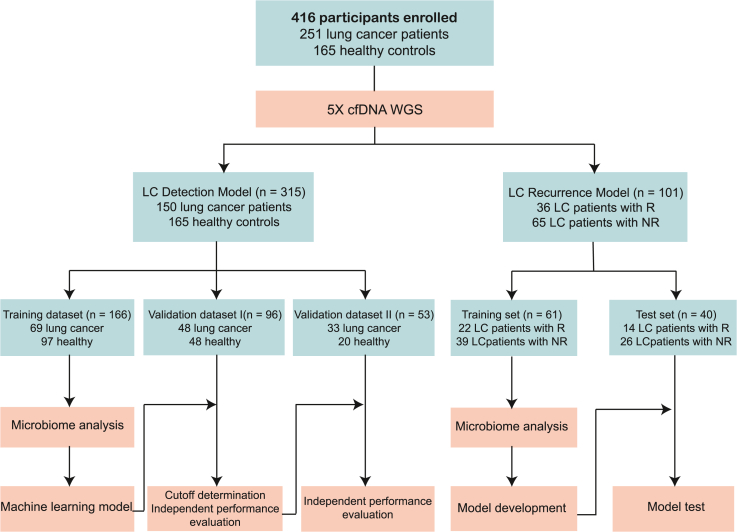
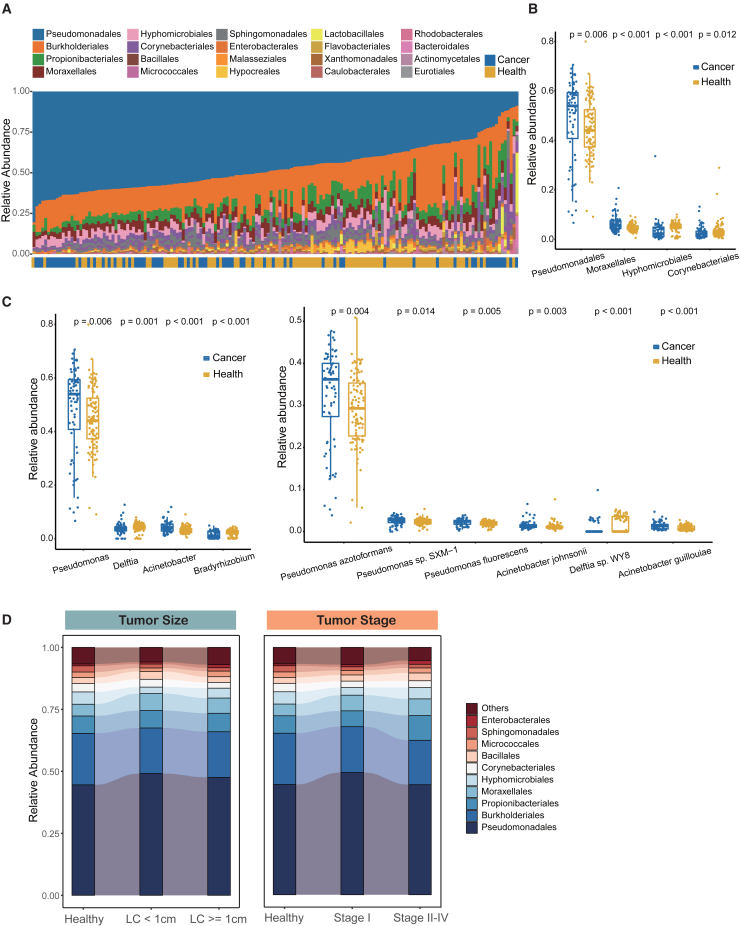
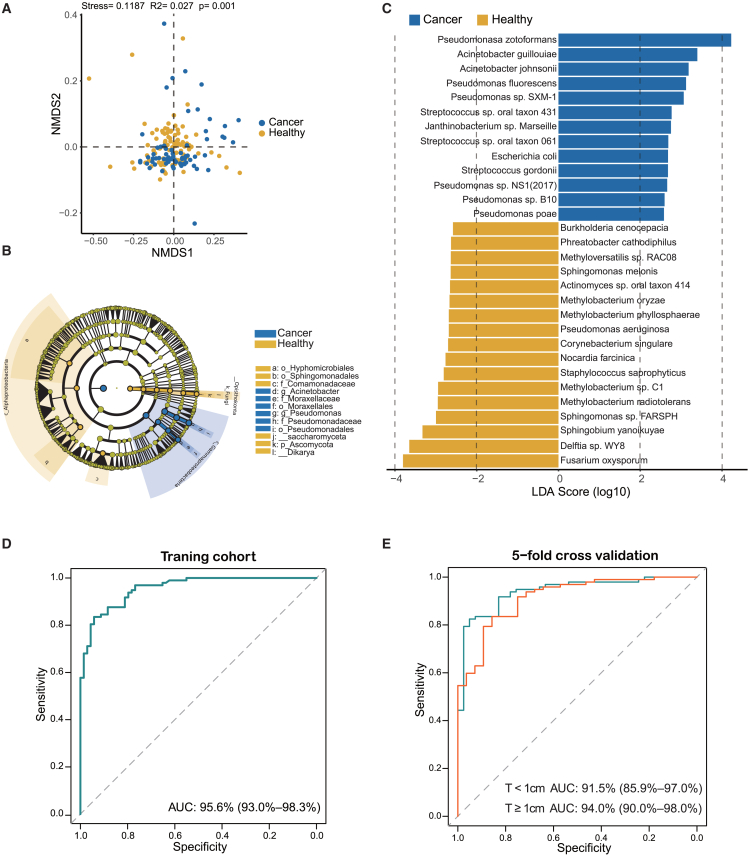
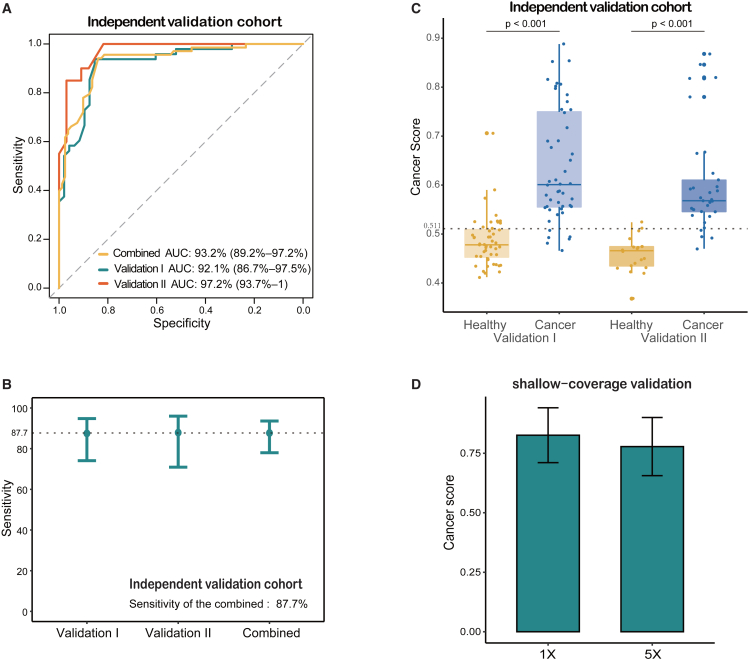
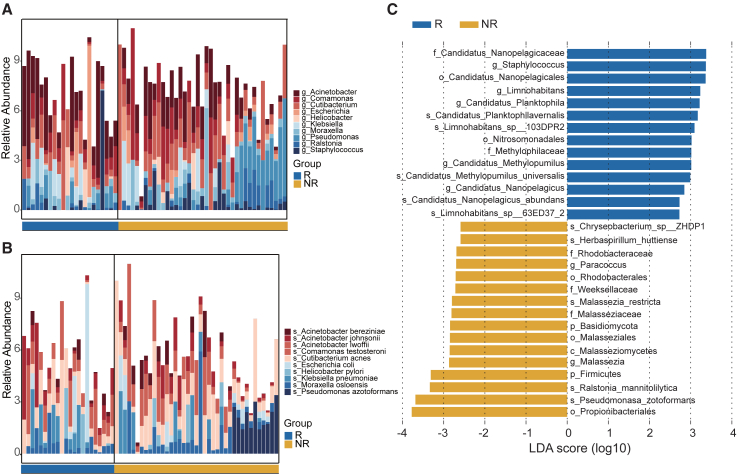
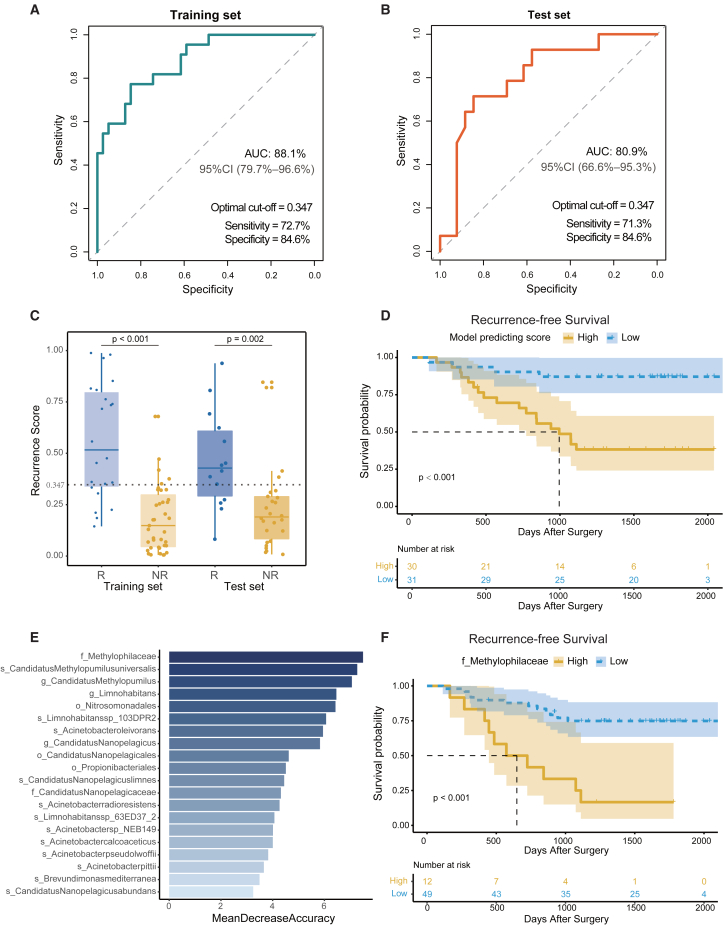
Lung cancer mortality is exacerbated by late-stage diagnosis. Emerging evidence indicates the potential clinical significance of distinct microbial signatures as diagnostic and prognostic biomarkers across various cancers. However, circulating microbiome DNA (cmDNA) profiles are underexplored in lung cancer (LC). Here, whole-genome sequencing is performed on plasma of LC patients and healthy controls (HCs). Differentially enriched microbial species are identified between LC and HC. A diagnostic model is developed, which has a high sensitivity of 87.7% and achieves an AUC of 93.2% in the independent validation dataset. Crucially, this model demonstrates the capability to detect early-stage LC, achieving a sensitivity of 86.5% for stage I and 87.1% for tumors <1 cm. In addition, we construct a cmDNA model for recurrence, which precisely predicts LC recurrence after surgery. Overall, this study highlights the significant alterations of cmDNA profiles in LC, indicating its potential as biomarkers for early diagnosis and recurrence.

Keywords: biomarker; circulating microbiome DNA; early detection; recurrence.


Conflict of interest statement

Declaration of interests The authors declare no competing interests.

Figures

None
Graphical abstract
Figure 1
Figure 1
Study workflow A total of 416 participants were included in this study. WGS of plasma cfDNA was performed, and the cmDNA features of each subject were profiled. LC, lung cancer; R, recurrence; NR, non-recurrence.
Figure 2
Figure 2
cmDNA microbiome composition of all participants in the training cohort (A) cmDNA microbiome composition at the order level (ordered by the most abundant taxa, Pseudomonadales order). (B) Relative abundance comparisons of Pseudomonadales, Moraxellales, Hyphomicrobiales, and Corynebacteriales in the LC and HC groups at the order level (Wilcoxon test). (C) Relative abundance comparison of significant taxa in the LC and HC groups at the genus level (left) and the species level (right) (Wilcoxon test). (D) Dynamic microbial composition of different tumor size subgroups (left) and different tumor stage subgroups (right) in the LC and HC groups at the order level.
Figure 3
Figure 3
Differential taxa identified and lung cancer detection model development (A) The NMDS plot showing beta diversity based on the Bray-Curtis distance between HC and LC groups. Significant differences were observed between LC patients and HCs with Adonis test (R2 = 0.027, p = 0.001). (B) Taxonomic cladogram from LEfSe showed significantly different taxa enriched in the HC and LC groups (the top 30 according to LDA). (C) LEfSe identified significantly differentially abundant species in the HC and LC groups (the top 30 according to LDA). (D) The receiver operating characteristic curve showed an AUC value of 95.6% in the training cohort. (E) The receiver operating characteristic curve of 5-fold cross-validation in predicting LC with different tumor size subgroups, the subgroup with smaller tumors (<1 cm, red line), and the subgroup with larger tumors (≥1 cm, green line).
Figure 4
Figure 4
Independent validation of the lung cancer detection model (A) The receiver operating characteristic curve evaluating the performance of the LC detection model in the combined validation cohort and its validation I and II cohorts separately. (B) Sensitivities of the LC detection model are 87.7% for the combined validation cohort, 87.5% for the validation I, and 87.9% for the validation II, respectively. (C) The boxplots showing the distribution of cancer scores in the LC and HC groups of the independent validation cohorts. The cutoff score for the independent validation I set is 0.511, and a Wilcoxon test was performed for the comparison between LC and HC subsets. (D) The boxplots showing the distribution of cancer scores in additional shallow-coverage validation dataset with the coverage depth of 1×, compared to WGS data of 5×. Error bars represent each group’s mean ± SD.
Figure 5
Figure 5
Differential taxa were enriched in the R group and NR group of the 61 patients with LC (A and B) Descriptive visual representation of top 10 microbial taxa showing the distinctive profile of microbiota between patients in the R and NR groups, at the genus level (A) and the species level (B), respectively. (C) LEfSe identified significantly differentially abundant taxa in the R and NR groups (the top 30 according to LDA).
Figure 6
Figure 6
The postoperative recurrence predicting model (A and B) Receiver operating characteristic curve delineating the association between predictive probability and the R group in the training (A) and test (B) sets. (C) The boxplots showing the distribution of recurrence scores in the R and NR groups of the training and test sets. The cutoff score set is 0.347, and a Wilcoxon test was performed for the comparison between the R group and the NR group. (D) The Kaplan-Meier method with log rank test estimates the RFS for patients with higher or lower levels of recurrence model-predicting scores. (E) Top 20 circulating microbial features prioritized by random forest analysis ranked by the mean decrease in accuracy. (F) The Kaplan-Meier method with log rank test estimates the median RFS for patients with higher or lower abundance of the Methylophilaceae family.

References

    1. Siegel R.L., Miller K.D., Fuchs H.E., Jemal A. Cancer Statistics, 2021. CA. Cancer J. Clin. 2021;71:7–33. doi: 10.3322/caac.21654. - DOI - PubMed
    1. Chansky K., Detterbeck F.C., Nicholson A.G., Rusch V.W., Vallières E., Groome P., Kennedy C., Krasnik M., Peake M., Shemanski L., et al. The IASLC Lung Cancer Staging Project: External Validation of the Revision of the TNM Stage Groupings in the Eighth Edition of the TNM Classification of Lung Cancer. J. Thorac. Oncol. 2017;12:1109–1121. doi: 10.1016/j.jtho.2017.04.011. - DOI - PubMed
    1. Blandin Knight S., Crosbie P.A., Balata H., Chudziak J., Hussell T., Dive C. Progress and prospects of early detection in lung cancer. Open Biol. 2017;7 doi: 10.1098/rsob.170070. - DOI - PMC - PubMed
    1. National Lung Screening Trial Research Team. Church T.R., Black W.C., Aberle D.R., Berg C.D., Clingan K.L., Duan F., Fagerstrom R.M., Gareen I.F., Gierada D.S., et al. Results of initial low-dose computed tomographic screening for lung cancer. N. Engl. J. Med. 2013;368:1980–1991. doi: 10.1056/NEJMoa1209120. - DOI - PMC - PubMed
    1. National Lung Screening Trial Research Team. Aberle D.R., Adams A.M., Berg C.D., Black W.C., Clapp J.D., Fagerstrom R.M., Gareen I.F., Gatsonis C., Marcus P.M., Sicks J.D. Reduced lung-cancer mortality with low-dose computed tomographic screening. N. Engl. J. Med. 2011;365:395–409. doi: 10.1056/NEJMoa1102873. - DOI - PMC - PubMed