. 2024 Apr 16;5(4):101485.
doi: 10.1016/j.xcrm.2024.101485. Epub 2024 Apr 5.

Identification of cells of leukemic stem cell origin with non-canonical regenerative properties

Affiliations

Identification of cells of leukemic stem cell origin with non-canonical regenerative properties

Cameron G Hollands et al. Cell Rep Med. .

Abstract

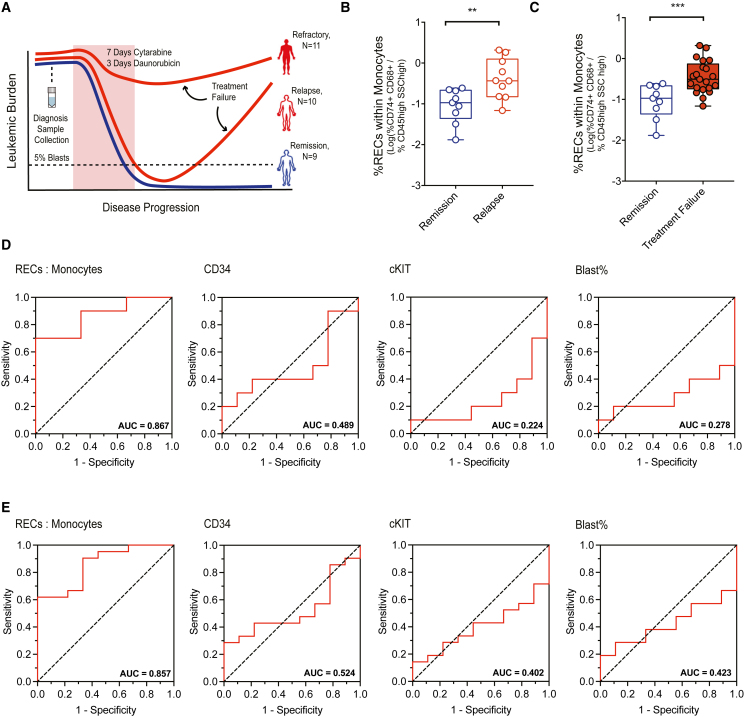
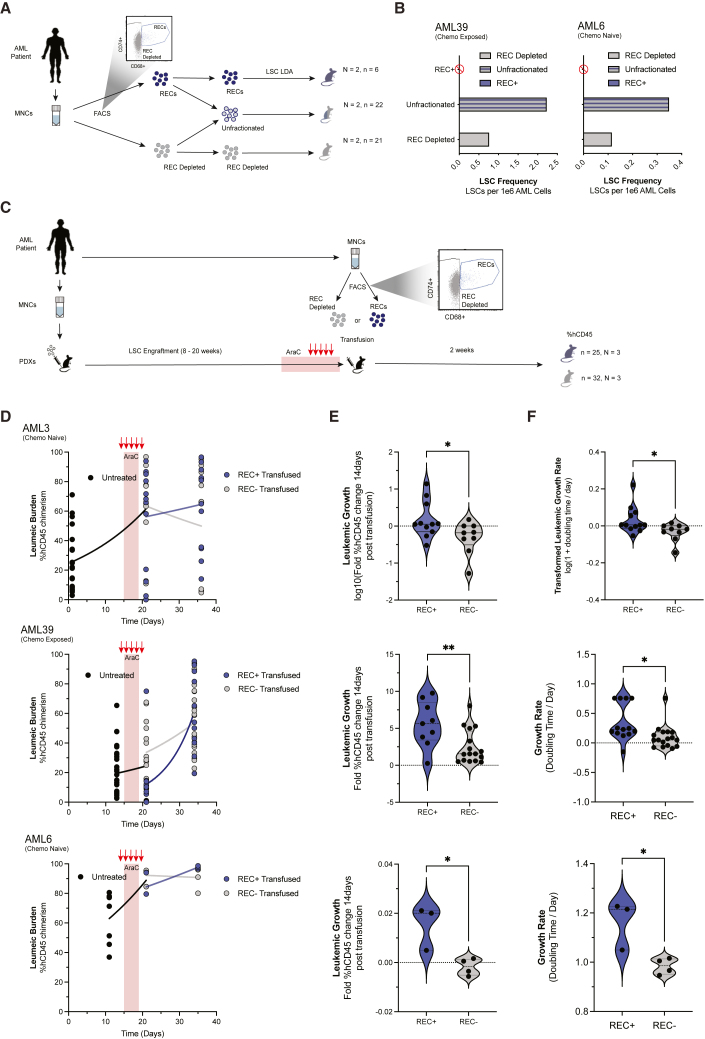
Despite most acute myeloid leukemia (AML) patients entering remission following chemotherapy, outcomes remain poor due to surviving leukemic cells that contribute to relapse. The nature of these enduring cells is poorly understood. Here, through temporal single-cell transcriptomic characterization of AML hierarchical regeneration in response to chemotherapy, we reveal a cell population: AML regeneration enriched cells (RECs). RECs are defined by CD74/CD68 expression, and although derived from leukemic stem cells (LSCs), are devoid of stem/progenitor capacity. Based on REC in situ proximity to CD34-expressing cells identified using spatial transcriptomics on AML patient bone marrow samples, RECs demonstrate the ability to augment or reduce leukemic regeneration in vivo based on transfusion or depletion, respectively. Furthermore, RECs are prognostic for patient survival as well as predictive of treatment failure in AML cohorts. Our study reveals RECs as a previously unknown functional catalyst of LSC-driven regeneration contributing to the non-canonical framework of AML regeneration.

Keywords: Regen71; acute myeloid leukemia; chemotherapy; injury; leukemia stem cells; non-canonical regeneration; regeneration enriched cells; relapse.


Conflict of interest statement

Declaration of interests The authors declare no competing interests.

Figures

None
Graphical abstract
Figure 1
Figure 1
scRNA-seq data on frequently sampled AML xenografts following cytarabine treatment identifies unique kinetics and defines both responding and non-responding PDXs (A) Disease burden (hCD45Chimerism ∗ Total Cells Harvested) represented by mean ± SD from PDXs at day 0 (“Untreated”) and at the lowest disease burden time point (“Cytoreduced”) normalized to Untreated AML1-6, sorted by ELN stratifications, clinical outcome, and responder status (N = 6, n = 31 untreated, n = 18 treated). (B) Experimental overview of data generating panels (C) and (D): De novo patient tissue and hCD45+ BM harvested from three patient-matched PDXs at each noted time point underwent scRNA-seq with cell multiplexing, immunophenotyping, functional assays, and cellularity assessments. UMAP plots of cells from all time points of AML1-3 PDXs organized by (C) transcriptionally defined cell cluster ID and by (D) time point. ∗∗∗∗p < 0.0001, ∗p < 0.05, ns p > 0.05 by unpaired t tests. See also Figure S1 and Table S1.
Figure 2
Figure 2
Cluster 5 and cluster 1 are most enriched at functionally defined biologically relevant time points in AML1 and AML2, respectively (A and B) Disease burden (Total cells harvested ∗ %hCD45; dark gray) and progenitor frequency (#colonies/cells seeded; light gray) during and following a 5-day AraC treatment in (A) AML1 PDXs and (B) AML2 PDXs, overlayed with UMAP plots of scRNA-seq data (n = 3 per time point per AML sample [AML1 pooled]) from the same cell pool that derived the functional progenitor frequency and disease burden data throughout the time course. (C and D) Bar graphs of the fold enrichment of each substantive cluster at untreated vs. regeneration time points for AML1 (n = 3, pooled) and AML2 (n = 3). Color of bars represents a metric of cytoreduction magnitude [Log10(Cluster% Untreated/Cluster% Cytoreduced)]. (E) Correlation plots between fold enrichment of clusters 1 and 5 at untreated vs. regeneration time point (Cluster% at Regeneration/Cluster% at Untreated) compared with fold increase of total AML cell burden at day 7 to day 14. (F) Bar graph of the correlation coefficient (R2 value) from linear regression analysis from (E) from all shared and substantive clusters. The linear regression reveals a correlation that is significantly non-zero (p > 0.01, light gray bars) or not significant (p > 0.05, dark gray bars). See also Figure S2, Tables S1 and S2.
Figure 3
Figure 3
REC gene expression demonstrates predictive capacity of AML patient survival, and RECs are defined by the CD74+/CD68+ immunophenotype (A) Patient-specific UMAP plots of all PDX and de novo cells from AML1 highlighting RECs from PDXs (dark red) from de novo tissue (dark blue). (B) The 71 shared DEGs that overlap between RECs of AML1-3. (C) Multivariate cox regression analysis on Regen71, ELN stratifications, age, and WBC count with overall and event-free survival of an independent AML cohort (TARGET-AML, N = 1,914). (D) Flow of narrowing down the Regen71 gene score to CD68 as a biomarker for RECs. (E) UMAP plots of cells from del(7) AML patients throughout treatment time course (N = 3) with CD68-enriched cluster 2 highlighted, grouped by cluster ID and clinical time point, respectively. (F) Bar plot of cluster composition of each time point of scRNA from (E). CD68+ cluster 2 highlighted in red emerged post chemotherapy. (G) UMAP plots of de novo AML38 cells at diagnosis and when refractory to treatment with CD68-enriched cluster 6 highlighted, grouped by cluster ID and treatment time point, respectively. (H) Bar plot of cluster composition of each time point of scRNA from (G). CD68+ cluster 6 highlighted in red emerged post chemotherapy. (I) UMAP plots of de novo REC cluster 0′ colored by tissue source (healthy BM: n = 1,123, AML sample: n = 2,696) and of PDX REC clusters 1 and 5 colored by tissue source (CB xenograft: n = 2,305, AML PDX: n = 9,403). (J) Logic flow of narrowing down the shared DEG from (G) to CD74 as a biomarker for leukemia-specific RECs. (K) LogCD74 expression by RNA-seq represented by mean ± SD of AML patients (N = 542) compared with healthy BM cells (N = 73) from leukemia MILE study (∗∗∗p < 0.001, Student’s t test), and CD74 expression by FC on AML patients (N = 2) compared with healthy BM donations (N = 2). See also Figure S3, Tables S1 and S2.
Figure 4
Figure 4
RECs demonstrate clinical potential (A) Visual representation of experimental design (N = 30). (B) Boxplots of %CD74/CD68 population relative to monocytic population (CD45highSSChigh) of patients who entered remission (N = 9) compared with patients who relapsed after remission (N = 10). (C) The %CD74/CD68 population relative to monocytic population (CD45highSSChigh) of patients who entered remission (N = 9) compared with patients who experienced either form of treatment failure (relapse or refractory, N = 21). ROC curves comparing the predictive capacity of (D) relapse and (E) treatment failure of %CD74/CD68:Monocytes ratio, CD34, cKit, and blast%. The greatest AUC value for both clinical outcomes was %CD74/CD68:Monocytes. (B) and (C) ∗∗∗p < 0.001, ∗∗p < 0.01 by unpaired Student’s t tests. See also Figure S4 and Table S1.
Figure 5
Figure 5
RECs demonstrate no stemness capacity and co-localize to CD34+ cells within leukemic tissue (A) Representative flow plot of hCD45 and CD33 expression in BM aspirates from PDXs 8 weeks post intra-femoral injection with RECs (n = 11, N = 3). (B) Bar graph of mean ± SD of CFU frequency (#colonies/cells seeded) of FACS-purified CD74+/CD68+ cells and bulk AML patient MNCs normalized to average AML patient MNCs. (C) Bar graph of leukemic mutation VAF of FACS-purified CD74+/CD68+ cells compared with control MNCs. (D) Whole H&E-stained tissue and representative images with and without spot overlays of BM tissue from AML patient 11 and BM donor 4. Scale bar, 100 μM. (E) Spots of CD74+/CD68+/CD34+ co-expression overlayed onto whole tissue section of AML BM11, and four representative images each from areas with and without CD74+/CD68+/CD34+ co-expression. Scale bars, 50 μM. (F) Xenograft BM sections of engrafted CB and AML, with hCD74 hCD68 hCD34 immunofluorescent labels by MIBI-TOF methodology. Examples of CD74+/CD68+ cells and CD34+ are highlighted in white. (G) Bar graph of the mean +/- SD distance between CD74+/CD68+ and CD34+ cells in the AML vs. CB xenograft BM (∗∗∗∗p < 0.0001, Student’s t test). See also Figure S5, Table S1.
Figure 6
Figure 6
RECs catalyze leukemic regeneration by supporting LSCs (A) Experimental visual of REC loss of function limiting dilution analysis experiment. (B) Bar graph of estimated AML LSC frequency when RECs are depleted, present, and isolated (N = 2). (C) Experimental visual of REC gain-of-function transfusion experiment. (D) Growth of AML grafts before, during, and after REC or control transfusion (N = 3) AML growth is greater in PDXs that received REC transfusions as compared with control conditions calculated by (E) change in chimerism from transfusion time point to readout time point (13–16 days) and by (F) growth rate (doubling time per day) calculated by exponential growth fits (N = 3, Student’s t test, ∗∗p < 0.01, ∗p < 0.05). See also Figure S6, Table S1.

References

    1. Döhner H., Estey E., Grimwade D., Amadori S., Appelbaum F.R., Büchner T., Dombret H., Ebert B.L., Fenaux P., Larson R.A., et al. Diagnosis and management of AML in adults: 2017 ELN recommendations from an international expert panel. Blood. 2017;129:424–447. doi: 10.1182/blood-2016-08-733196. - DOI - PMC - PubMed
    1. Döhner H., Wei A.H., Appelbaum F.R., Craddock C., DiNardo C.D., Dombret H., Ebert B.L., Fenaux P., Godley L.A., Hasserjian R.P., et al. Diagnosis and management of AML in adults: 2022 recommendations from an international expert panel on behalf of the ELN. Blood. 2022;140:1345–1377. doi: 10.1182/blood.2022016867. - DOI - PubMed
    1. Tallman M.S., Gilliland D.G., Rowe J.M. Drug therapy for acute myeloid leukemia. Drug Ther. 2005;106:1154–1163. doi: 10.1182/blood-2005-01-0178. - DOI - PubMed
    1. Döhner H., Weisdorf D.J., Bloomfield C.D. Acute myeloid leukemia. N. Engl. J. Med. 2015;373:1136–1152. doi: 10.1056/NEJMra1406184. - DOI - PubMed
    1. Estey E., Döhner H. Acute myeloid leukaemia. Lancet. 2006;368:1894–1907. doi: 10.1016/S0140-6736(18)31041-9. - DOI - PubMed