. 2024 Apr 6;15(1):2989.
doi: 10.1038/s41467-024-47297-2.

Gadd45g insufficiency drives the pathogenesis of myeloproliferative neoplasms

Affiliations

Gadd45g insufficiency drives the pathogenesis of myeloproliferative neoplasms

Peiwen Zhang et al. Nat Commun. .

Abstract

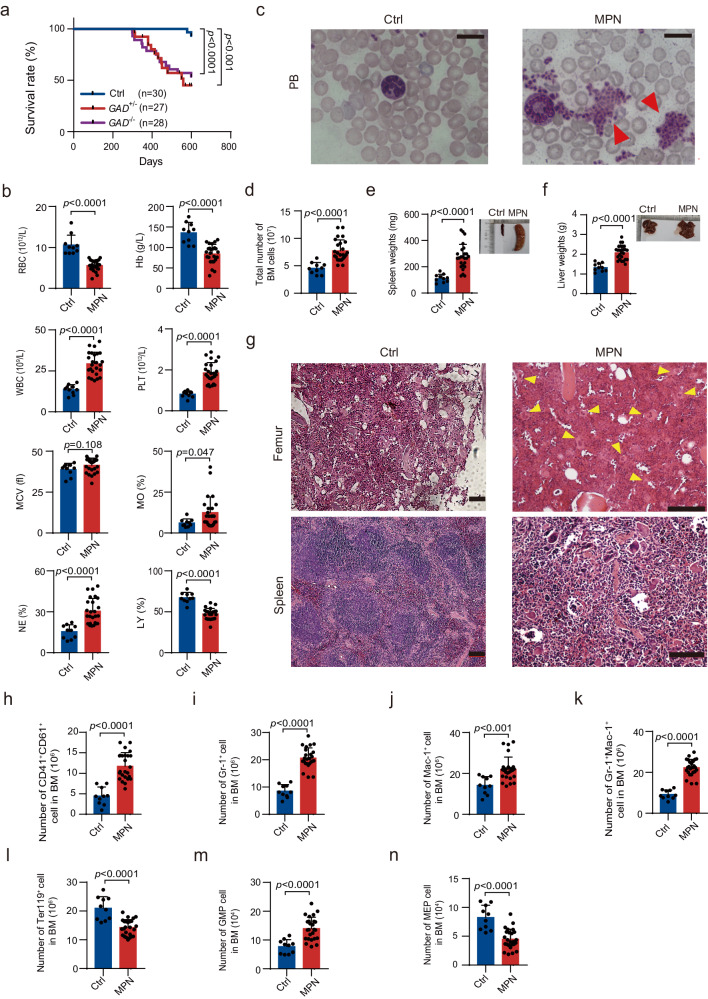
Despite the identification of driver mutations leading to the initiation of myeloproliferative neoplasms (MPNs), the molecular pathogenesis of MPNs remains incompletely understood. Here, we demonstrate that growth arrest and DNA damage inducible gamma (GADD45g) is expressed at significantly lower levels in patients with MPNs, and JAK2V617F mutation and histone deacetylation contribute to its reduced expression. Downregulation of GADD45g plays a tumor-promoting role in human MPN cells. Gadd45g insufficiency in the murine hematopoietic system alone leads to significantly enhanced growth and self-renewal capacity of myeloid-biased hematopoietic stem cells, and the development of phenotypes resembling MPNs. Mechanistically, the pathogenic role of GADD45g insufficiency is mediated through a cascade of activations of RAC2, PAK1 and PI3K-AKT signaling pathways. These data characterize GADD45g deficiency as a novel pathogenic factor in MPNs.


Conflict of interest statement

The authors declare no competing interests.

Figures

Fig. 1
Fig. 1. Reduced expression of GADD45g in human MPNs cells exhibits tumor-promoting functions.
a Relative expression of GADD45g mRNA in primary CD34+ cells from patients with ET (n = 5) and PV (n = 5) compared with those from human cord blood (CB) (n = 7), as determined by qRT-PCR. b Relative expression of GADD45g mRNA in primary BMMNCs from patients with ET (n = 14) and PV (n = 13) compared with those from healthy donors (n = 16), as determined by qRT-PCR. c Western blot analysis of GADD45g protein levels in primary BMMNCs from patients with ET, PV and healthy donors (n = 5-6 donors in each group). d GADD45g expression in CD34+ cells from patients with PV (n = 10) and PMF (n = 32) in comparison to those from healthy volunteers (n = 16) (GSE53482). e Comparison of colony formation potential between primary BM CD34+ cells from GADD45ghigh and those from GADD45glow patients with MPN (n = 5 per group). f Relative expression of GADD45g mRNA in HEL and SET-2 cells transfected with 2 different GADD45g-specific shRNAs (shGAD1 and shGAD2). A scrambled shRNA was used as a control (shCtrl). g Western blot showing GADD45g-protein levels in HEL and SET-2 cells after knockdown using shGAD1 and shGAD2. Blots are representative of three independent experiments. h–k Effects of GADD45g knockdown on colony formation (h), proliferation (i), apoptosis (j) and cell cycle (k) of HEL and SET-2 cells. For (f and h–k) Figures shown are representative of three independent experiments with similar results. Data are shown as mean ± SD (n = 3 technical replicates). Comparisons were evaluated by two-tailed Student’s t test, and multiple groups were analyzed with one-way ANOVA.
Fig. 2
Fig. 2. Gadd45g deficiency leads to aberrations of hematological parameters and enhanced self-renewal capacities of HSCs in mice aged 4–6 months.
a Percentage of donor chimerism in the PB of lethally irradiated primary recipients transplanted with LT-HSCs freshly isolated from 4-month-old Gadd45g+/− (GAD+/−) (n = 4), Gadd45g−/− (n = 4) and Ctrl (n = 5) mice together with competitor cells (top). Donor chimerism in the PB of secondary recipients transplanted with CD45.2+ LT-HSCs from primary recipient mice together with competitor cells (bottom). b–g Total number of BM cells (b), and absolute numbers of Gr-1+, Mac-1+ and Gr-1+Mac-1+ cells (c), B220+ and CD3+ cells (d), Ter119+ cells (e), CMP, GMP, MEP cells (f), and CLP cells (g) in the BM of 6-month-old Gadd45g+/−, Gadd45g−/− and Ctrl mice (n = 5 mice per group). h Representative images of spleens and spleen weights of 6-month-old Gadd45g+/−, Gadd45g−/− and Ctrl mice (n = 5 mice per group). i, j Absolute numbers of HSCs in the BM (i) and spleen (j) of 6-month-old Gadd45g+/−, Gadd45g−/− and Ctrl mice (n = 5 mice per group). k Numbers of My-biased HSCs and Ly-biased HSCs in the BM from 6-month-old Gadd45g+/−, Gadd45g−/− and Ctrl mice (n = 5 mice per group), and from the moribund mice with MPN (n = 25) and Ctrl (n = 10) group (bottom). Representative flow cytometry plots were shown on the top. l Absolute numbers of MPP2, MPP3 and MPP4 in the BM of 6-month-old Gadd45g+/−, Gadd45g−/− and Ctrl mice (n = 5 mice per group). m–o Apoptosis (m), proliferation (n) and cell-cycle (o) analysis of My-biased HSCs in the BM from 6-month-old Gadd45g+/−, Gadd45g−/− and Ctrl mice (n = 4 mice per group). p Percentages of donor-derived overall (CD45.2+) cells in the PB of primary recipients transplanted with My-biased HSCs from 6-month-old Gadd45g+/ (n = 4), Gadd45g−/− (n = 4) and Ctrl (n = 5) mice together with competitor cells (top), and chimerism in the PB of secondary recipients transplanted with CD45.2+ My-biased HSCs from primary recipients together with competitor cells (bottom). q Percentages of donor chimerism in the PB of primary recipients transplanted with My-biased HSCs from 8-month-old Gadd45g+/−, Gadd45g−/− and Ctrl mice together with competitor cells (left), and in the PB of secondary recipients transplanted with CD45.2+ My-biased HSCs from primary recipients together with competitor cells (right). (n = 5 mice per group). For (a–q): Data are shown as means ± SD, two-tailed Student’s t-test.
Fig. 3
Fig. 3. Gadd45g deletions induce MPN in mice after 10 months of age.
a Kaplan-Meier survival curves of Gadd45g+/−, Gadd45g−/− and Ctrl mice (n = 27-30 mice per group, log-rank test). b Counts of RBC, hemoglobin, WBC, platelet, and MCV, and percentages of monocytes, neutrophils and lymphocytes in the PB of moribund Gadd45g-insufficient mice with MPN (n = 25) and Ctrl mice (n = 10). c Wright-Giemsa staining of PB smears prepared from Ctrl and mice with MPN. Red arrowheads indicate abundant platelets. Bar represents 50 μm. At least three independent biological replicates were performed. d Total number of BM cells in moribund mice with MPN (n = 25) and Ctrl mice (n = 10). e Spleen weights and representative images of spleens of moribund mice with MPN (n = 25) and Ctrl mice (n = 10). f Liver weights and representative images of livers of moribund mice with MPN (n = 25) and Ctrl mice (n = 10). g H&E staining of femur (top) and spleen (bottom) sections from Ctrl and moribund mice with MPN. Yellow arrowheads indicate megakaryocytes. Bars represent 100 μm. At least three independent biological replicates were performed. h–n Absolute number of CD41+CD61+ (h), Gr-1+(i), Mac-1+(j), Gr-1+Mac-1+ (k), Ter119+ (l), GMP (m), MEP (n) cells in the BM of moribund mice with MPN (n = 25) and Ctrl mice (n = 10). For (b, d–f, h–n): Data are shown as means ± SD. Two-tailed Student’s t test.
Fig. 4
Fig. 4. Gadd45g deficiency-induced MPN is transplantable and reintroduction of Gadd45g prominently prolongs the survival of mice with MPN.
a–j One million whole BM cells from the Ctrl mice or moribund mice with MPN (CD45.2) were transplanted into lethally irradiated recipients (CD45.1) (5 recipients per group). The hematological parameters were examined when the recipient mice required euthanasia because of moribund conditions. Kaplan-Meier survival curves of the recipient mice (log-rank test) (a). Percentages of donor-derived overall (CD45.2+) and those of myeloid (Mac-1+), B (B220+), and T (CD3+) cells in CD45.2+ PB of recipients (b). Representative images of spleens from recipient mice (left) and spleen weights of recipient mice (right) (c). H&E staining of femur (top) and spleen (bottom) sections from recipient mice. Bars represent 100 μm. At least three independent biological replicates were performed (d). Absolute number of Gr-1+ (e), Mac-1+ (f), Gr-1+Mac-1+ (g), B220+ (h), CD3+ (i) and Ter119+ (j) cells in the BM (left) and spleen (right) of recipient mice. (k) Lin-c-kit+ HSPCs isolated from moribund mice with MPN were transfected with Dox-inducible Gadd45g lentiviral vector and then transplanted into lethally irradiated recipient mice (104 cells per mouse). Dox (1 mg/mL) was added to drinking water 7 days after transplantation for 1 week to induce Gadd45g expression. Kaplan-Meier survival curves of recipient mice in different groups were shown (n = 6 mice per group, log-rank test). For (b, c, e–j): Data are shown as means ± SD. Two-tailed Student’s t test.
Fig. 5
Fig. 5. Gadd45g deficiency induces activation of PI3K-AKT pathway.
a RNA-seq analysis were performed on c-kit+ BM cells from Gadd45g+/− mice with MPN and those from Ctrl mice. A total of 7098 (3665 upregulated and 3433 downregulated) were differentially expressed in Gadd45g+/− mice with MPN. Volcano plot of normalized gene expression in moribund mice with MPN was shown. b KEGG enrichment analysis of the RNA-seq data indicating the activation of PI3K-AKT signaling pathway in Gadd45g-defficient cells from mice with MPN. c GSEA plot showing positive enrichment of AKT signaling in Gadd45g-defficient cells from moribund mice with MPN. The normalized enrichment score (NES) and P value were shown. d Western blot analysis of p-PI3K and total PI3K protein levels in c-kit+ BM cells from Gadd45g+/− mice with MPN and Ctrl mice. e Western blot analysis of pAKT-Ser473 and total AKT protein levels in c-kit+ BM cells from Gadd45g+/− mice with MPN and Ctrl mice. f Western blot analysis of p-PI3K and total PI3K protein expression in HEL and SET-2 cells with or without GADD45g knockdown. g Western blot analysis of pAKT-Ser473 and total AKT protein expression in HEL and SET-2 cells with or without GADD45g knockdown. For (b, c): Two-tailed Student’s t test, no adjustment was made for multiple comparisons. For (d–g): At least three independent experiments were performed.
Fig. 6
Fig. 6. Inhibition of PI3K-AKT pathway eliminates the tumor-promoting effects of Gadd45g deficiency in MPN.
a–h Two-month-old Gadd45g+/− and Ctrl mice were orally administered with vehicle or MK-2206 at 100 mg/kg 3 times a week for 2 months, followed by once a week for another 2 months (No overt toxicity was observed at these doses and schedule). Kaplan-Meier survival curves of mice in each group (n =  10 mice per group, log-rank test) (a). Counts of WBC in the PB of mice in each group (n =  5 mice per group) (b). Representative images of spleens (left) and spleen weights (right) of mice in each group (n =  5 mice per group) (c). Absolute number of Gr-1+ cells (d), Mac-1+ cells (e), Gr-1+Mac-1+ cells (f), GMP cells (g), and My-biased HSCs (h) in the BM of mice in each group (n =  5 mice per group). i Effects of MK-2206 treatment (10 μM for 14 days) on colony formation of GADD45g knocked down HEL and SET-2 cells. j–k HEL and SET-2 cells with or without GADD45g knockdown were incubated with MK-2206 (10 μM) or DMSO as control for 72 h. Effects of MK-2206 treatment on proliferation (j) and apoptosis (k) of these cells. l Effects of MK-2206 treatment (10 μM for 14 days) on colony formation of primary BM CD34+ cells from GADD45ghigh and GADD45glow patients with MPN (n = 3 patients per group). For (i–k) Figures shown are representative of three independent experiments with similar results. Data are shown as mean ± SD (n = 3 technical replicates). Comparisons were evaluated by two-tailed Student’s t test, and multiple groups were analyzed with one-way ANOVA.
Fig. 7
Fig. 7. RAC2-PAK1 pathway mediates the Gadd45g insufficiency-induced activation of PI3K-AKT.
a c-kit+ BM cells from diseased Gadd45g+/ and Ctrl mice were lysed, precipitated with anti-GADD45g antibody, and detected by Western blot with anti-RAC2 and -GADD45g antibodies. b Representative immunofluorescence micrographs showing colocalization of GADD45g with RAC2 in c-kit+ BM cells of Ctrl mice. Panels represent nucleus (blue), GADD45g (green), RAC2 (yellow), and merged images, respectively. Arrows in merged image indicate colocalization of GADD45g with RAC2. Bar represents 10 μm. c Representative immunofluorescence micrographs showing cellular distribution of GADD45g, RAC2 and RAC1 in cord blood CD34+ cells from healthy human donors. Panels represent nucleus (blue), GADD45g (green), RAC2 (orange), RAC1 (pink), and merged images, respectively. Arrows in merged image indicate colocalization of GADD45g with RAC2. Bar represents 5 μm. d Western blot analysis of RAC2-GTP and total RAC2 protein levels in c-kit+ BM cells from diseased Gadd45g+/− and Ctrl mice. e HEL and SET-2 cells transfected with GADD45g-specific shRNA or shCtrl were lysed, precipitated with anti-GADD45g antibody, and detected by Western blot with anti-RAC2 and -GADD45g antibodies. f Western blot analysis of RAC2-GTP and total RAC2 protein levels in HEL and SET-2 cells transfected with GADD45g-specific shRNA or shCtrl. g Western blot analysis of p-PAK1 and total PAK1 protein levels in c-kit+ BM cells from diseased Gadd45g+/ and Ctrl mice. h Western blot analysis of p-PAK1 and total PAK1 protein levels in HEL and SET-2 cells transfected with GADD45g-specific shRNA or shCtrl. i HEL and SET-2 cells were transfected with GADD45g-specific shRNA or shCtrl for 48 h, followed by transfection with RAC2-specific shRNA (shRAC2) or scrambled control (Scr) for another 48 h. The protein levels of p-PAK1, total PAK1, p-PI3K, total PI3K, pAKT-Ser473 and total AKT were examined by Western blot. j HEL and SET-2 cells were transfected with GADD45g-specific shRNA or shCtrl for 48 h, followed by treatment with vehicle or IPA-3 (10 μM for 48 h). The protein levels of p-PI3K, total PI3K, pAKT-Ser473 and total AKT were examined by Western blot. For (a–j): At least three independent experiments with similar results were performed.
Fig. 8
Fig. 8. Inhibition of RAC2 or PAK1 reverses the tumor-promoting effects of GADD45g deficiency in human MPN cells.
a, b HEL and SET-2 cells were transfected with GADD45g-specific shRNA or shCtrl for 48 h, followed by transfection with RAC2-specific shRNA (shRAC2) or scrambled control (Scr) for another 48 h. Effects of RAC2 knockdown on colony formation (a) and apoptosis (b) of these cells. (c) HEL and SET-2 cells were transfected with GADD45g-specific shRNA or shCtrl for 48 h. Cells were then plated in methylcellulose containing IPA-3 (10 μM). Colonies were counted and analyzed on day 14. d HEL and SET-2 cells were transfected with GADD45g-specific shRNA or shCtrl for 48 h, followed by treatment with vehicle or IPA-3 (10 μM) for 48 h, and the percentage of apoptosis cells was examined. e Effects of EHT 1864 treatment (5 μM for 10–14 days) on colony formation of primary BM CD34+ cells from GADD45ghigh and GADD45glow patients with MPN (n = 3 per group). f Effects of IPA-3 treatment (10 μM for 10–14 days) on colony formation of primary BM CD34+ cells from GADD45ghigh and GADD45glow patients with MPN (n = 3 per group). For (ad): Figures shown are representative of three independent experiments with similar results. Data are shown as mean ± SD (n = 3 technical replicates). Comparisons were evaluated by two-tailed Student’s t test, and multiple groups were analyzed with one-way ANOVA.
Fig. 9
Fig. 9. Aberrant production of inflammatory cytokines caused by Gadd45g deficiency.
a Serum concentrations of IL-1β, IL-2, IL-4, IL-6, IL-10, IL-12 p70, IL-17A, CCL2, CCL3, G-CSF, GM-CSF, PDGF-AA, IFN-γ and S100a9 in the Gadd45g+/− mice with MPN and their age-matched controls (n =  3 mice per group). b Comparisons of serum concentrations of IL-4 and IL-6 between GADD45ghigh (n = 5) and GADD45glow (n = 4) patients with MPN. Data are shown as means ± SD, two-tailed Student’s t test.
Fig. 10
Fig. 10. The expression of GADD45g is repressed by JAK2V617F mutation and histone deacetylation, and GADD45g reduction plays a tumor-promoting role in JAK2V617F MPN.
a qRT-PCR analysis of GADD45g expression in BMMNCs from patients with PV treated with 50 nM ruxolitinib (Rux) or vehicle for 24 h (n = 5). b Western blot analysis of JAK2, p-JAK2 and GADD45g protein levels in 293T cells transduced with lentiviruses expressing JAK2V617F, wild-type JAK2 or empty vector constructs. Blots shown are representative of three independent experiments. c HEL92.1.7-Luc cells were transfected with Dox-inducible GADD45g-specific shRNA and engrafted into irradiated NSG mice. Bioluminescence imaging of representative mice was taken at day 10 post-transplantation (n = 3 mice per group). d The NSG mice were treated with either vehicle or Rux for 2 weeks (n = 20 mice per group). Bioluminescence imaging of representative mice from each group were taken (n = 3 mice per group). e qRT-PCR evaluation of GADD45g expression in hCD45-positive cells isolated from the BMMNCs of mice in each group (n = 3 mice per group). f, g Bioluminescence imaging of representative mice from the indicated groups were taken after 1 week of shRNA expression induced by Dox treatment (f). Kaplan-Meier survival curves of mice in each group were shown (n = 8–9 mice per group, log-rank test) (g). h–j MPN cell lines and BMMNCs from MPNs patients were treated with 2 μM Decitabine (DAC) for 96 h. qRT-PCR analysis of GADD45g expression in MPN cell lines (h) or BMMNCs from MPNs patients (n = 3 patients) (i). MS-PCR showing the methylated GADD45g alleles in MPN cell lines (M, methylated allele; U, unmethylated allele). Bands shown are representative of three independent experiments (j). k, l Correlations of the expression between GADD45g and HDAC1 (k) or HDAC2 (l) in CD34+ BMMCs/PBMCs from MPNs patients. (m) qRT-PCR evaluation of GADD45g expression in MPN cell lines treated with 3 nM Romidepsin (Romi) or DMSO for 48 h. n qRT-PCR analysis of GADD45g expression in BMMNCs from MPNs patients treated with 5 nM Romi or DMSO for 48 h (n = 3). o, p HEL (o) and SET-2 cells (p) were treated with 3 nM Romi or DMSO for 48 h, and then subjected to ChIP analysis. The enriched DNA which associated with the promoter region of GADD45g was quantified by qPCR. For (a, e, h, i, k, p): Data are shown as means ± SD, two-tailed Student’s t test. For (h, m, o, p): Figures shown are representative of three independent experiments with similar results. n = 3 technical replicates.

References

    1. Venney D, Mohd-Sarip A, Mills KI. The impact of epigenetic modifications in myeloid malignancies. Int. J. Mol. Sci. 2021;22:5013. doi: 10.3390/ijms22095013. - DOI - PMC - PubMed
    1. Nangalia J, Green AR. Myeloproliferative neoplasms: from origins to outcomes. Blood. 2017;130:2475–2483. doi: 10.1182/blood-2017-06-782037. - DOI - PubMed
    1. Grabek J, Straube J, Bywater M, Lane SW. MPN: the molecular drivers of disease initiation, progression and transformation and their effect on treatment. Cells. 2020;9:1901. doi: 10.3390/cells9081901. - DOI - PMC - PubMed
    1. Mead AJ, Mullally A. Myeloproliferative neoplasm stem cells. Blood. 2017;129:1607–1616. doi: 10.1182/blood-2016-10-696005. - DOI - PMC - PubMed
    1. Vainchenker W, Kralovics R. Genetic basis and molecular pathophysiology of classical myeloproliferative neoplasms. Blood. 2017;129:667–679. doi: 10.1182/blood-2016-10-695940. - DOI - PubMed