. 2024 Jun:84:101933.
doi: 10.1016/j.molmet.2024.101933. Epub 2024 Apr 6.

Mesenchymal-specific Alms1 knockout in mice recapitulates metabolic features of Alström syndrome

Affiliations

Mesenchymal-specific Alms1 knockout in mice recapitulates metabolic features of Alström syndrome

Eleanor J McKay et al. Mol Metab. 2024 Jun.

Abstract

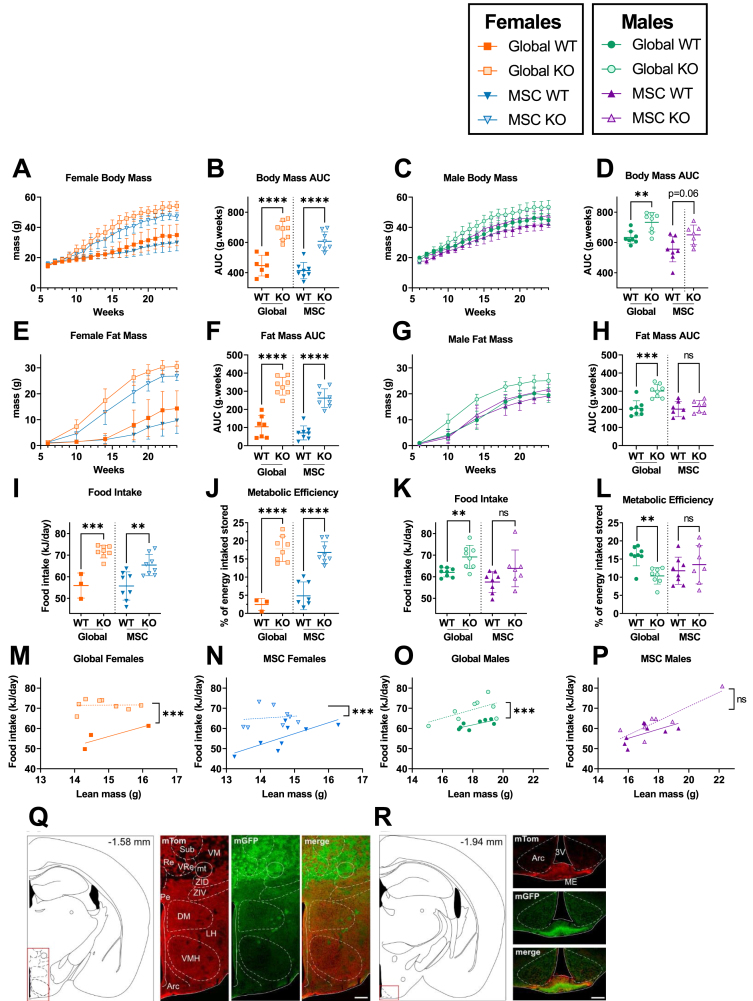
Objective: Alström Syndrome (AS), caused by biallelic ALMS1 mutations, includes obesity with disproportionately severe insulin resistant diabetes, dyslipidemia, and fatty liver. Prior studies suggest that hyperphagia is accounted for by loss of ALMS1 function in hypothalamic neurones, whereas disproportionate metabolic complications may be due to impaired adipose tissue expandability. We tested this by comparing the metabolic effects of global and mesenchymal stem cell (MSC)-specific Alms1 knockout.

Methods: Global Alms1 knockout (KO) mice were generated by crossing floxed Alms1 and CAG-Cre mice. A Pdgfrα-Cre driver was used to abrogate Alms1 function selectively in MSCs and their descendants, including preadipocytes. We combined metabolic phenotyping of global and Pdgfrα+ Alms1-KO mice on a 45% fat diet with measurements of body composition and food intake, and histological analysis of metabolic tissues.

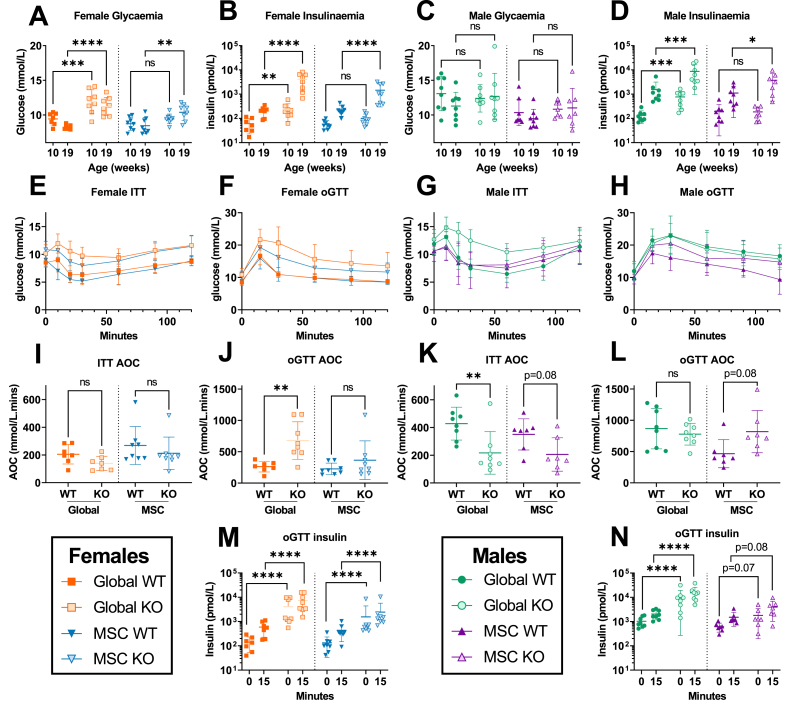
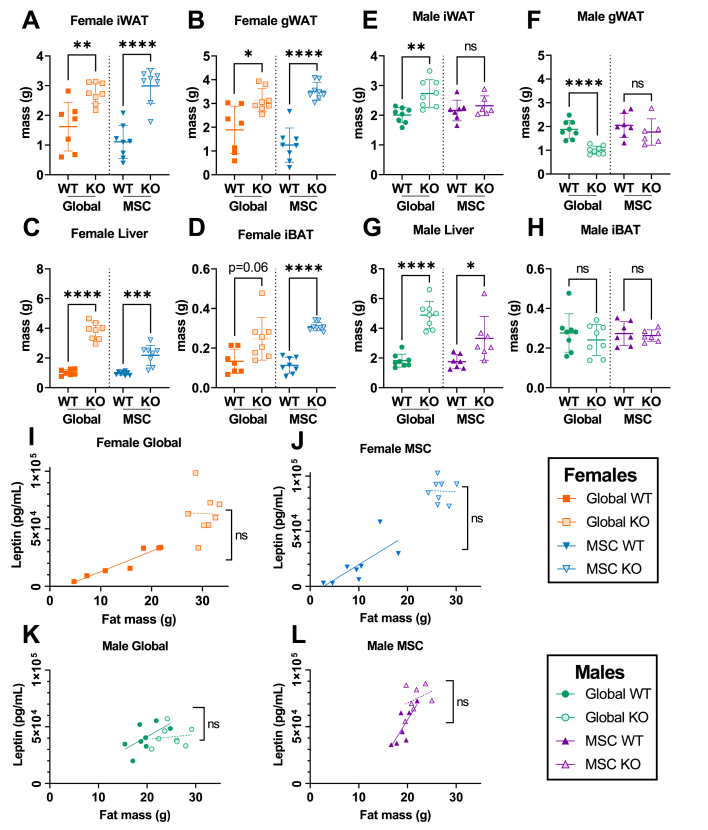
Results: Assessed on 45% fat diet to promote adipose expansion, global Alms1 KO caused hyperphagia, obesity, insulin resistance, dyslipidaemia, and fatty liver. Pdgfrα-cre driven KO of Alms1 (MSC KO) recapitulated insulin resistance, fatty liver, and dyslipidaemia in both sexes. Other phenotypes were sexually dimorphic: increased fat mass was only present in female Alms1 MSC KO mice. Hyperphagia was not evident in male Alms1 MSC KO mice, but was found in MSC KO females, despite no neuronal Pdgfrα expression.

Conclusions: Mesenchymal deletion of Alms1 recapitulates metabolic features of AS, including fatty liver. This confirms a key role for Alms1 in the adipose lineage, where its loss is sufficient to cause systemic metabolic effects and damage to remote organs. Hyperphagia in females may depend on Alms1 deficiency in oligodendrocyte precursor cells rather than neurones. AS should be regarded as a forme fruste of lipodystrophy.

Keywords: Adipose tissue; Alms1; Alström syndrome; Diabetes; Insulin resistance; Mouse.


Conflict of interest statement

Declaration of competing interest The authors declare the following financial interests/personal relationships which may be considered as potential competing interests: Robert Semple reports a relationship with AstraZeneca Pharmaceuticals LP that includes: consulting or advisory. Robert Semple reports a relationship with Amryt Pharmaceuticals Inc that includes: consulting or advisory. Robert Semple reports a relationship with Eli Lilly and Company that includes: speaking and lecture fees. Robert Semple reports a relationship with Novo Nordisk Inc that includes: speaking and lecture fees. Robert Semple reports a relationship with Novartis Pharma AG that includes: consulting or advisory. Lora Heisler reports a relationship with AstraZeneca Pharmaceuticals LP that includes: consulting or advisory. Co-author LKH is an editor for Molecular Metabolism If there are other authors, they declare that they have no known competing financial interests or personal relationships that could have appeared to influence the work reported in this paper.

Figures

Figure 1
Figure 1
Female, but not male, MSC-specific Alms1 knockout mice recapitulate the obesity and hyperphagia of global Alms1 knockout. Longitudinal analysis of body mass (A,C) and fat mass (E,G) assessed by td-NMR for female (A,E) and male (C,G) mice on high fat diet. (I–P) Food intake and metabolic efficiency of animals measured from 14 to 18 weeks of age. (M–P) Food intake plotted against lean mass at 14 weeks of age. Comparisons of global WT and KO and MSC WT and KO were performed with identical design at different times, reflected in the dotted line separating comparisons. Longitudinal series (A,C,E,G) plot mean ± sd for each time point. Data points in (B,D,F,H–P) represent individual animals with bars in (B,D,F,H–L) representing mean ± sd, and lines in linear regression graphs (M–P) representing lines of best fit. Comparison between WT and KO in (A–L) was performed using an unpaired two-tailed Student's t-test with Bonferroni correction. Comparison between lines of best fit was performed by simple linear regression, with square brackets showing comparison of y intercepts. No significant change was seen between gradients. ∗∗ denotes p < 0.01, ∗∗∗ denotes p < 0.001 and ∗∗∗∗ denotes p < 0.0001. For females N = 7, 8, 8 and 8 for global WT, global KO, MSC WT and MSC KO respectively, except in food intake studies when many global WT females shred the diet, resulting in N = 3. For males N = 8, 8, 7 and 7 for global WT, global KO, MSC WT and MSC KO respectively. AUC = area under curve. (Q,R) Illustration of coronal plane and representative microphotographs of brain sections from female Pdgfrα-Cre x mTom/mGFP mice showing expression of mTom, mGFP and merged images at bregma levels (Q) −1.58; (R) −1.94. Arc: arcuate hypothalamic nucleus; DM: dorsomedial hypothalamic nucleus; LH: Lateral hypothalamic area; mt: mammillothalamic tract; Pe: periventricular hypothalamic nucleus; Sub: supratrigeminal nucleus; VM: ventromedial thalamic nucleus; VRe: ventral reuniens thalamic nucleus; ZID: zona incerta, dorsal part; ZIV: zona incerta, ventral part; 3 V: Third ventricle. Scale bar 200 μm for Q and 100 μm for R.
Figure 2
Figure 2
Mesenchymal stem cell-specific Alms1 knockout recapitulate the insulin resistance of global Alms1 loss. (A–D) Daytime non-fasted blood glucose and insulin concentrations at 10 and 19 weeks of age. (E,G) Insulin tolerance tests (ITT) and (F,H) oral glucose tolerance tests (oGTT). Global WT/KO and MSC WT/KO experiments were performed with identical design at different times, reflected in the dotted line separating comparisons in (A–D, I–N). oGTT and ITT graphs (E–H) show mean ± sd for each time point. All other graphs (A–D, I–N) plot data points representing individual animals, with bars representing mean ± sd. Comparisons of log10 oGTT insulin values (B,D,M,N) and glucose concentration (A,C) were performed by two-way ANOVA with Šídák's multiple comparisons test. Comparison of all other data (I–L) used an unpaired two-tailed Student's t-test with Bonferroni correction. ∗ denotes p < 0.05, ∗∗ denotes p < 0.01, ∗∗∗ denotes p < 0.001 and ∗∗∗∗ denotes p < 0.0001. For females N = 7, 8, 8 and 8 for global WT, global KO, MSC WT and MSC KO respectively. For males N = 8, 8, 7 and 7 for global WT, global KO, MSC WT and MSC KO respectively. AOC = area of the curve; ns = not significant.
Figure 3
Figure 3
Mesenchymal stem cell-specific Alms1 knockout mice show hepatomegaly despite the absence of Cre-driven loss of Alms1 in hepatocytes, while fat pad mass is sexually dimorphic. (A–H) Mass of inguinal, and gonadal white adipose tissue (iWAT and gWAT respectively), liver and interscapular brown adipose tissue (iBAT) of male and female mice at 24 weeks of age. (I–L) Linear regression of serum leptin concentration and lean mass of male and female mice at 24 weeks of age. Each data point represents an individual animal, with bars in (A–H) representing mean ± sd lines and lines in (I–L) representing lines of best fit. Comparison between WT and KO groups in (A–H) used an unpaired two-tailed Student's t-test with Bonferroni correction. Comparison between lines of best fit in (I–L) was performed by simple linear regression, with square brackets showing comparison of y intercepts. No significant change was seen between gradients. ∗ denotes p < 0.05, ∗∗ denotes p < 0.01, ∗∗∗ denotes p < 0.001 and ∗∗∗∗ denotes p < 0.0001. For females N = 7, 8, 8 and 8 for global WT, global KO, MSC WT and MSC KO respectively. For males N = 8, 8, 7 and 7 for global WT, global KO, MSC WT and MSC KO respectively. ns = not significant.
Figure 4
Figure 4
Adipocyte hypertrophy and increased liver fat in both global and mesenchymal stem cell-specific Alms1 knockout mice at 24 weeks of age. Representative images of haematoxylin and eosin (H&E) stained liver and inguinal white adipose tissue (iWAT) sections from (A,C) female and (B,D) male mice. Scale bars 200 μm. Quantification of lipid content of liver (E,G) and interscapular brown adipose tissue (iBAT) (F,H) sections. (I,J,L,M) Size distribution of cross sectional area of adipocytes in iWAT, represented in bins of 1000 μm2 from comparisons of WT and global or conditional KO mice in separate experiments. (K,N) Total number of adipocytes in iWAT of each animal. Each data point in (E–H,K,N) represents an individual animal, with bars representing mean ± sd. Comparison between WT and KO in (E–H,K,N) used an unpaired two-tailed Student's t-test with Bonferroni correction. ∗ denotes p < 0.05, ∗∗ denotes p < 0.01 and ∗∗∗∗ denotes p < 0.0001. (E–H) For females N = 7, 8, 8 and 8 for global WT, global KO, MSC WT and MSC KO respectively. For males N = 8, 8, 7 and 7 for global WT, global KO, MSC WT and MSC KO respectively. (I–N) For females N = 5, 5, 8 and 8 for global WT, global KO, MSC WT and MSC KO respectively. For males N = 5, 6, 7 and 7 for global WT, global KO, MSC WT and MSC KO respectively. ns = not significant.

Update of

References

    1. Marshall J.D., Pietro M., Collin G.B., Naggert J.K. Alstrom syndrome: genetics and clinical overview. Curr Genom. Aug. 2012;12(3):225–235. doi: 10.2174/138920211795677912. - DOI - PMC - PubMed
    1. Knorz V.J., Spalluto C., Lessard M., Purvis T., Adigun F., Collin G., et al. Centriolar association of ALMS1 and likely centrosomal functions of the ALMS motif-containing proteins C10orf90 and KIAA1731. Mol Biol Cell. Nov. 2010;21(21):3617–3629. doi: 10.1091/mbc.E10-03-0246. - DOI - PMC - PubMed
    1. Collin G.B., Marshall J.D., King B.L., Milan G., Maffei P., Jagger D.J., et al. The Alström syndrome protein, ALMS1, interacts with α-actinin and components of the endosome recycling pathway. PLoS One. May 2012;7(5) doi: 10.1371/journal.pone.0037925. - DOI - PMC - PubMed
    1. Marshall J.D., Bronson R.T., Collin G.B., Nordstrom A.D., Maffei P., Paisey R.B., et al. New Alström syndrome phenotypes based on the evaluation of 182 cases. Arch Intern Med. 2005;165(6):675–683. doi: 10.1001/archinte.165.6.675. - DOI - PubMed
    1. Paisey R.B., Steeds R., Barrett T., Williams D., Geberhiwot T., Gunay-Aygun M. GeneReviews® [Internet] University of Washington; Seattle: 2019. Alström syndrome.

MeSH terms