. 2024 Aug;167(3):505-521.e19.
doi: 10.1053/j.gastro.2024.03.037. Epub 2024 Apr 6.

Impaired Glycosylation of Gastric Mucins Drives Gastric Tumorigenesis and Serves as a Novel Therapeutic Target

Affiliations

Impaired Glycosylation of Gastric Mucins Drives Gastric Tumorigenesis and Serves as a Novel Therapeutic Target

Junya Arai et al. Gastroenterology. 2024 Aug.

Abstract

Background & aims: Gastric cancer is often accompanied by a loss of mucin 6 (MUC6), but its pathogenic role in gastric carcinogenesis remains unclear.

Methods: Muc6 knockout (Muc6-/-) mice and Muc6-dsRED mice were newly generated. Tff1Cre, Golph3-/-, R26-Golgi-mCherry, Hes1flox/flox, Cosmcflox/flox, and A4gnt-/- mice were also used. Histology, DNA and RNA, proteins, and sugar chains were analyzed by whole-exon DNA sequence, RNA sequence, immunohistochemistry, lectin-binding assays, and liquid chromatography-mass spectrometry analysis. Gastric organoids and cell lines were used for in vitro assays and xenograft experiments.

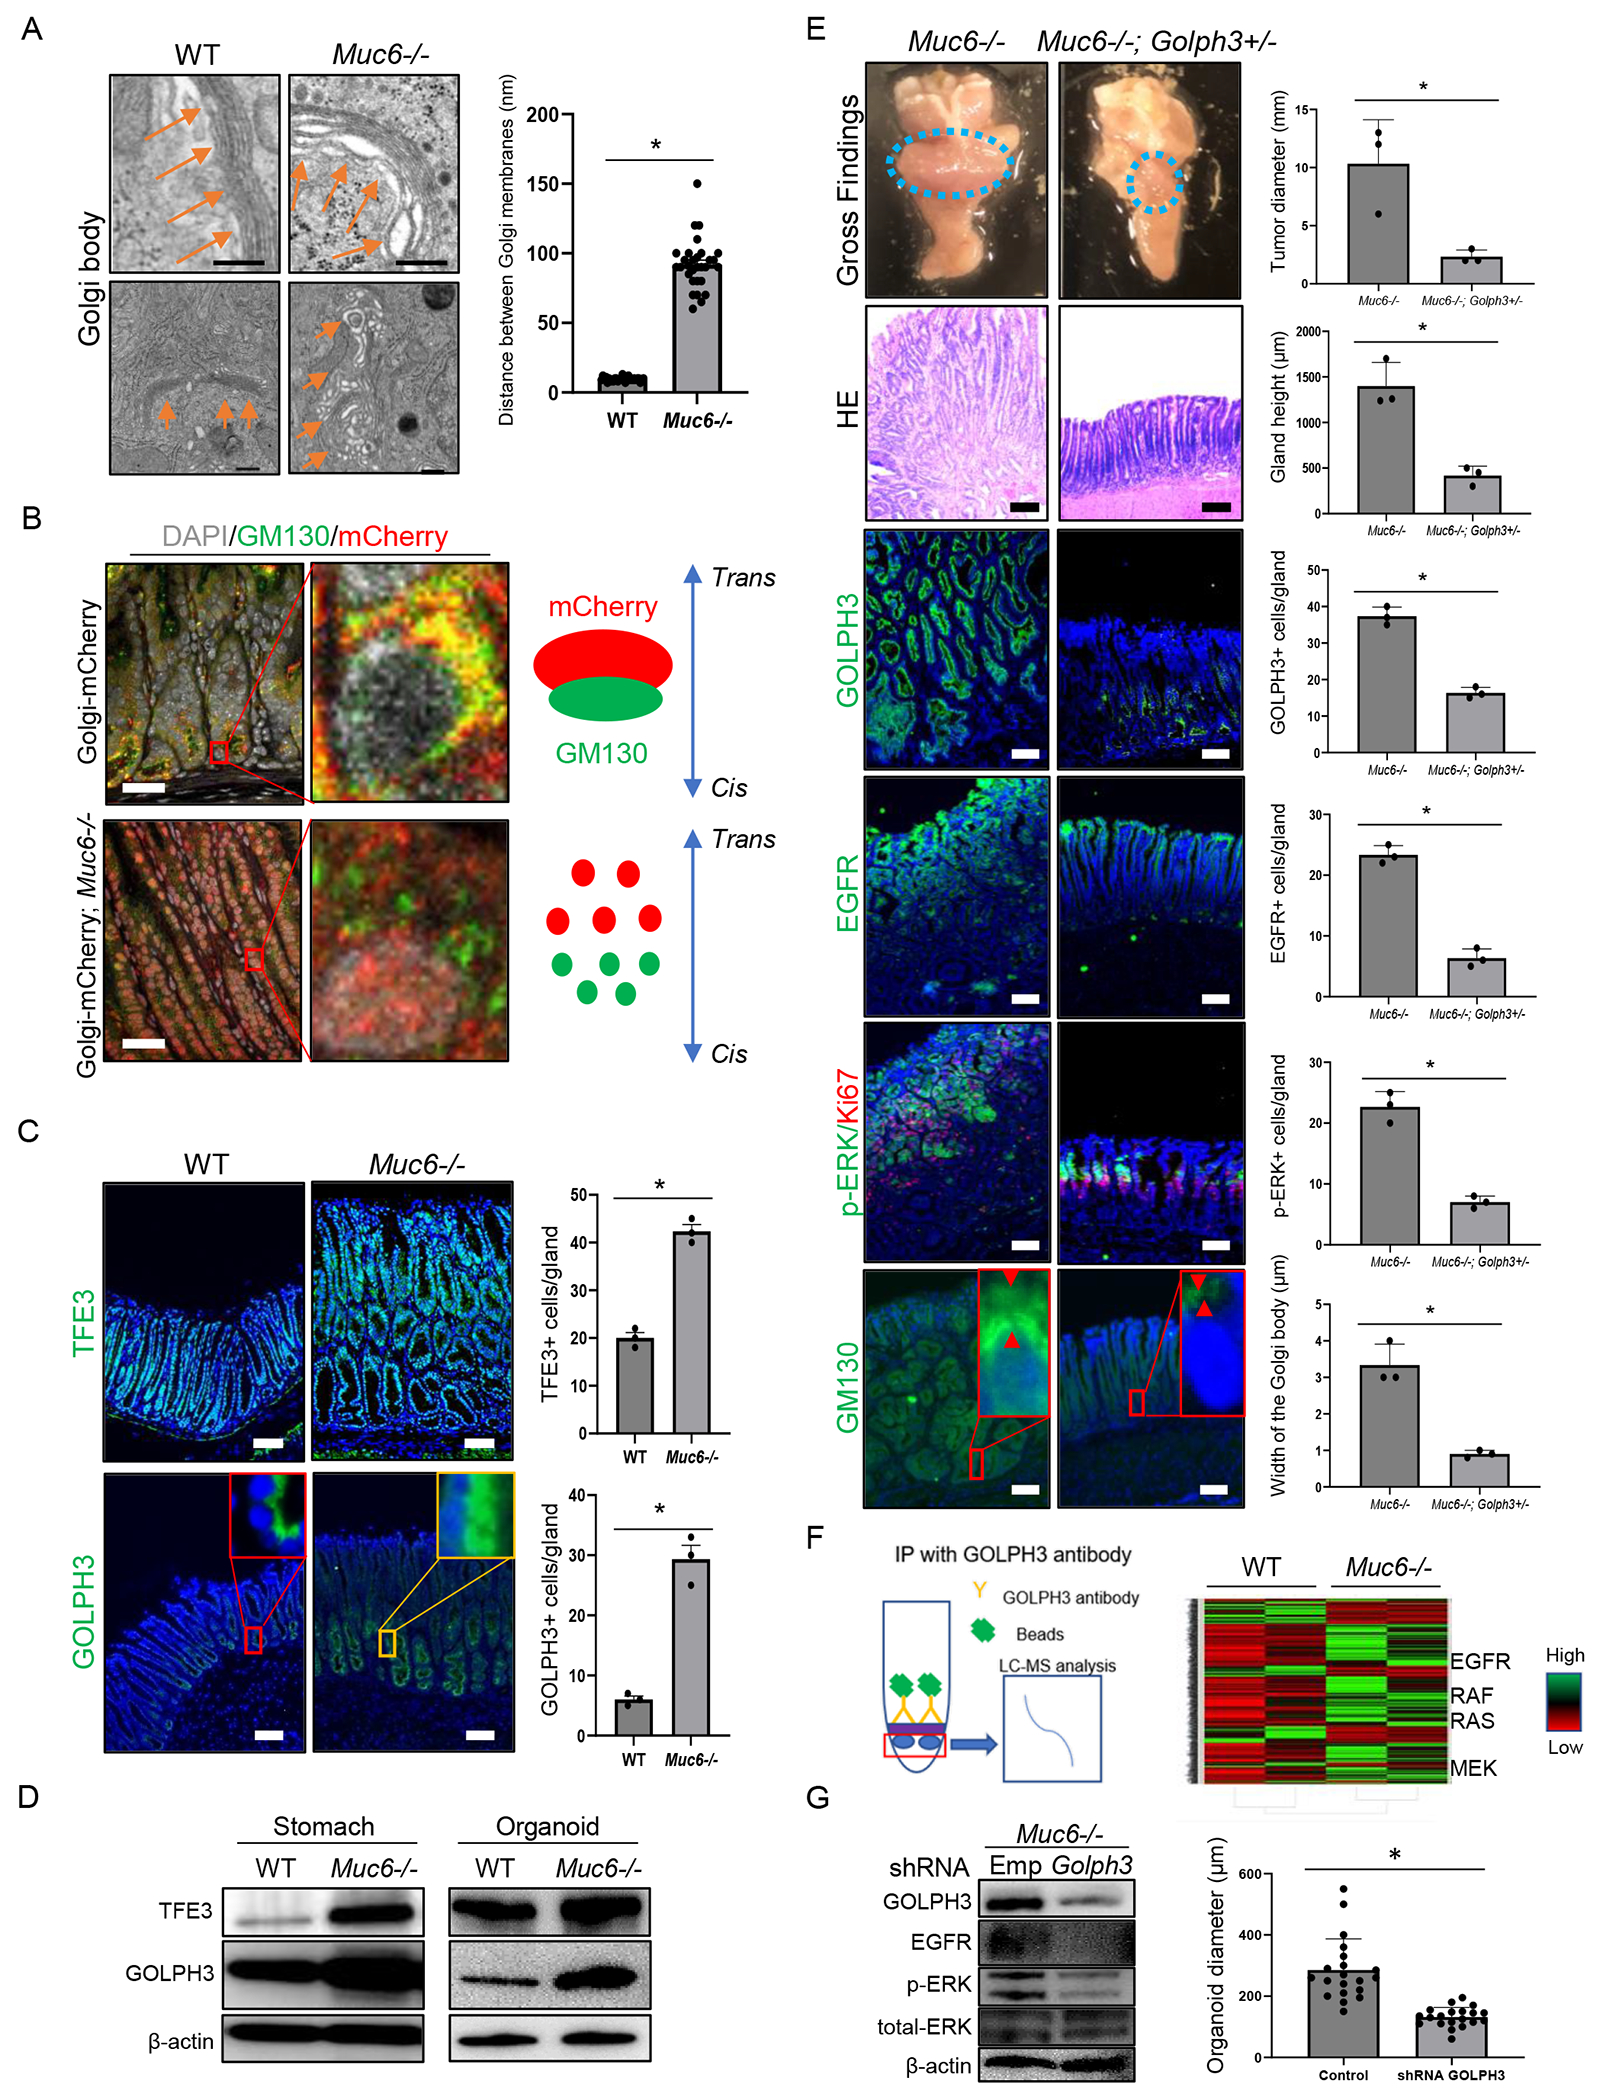
Results: Deletion of Muc6 in mice spontaneously causes pan-gastritis and invasive gastric cancers. Muc6-deficient tumor growth was dependent on mitogen-activated protein kinase activation, mediated by Golgi stress-induced up-regulation of Golgi phosphoprotein 3. Glycomic profiling revealed aberrant expression of mannose-rich N-linked glycans in gastric tumors, detected with banana lectin in association with lack of MUC6 expression. We identified a precursor of clusterin as a binding partner of mannose glycans. Mitogen-activated protein kinase activation, Golgi stress responses, and aberrant mannose expression are found in separate Cosmc- and A4gnt-deficient mouse models that lack normal O-glycosylation. Banana lectin-drug conjugates proved an effective treatment for mannose-rich murine and human gastric cancer.

Conclusions: We propose that Golgi stress responses and aberrant glycans are important drivers of and promising new therapeutic targets for gastric cancer.

Keywords: GOLPH3; Gastric Cancer; Golgi Stress; MAPK Pathway; Muc6.


Conflict of interest statement

Declaration of interests: The authors declare that they have no conflict of interest.

Figures

Figure 1.
Figure 1.. Muc6 deletion causes spontaneous gastric inflammation and tumors.
(A) dsRED staining in Muc6-dsRED mouse stomach. (B) GSII (green, left) and Ki67 (green, right) staining of the corpus and antrum of Muc6-dsRED mice. (C) Antral image of Lgr5-EGFP; Muc6-dsRED mice. (D) αGlcNAc staining in WT and Muc6−/− mouse stomach. (E) ISH with Muc6 (blue) and Gif (red) probes in WT and Muc6−/− mice. (F) Gross findings and HE staining in WT and Muc6−/− mice (representative from n≥5 at each time point). All analyzed Muc6−/− mice developed hyperplastic and dysplastic changes at younger age, and invasive cancer by 1-year old. (G) (Top) Ki67(red)/CD44v(green) (Bottom) TFF2(red)/GSII(green) staining (n=3 mice/group). (H) HE, MUC6, Ki67(red)/CD44v(green), and TFF2(red)/GSII(green) staining of human gastric cancer. Scale bars; 100 μm. Mean ± S.E.M. *P < .05.
Figure 2.
Figure 2.. RAS/MAPK pathway is the main oncogenic pathway in Muc6−/− mice.
(A-D) RNA sequence for comparing WT antrum and Muc6−/− antrum (n=3 mice/group). (A) PCA plot. (B) Heatmap showing the expression similarity between samples. The distance between samples is measured by calculating the SERE coefficient between each pair of samples. (C) Volcano plot. (D) GSEA shown as a bubble plot. (E). Western blotting for p-ERK, p-AKT, mTOR, HES1, and β-actin in WT and Muc6−/− mouse stomach. (F) EGFR, p-ERK, and HES1 staining (green) in WT and Muc6−/− mice (n=3 mice/group). (G) Muc6−/− mice were treated with the MEK inhibitor or vehicle control (n=3 mice/group). Gross findings, HE images, and Ki67 staining (green) are shown. (H-I) HE and Ki67(red)/HES1(green) staining in Muc6−/− and Muc6−/−; Tff1cre; Hes1 flox/flox mice (n=3 mice/group). (J-L) Treatment with an antibiotic combination (MNZ+VCM+NM and MNZ+VCM+NM+AMPC) in Muc6−/− mice. (J) Protocol. (K) Gross and HE images. (L) Tumor diameters and gland heights were quantified (n=3 vs. 4 vs. 4, respectively). (M) Gastric organoids generated from WT and Muc6−/− mice. (N) Organoid diameter of WT and Muc6−/− organoids at the indicated time points (n=20/group). (O) Western blotting of p-ERK, p-AKT, mTOR, HES1, and β-actin in WT and Muc6−/− organoids. (P) Organoid diameter after MEK inhibitor treatment of WT and Muc6−/− organoids (n=20/group). Scale bars; 100μm. Mean ± S.E.M. *P < .05.
Figure 3.
Figure 3.. Muc6 deletion triggers Golgi-stress responses, which promote tumor growth via GOLPH3-dependent MAPK activation in mice.
(A) TEM images of the Golgi apparatus in WT and Muc6−/− mice. The distance between Golgi membranes (n=30/group) was quantified. Scale bars represent 1μm. (B) mCherry (red: trans-Golgi) and GM130 (green; cis-Golgi) staining in R26-Golgi-mCherry and Muc6−/−; R26-Golgi-mCherry mice. (C) TFE3 and GOLPH3 staining in WT and Muc6−/− mice (n=3 mice/group). (D) Western blotting of TFE3 and GOLPH3 in WT and Muc6−/− mice and organoids. (E) Gross findings, HE, GOLPH3, EGFR, p-ERK(green)/Ki67(red), and GM130 staining in Muc6−/− and Muc6−/−; Golph3+/− mice (n=3 mice/group). (F) Immunoprecipitation with the GOLPH3 antibody was performed, and the binding proteins were identified by LC-MS analysis. Heatmap showing differentially expressed proteins in WT and Muc6−/− mice. (G) shRNA-Golph3 adenovirus treatment for Muc6−/− organoid. Western blotting for GOLPH3, EGFR, p-ERK, total-ERK, and β-actin, and organoid diameters are shown (n=20/group). Scale bars;100 μm. Mean ± S.E.M. *P < .05.
Figure 4.
Figure 4.. GOLPH3-MAPK axis is preserved in human MUC6-deficient GCs.
(A) NUGC4 cell lines were treated with MUC6 shRNA or control shRNA adenoviruses. Western blots for MUC6, GOLPH3, EGFR, p-ERK, total-ERK, and β-actin are shown. (B-E) AGS cells were treated with a GOLPH3-overexpression lentivirus and control lentivirus. (B) Western blotting for GOLPH3, p-ERK, total-ERK, and β-actin. (C) Cell proliferation assay. (n=5/group) (D) Staining for GM130 (red) and EGFR (green). The number of cells with Golgi fragmentation in the 4 visual fields/group was quantified. Scale bars; 5 μm. (E) Control and GOLPH3-overexpression lentivirus-treated AGS cells were implanted into nude mice as xenografts. Gross findings of the xenografts are shown, and xenograft weights and volumes were quantified (n=5/group). (F-H) MKN45 cells were transfected with GOLPH3 shRNA or a control adenovirus. (F) Western blotting of GOLPH3, EGFR, p-ERK, total-ERK, and β-actin. (G) Proliferation analysis (n=5/group). (H) Fluorescence images of the Golgi apparatus are shown. The number of the cells with golgi fragmentation for 4 visual fields/group are quantified. (I-L) RNA sequences of control and GOLPH3-shRNA adenovirus-treated MKN45 cells (n=3/group). (I) Shema of the experiment. (K) PCA plot. (K) Heatmap of associated genes. (L) GSEA comparing MKN45 cells treated with control and GOLPH3-shRNA adenovirus. (M) Monensin treatment of GES1 cells. Western blotting of GOLPH3, TFE3, and β-actin. (N) Scheme of the MUC6-mediated oncogenic pathway. Mean ± S.E.M. *P < .05.
Figure 5.
Figure 5.. Impaired O-linked glycosylation in the stomach results in aberrant mannosylated glycans that bind to clusterin precursor.
(A) Heatmap of mucin-associated gene expression based on RNA sequences of WT and Muc6−/− antrum (n=3 mice/group). (B) SEM images of mucin surfaces in WT and Muc6−/− mice. (C) MUC5AC (green) and MUC4 (red) staining in WT and Muc6−/− mice (n=3 mice/group). (D) Representative O-linked glycan expression in WT and Muc6−/− mice (n=2/group) using LC-MS analysis. (E) Representative N-linked glycan expression in WT and Muc6−/− mice (n=2/group) using LC-MS analysis. (F) Lectin connectivity analysis with lectin array, comparing WT and Muc6−/− mice (n=12/group). (G) FITC-conjugated rBanana lectin (green) and GNL (green) staining in WT and Muc6−/− mice. (H) Proteins bound to the rBanana lectin were immunoprecipitated and blotted. Protein bands in Muc6−/− samples were identified using LC-MS analysis. psClu expression is indicated by arrows. (I) Western blotting of rBanana lectin pull-down lysates and whole lysates with a clusterin antibody. (J) GNL (green) and clusterin (red) staining in WT and Muc6−/− mice. Clusterin-positive and clusterin/GNL double-positive cells per gland were quantified (n=3 mice/group). (K) GNL (green), clusterin (red), and E-cadherin (pink) staining in WT and Muc6−/− mice. (L) The schema of cellular localization of clusterin, mannose, and plasma membrane. (M) HE, CD44v(green)/Ki67(red), GSII(green)/TFF2(red), EGFR(green), p-ERK(green), GOLPH3(green), GM130(green), and GNL(green)/clusterin(red) staining in Tff1cre; Cosmcflox/flox mice. Scale bars; 100 μm. Mean ± S.E.M. *P < .05.
Figure 6.
Figure 6.. rBanana lectin-drug conjugates selectively target MUC6-negative cancer cells to suppress tumor growth.
(A) Schematic representation of rBanana H84T and PE38 conjugates. (B) Hemagglutination tests for normal Banana lectin, Banana lectin with H84T modification (rBanana), and rBanana-PE38. (C) Fluorescent images and flow cytometry analysis of HUG1-P1 (MUC6-positive) and MKN45 cells following treatment with FITC-conjugated rBanana lectin. (D) Viability of HUG1-P1 and MKN45 cells treated with rBanana-PE38 conjugate at the indicated doses (n=5/group). (E) Treatment of rBanana-PE38 conjugates for MKN45 xenografts. Gross findings and weights of the xenografts are shown (n=6/group). (F, G) Treatment of rBanana-PE38 conjugates for Muc6−/− mice (n=4 mice/group). (F) Gross findings and HE staining. Tumor diameters and gland heights were quantified. (G) Ki67 and cleaved caspase-3 staining. Scale bars; 100 μm. Mean ± S.E.M. *P < .05.
Figure 7.
Figure 7.. MUC6 expression is associated with MAPK activation, GOLPH3 upregulation, and mannose-binding lectin connectivity in human GC cases.
(A-B) Analyzing Cancer Genome Atlas data compares GCs with wild-type and mutated MUC6. (A) sorting GC mutations by q value and (B) GSEA for MUC6 mutants vs. non-mutants. (D-F) The analysis of public single-cell RNA sequencing data for GC (GSE183904) comparing tumor epithelial samples with high MUC6 expression to those with low MUC6 expression. (D-E) UMAP plot (D) colored by samples from GC patients. (E) stratified on the bases of MUC6 expression. (F) PCA plot. (G) GSEA with upregulated and downregulated DEGs in Muc6−/− mice. (G-J) Analyzing human tissue array with MUC6-positive (n=10) and -negative (n=62) GC. Evaluating p-ERK, GOLPH3, FITC-conjugated GNL, and Clusterin staining and grading. Scale bars; 100 μm.

References

    1. Sung H, Ferlay J, Siegel RL, et al. Global Cancer Statistics 2020: GLOBOCAN Estimates of Incidence and Mortality Worldwide for 36 Cancers in 185 Countries. CA Cancer J Clin 2021;71:209–249. - PubMed
    1. Hayakawa Y, Ariyama H, Stancikova J, et al. Mist1 Expressing Gastric Stem Cells Maintain the Normal and Neoplastic Gastric Epithelium and Are Supported by a Perivascular Stem Cell Niche. Cancer Cell 2015;28:800–814. - PMC - PubMed
    1. Hayakawa Y, Sethi N, Sepulveda AR, et al. Oesophageal adenocarcinoma and gastric cancer: should we mind the gap? Nat Rev Cancer 2016;16:305–18. - PubMed
    1. Huang KK, Ramnarayanan K, Zhu F, et al. Genomic and Epigenomic Profiling of High-Risk Intestinal Metaplasia Reveals Molecular Determinants of Progression to Gastric Cancer. Cancer Cell 2018;33:137–150.e5. - PubMed
    1. Hata M, Kinoshita H, Hayakawa Y, et al. GPR30-Expressing Gastric Chief Cells Do Not Dedifferentiate But Are Eliminated via PDK-Dependent Cell Competition During Development of Metaplasia. Gastroenterology 2020;158:1650–1666.e15. - PMC - PubMed

MeSH terms