

Behavioural and physiological responses to stressors in sheep with temperament classified by genotype or phenotype
- PMID: 38584170
- PMCID: PMC10999442
- DOI: 10.1038/s41598-024-58959-y
Behavioural and physiological responses to stressors in sheep with temperament classified by genotype or phenotype
Abstract
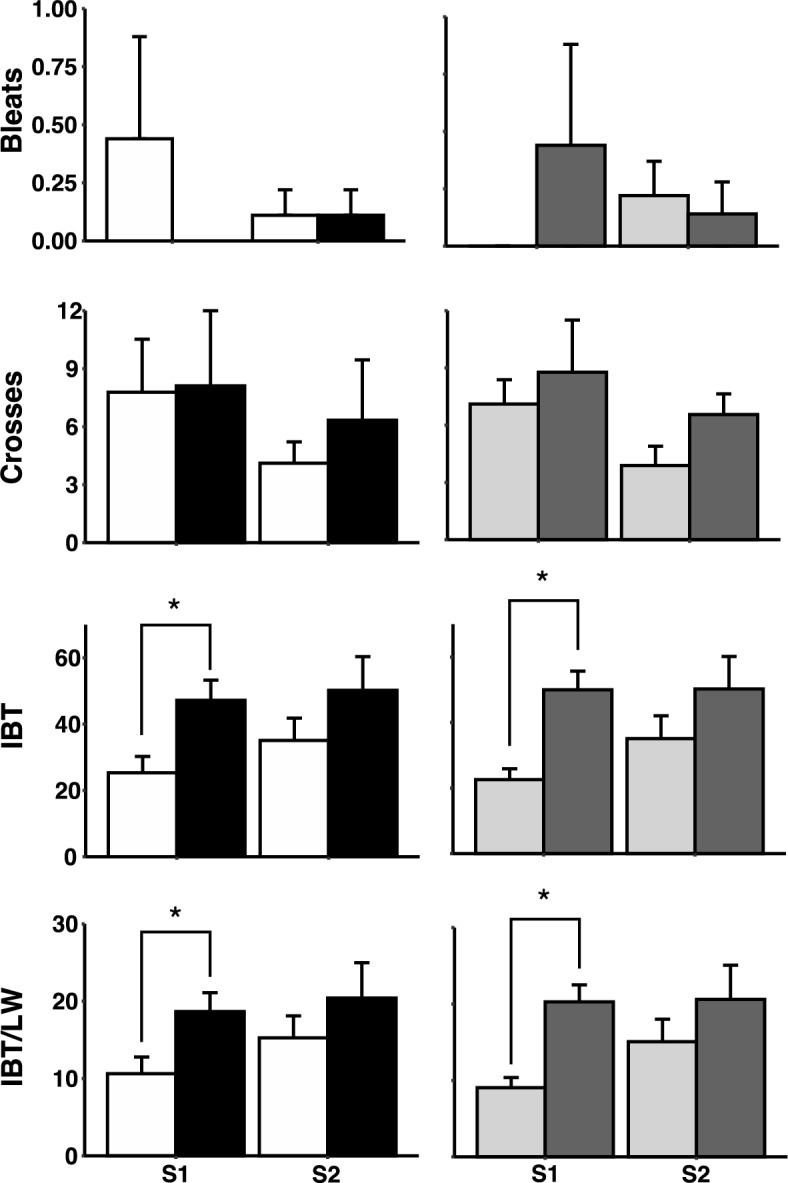
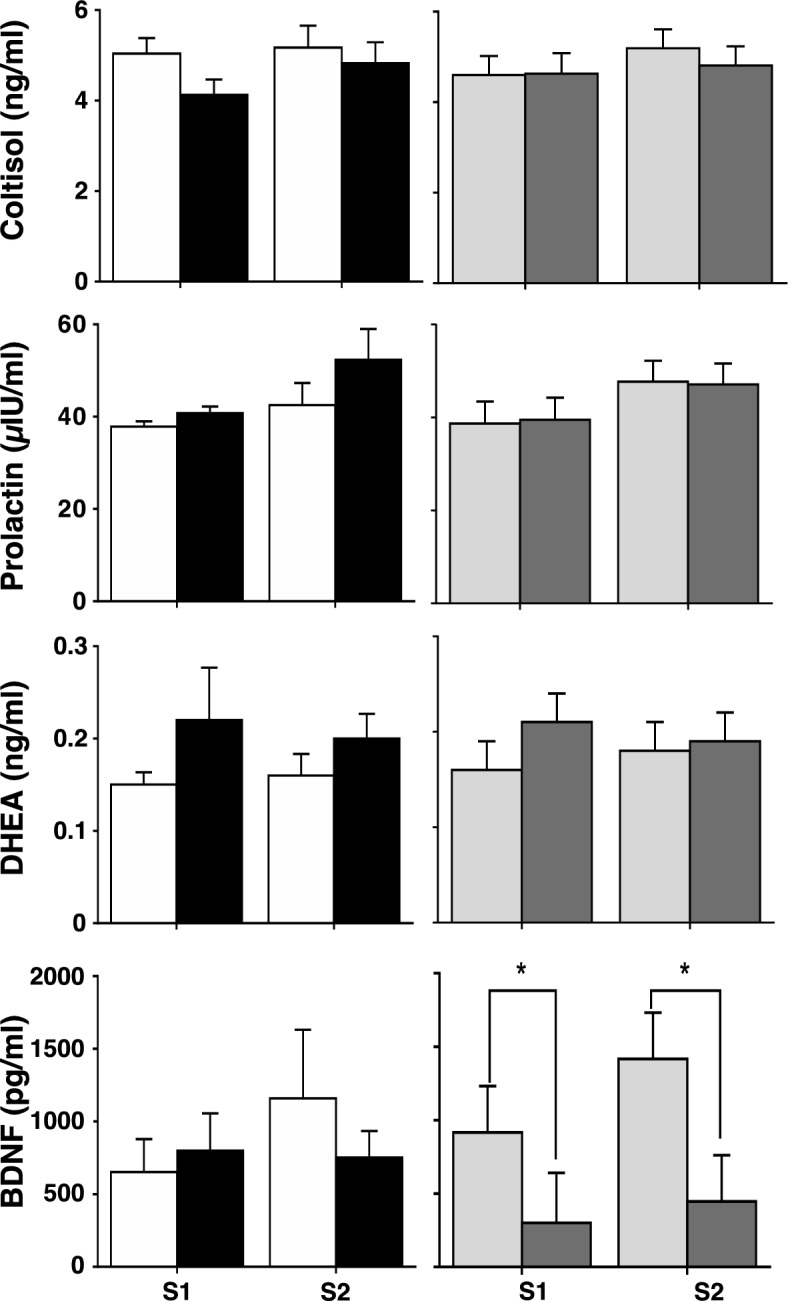
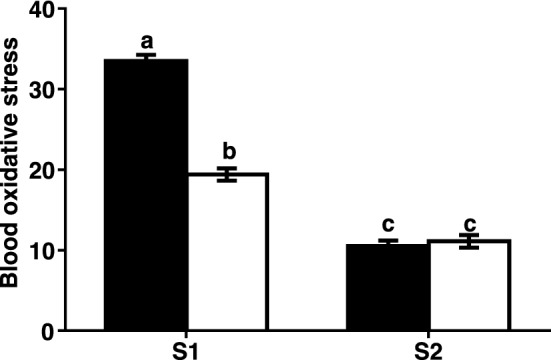
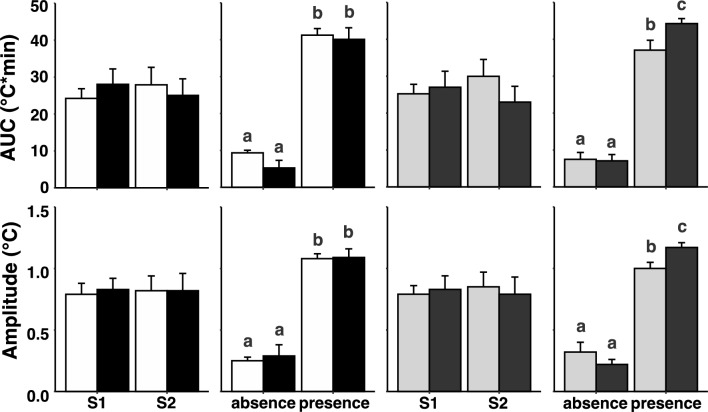
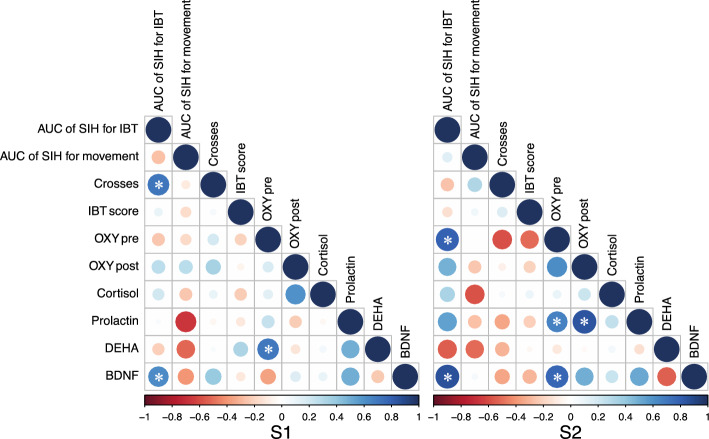
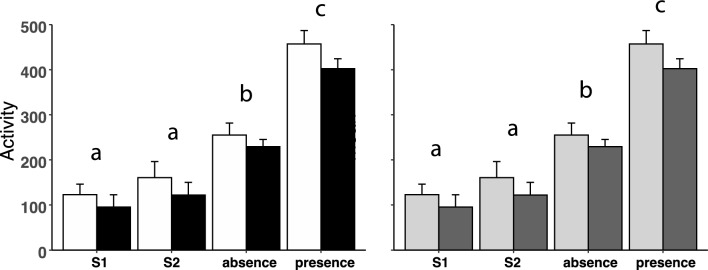
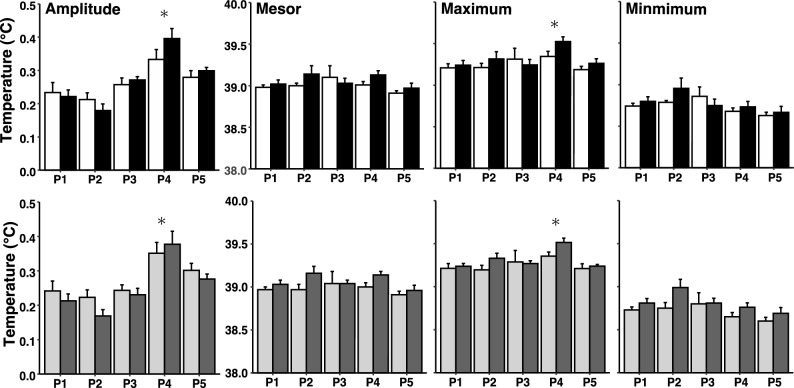
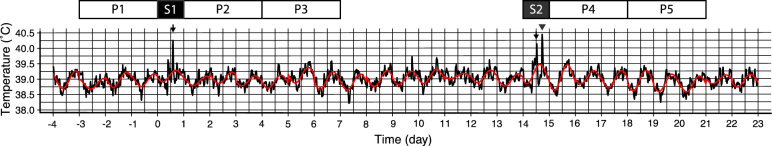
The single nucleotide polymorphism (SNP) rs107856856, located in the tryptophan hydroxylase-2 gene, is associated with the behavioural phenotype for sheep temperament measured at weaning. Here, we tested the association between that SNP and physiological and behavioural responses to stressors in adult sheep. Two groups of adult sheep, one with genotype A/A (calm genotype) and the other with G/G (nervous genotype) in rs107856856, were selected from 160 sheep and were exposed, twice, to an open-field arena and an isolation box test (IBT). During each repeat, the behaviour and physiological responses (cortisol, prolactin, dehydroepiandrosterone [DHEA], brain derived neurotrophic factor [BDNF], characteristics of the response of body temperature, and oxidative stress) were measured. The behavioural and physiological responses of the sheep were compared between genotypes and also between groups classified on their phenotype as assessed by their initial isolation box score ("low responders" and "high responders"). The SNP rs107856856 had some effects on the behavioural phenotype (IBT score) but no effects on the physiological response to stress (cortisol, prolactin, DHEA, BDNF, oxidative stress or changes in body temperature) in the adult sheep, probably because the sheep were exposed, and therefore had adapted, to human contact during their life.
© 2024. The Author(s).
Conflict of interest statement
The authors declare no competing interests.
Figures
Similar articles
-
Associations between temperament and gene polymorphisms in the brain dopaminergic system and the adrenal gland of sheep.Physiol Behav. 2016 Jan 1;153:19-27. doi: 10.1016/j.physbeh.2015.10.022. Epub 2015 Oct 20. Physiol Behav. 2016. PMID: 26498700
-
Twenty-four-hour profiles of metabolic and stress hormones in sheep selected for a calm or nervous temperament.Domest Anim Endocrinol. 2015 Oct;53:78-87. doi: 10.1016/j.domaniend.2015.05.005. Epub 2015 Jun 9. Domest Anim Endocrinol. 2015. PMID: 26143303
-
Genetic selection for temperament affects behaviour and the secretion of adrenal and reproductive hormones in sheep subjected to stress.Stress. 2013 Jan;16(1):130-42. doi: 10.3109/10253890.2012.690114. Epub 2012 Jun 19. Stress. 2013. PMID: 22564112
-
Association between temperament related traits and single nucleotide polymorphisms in the serotonin and oxytocin systems in Merino sheep.Genes Brain Behav. 2021 Mar;20(3):e12714. doi: 10.1111/gbb.12714. Epub 2020 Nov 18. Genes Brain Behav. 2021. PMID: 33161622
-
Association of steroid 17-alpha-hydroxylase/17,20 lyase (CYP17) single nucleotide polymorphism (SNP) 628 and dopamine receptor D2 (DRD2) SNP939 genotypes with sheep reproductive performance.Reprod Fertil Dev. 2019 Apr;31(4):743-750. doi: 10.1071/RD18069. Reprod Fertil Dev. 2019. PMID: 30449296
Cited by
-
Identifying biomarkers of sheep welfare using a metabolic discrepancy model.Sci Rep. 2025 Apr 17;15(1):13288. doi: 10.1038/s41598-025-97993-2. Sci Rep. 2025. PMID: 40247073 Free PMC article.
References
-
- Réale D, Reader SM, Sol D, McDougall PT, Dingemanse NJ. Integrating animal temperament within ecology and evolution. Biol. Rev. Camb. Philos. Soc. 2007;82:291–318. - PubMed
-
- Glenske K, Prinzenberg E-M, Brandt H, Gauly M, Erhardt G. A chromosome-wide QTL study on BTA29 affecting temperament traits in German Angus beef cattle and mapping of DRD4. Animal. 2011;5:195–197. - PubMed
-
- Glenske K, Brandt H, Prinzenberg E-M, Gauly M. Verification of a QTL on BTA1 for temperament in German Simmental and German Angus calves (Short Communication) Arch. Anim. Breed. 2010;53:388–392.
-
- Chen Q, et al. Genome-wide association study identifies genomic loci associated with flight reaction in cattle. J. Anim. Breed. Genet. 2020;137:477–485. - PubMed
MeSH terms
Substances
LinkOut - more resources
Full Text Sources
