. 2024 Jun 5;32(6):1849-1874.
doi: 10.1016/j.ymthe.2024.04.005. Epub 2024 Apr 6.

Engineering allorejection-resistant CAR-NKT cells from hematopoietic stem cells for off-the-shelf cancer immunotherapy

Affiliations

Engineering allorejection-resistant CAR-NKT cells from hematopoietic stem cells for off-the-shelf cancer immunotherapy

Yan-Ruide Li et al. Mol Ther. .

Abstract

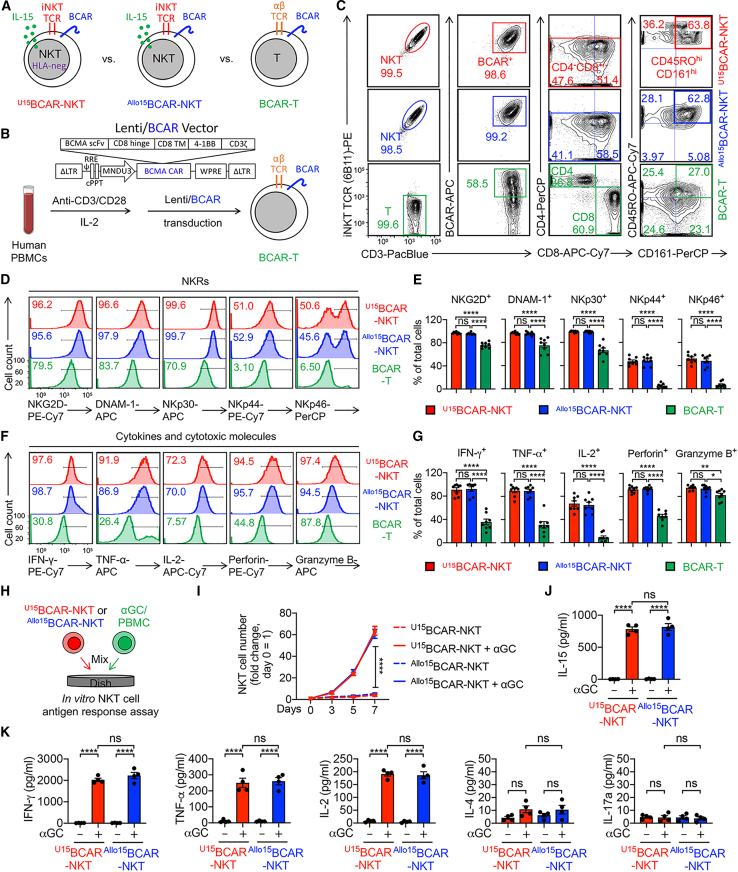
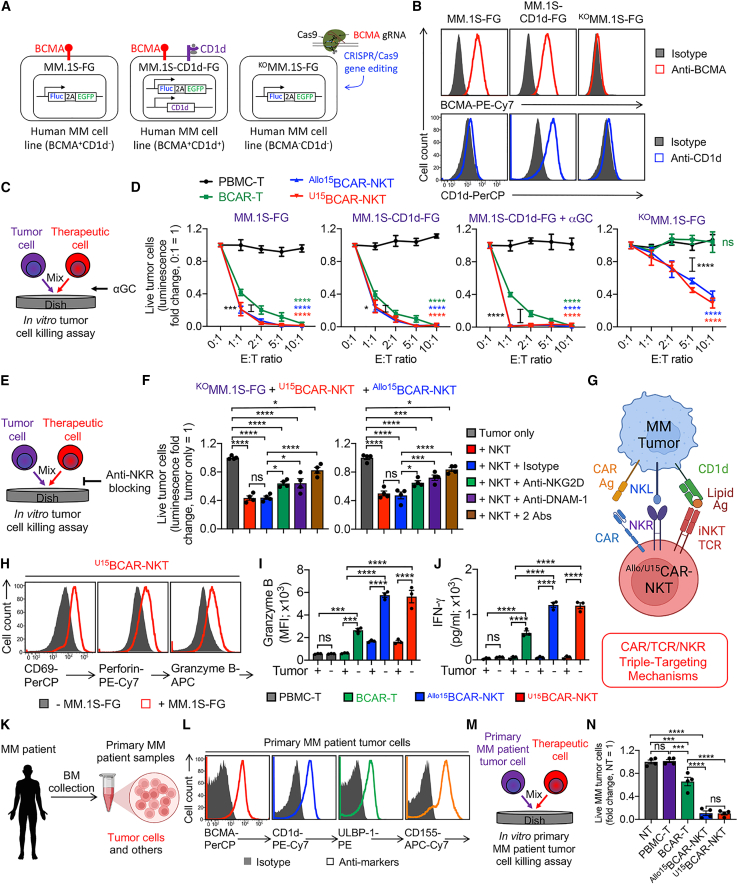
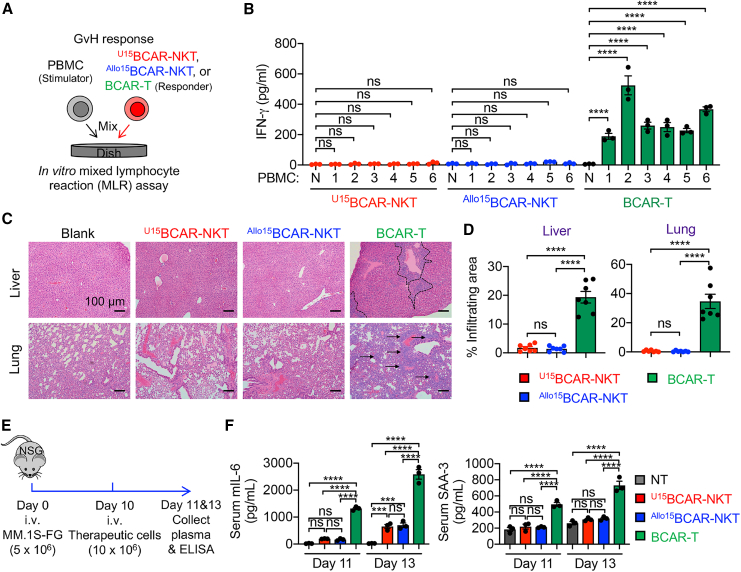
The clinical potential of current FDA-approved chimeric antigen receptor (CAR)-engineered T (CAR-T) cell therapy is encumbered by its autologous nature, which presents notable challenges related to manufacturing complexities, heightened costs, and limitations in patient selection. Therefore, there is a growing demand for off-the-shelf universal cell therapies. In this study, we have generated universal CAR-engineered NKT (UCAR-NKT) cells by integrating iNKT TCR engineering and HLA gene editing on hematopoietic stem cells (HSCs), along with an ex vivo, feeder-free HSC differentiation culture. The UCAR-NKT cells are produced with high yield, purity, and robustness, and they display a stable HLA-ablated phenotype that enables resistance to host cell-mediated allorejection. These UCAR-NKT cells exhibit potent antitumor efficacy to blood cancers and solid tumors, both in vitro and in vivo, employing a multifaceted array of tumor-targeting mechanisms. These cells are further capable of altering the tumor microenvironment by selectively depleting immunosuppressive tumor-associated macrophages and myeloid-derived suppressor cells. In addition, UCAR-NKT cells demonstrate a favorable safety profile with low risks of graft-versus-host disease and cytokine release syndrome. Collectively, these preclinical studies underscore the feasibility and significant therapeutic potential of UCAR-NKT cell products and lay a foundation for their translational and clinical development.

Keywords: CRISPR-Cas9 gene editing; T cell receptor gene engineering; allogeneic cell therapy; allorejection resistance; chimeric antigen receptor engineering; hematopoietic stem cell engineering; invariant natural killer T cell; off-the-shelf cancer immunotherapy; tumor microenvironment; universal CAR-engineered NKT cell.


Conflict of interest statement

Declaration of interests Y.-R.L., Y. Zhou, J.Y., D.L., Z.L., Y.J.K., P.W., and L.Y. are inventors on patents relating to this study filed by UCLA. Y. Zhou is currently an employee of Amberstone Biosciences. J.Y. is currently an employee of Appia Bio. Z.L. is currently an employee of Allogene. Y.J.K. is currently an employee of Nkarta. P.W. is a co-founder, stockholder, and advisory board member of Simnova Bio, TCRCure Biopharma, Appia Bio, and is a scientific advisor to Grit Biotechnolgoy. L.Y. is a scientific advisor to AlzChem and Amberstone Biosciences, and a co-founder, stockholder, and advisory board member of Appia Bio. Appia Bio licensed some patents relating to this study from UCLA. None of the declared companies contributed to or directed any of the research reported in this article. The remaining authors declare no competing interests.

Figures

None
Graphical abstract
Figure 1
Figure 1
HSC-derived BCMA-targeting CAR-engineered NKT (BCAR-NKT) cells with/out HLA gene editing can be produced at high yield and purity (A) Schematics showing the generation of two BCAR-NKT cell products: allogeneic IL-15-enhanced BCAR-NKT (Allo15BCAR-NKT) cells, and HLA-ablated universal IL-15-enhanced BCAR-NKT (U15BCAR-NKT) cells. HSC, hematopoietic stem cell; CAR, chimeric antigen receptor; gRNA, guide RNA; HLA-neg, HLA negative. (B) Schematics showing the design of Lenti/iNKT-BCAR-IL-15 lentivector and gRNA sequences of B2M and CIITA. BCAR, B cell maturation antigen (BCMA)-targeting CAR; ΔLTR, self-inactivating long-term repeats; MNDU3, internal promoter derived from the MND retroviral LTR U3 region; φ, packaging signal with the splicing donor and splicing acceptor sites; RRE, rev-responsive element; cPPT, central polypurine tract; WPRE, woodchuck responsive element. (C) Intracellular expression of iNKT TCR (identified as Vβ11+) and surface ablation of HLA-I/II (identified as HLA-I/B2MHLA-II) in CB HSCs 72 h after lentivector transduction and 48 h after CRISPR-Cas9 gene editing. (D) Quantification of Lenti/iNKT-BCAR-IL-15 lentivector transduction rate and CRISPR-Cas9 gene editing rate (n = 6). (E) FACS monitoring of the generation of Allo/U15BCAR-NKT cells. iNKT TCR was stained using a 6B11 monoclonal antibody. (F) Quantification of the transition among four subpopulations of U15BCAR-NKT cells during their developmental stages. CD4 SP, CD4 single-positive; CD8 SP, CD8 single-positive; DP, CD4 CD8 double-positive; DN, CD4 CD8 double-negative. (G) FACS detection of BCAR expression on Allo/U15BCAR-NKT cells. BCAR was stained using an anti-mouse IgG F(ab’)2 antibody. (H) FACS detection of HLA-I/II expression on Allo/U15BCAR-NKT cells. HLA-I/II-negative U15BCAR-NKT cells were purified using MACS or FACS sorting. (I) Quantification of HLA-I/II-negative cells among unpurified U15BCAR-NKT cells (n = 6). (J) Yield of Allo/U15BCAR-NKT cells (n = 5–9; n indicates different donors). Representative of 1 (A, B, and J) and >10 (C–I) experiments. Data are presented as the mean ± SEM. ns, not significant, by Student’s t test (J).
Figure 2
Figure 2
Allo/U15BCAR-NKT cells display a typical NKT cell phenotype and a Th0/Th1-prone, highly cytotoxic functionality (A) Diagram of Allo15BCAR-NKT cells, U15BCAR-NKT cells, and healthy donor PBMC-derived conventional T cells engineered with the same BCAR (denoted as BCAR-T cells). (B) Diagram showing the generation of BCAR-T cells from healthy donor PBMCs. (C) FACS detection of surface markers on Allo/U15BCAR-NKT cells. BCAR-T cells were included as a control. (D and E) FACS detection (D) and quantification (E) of NK receptors (NKRs) expression on the indicated cells (n = 8). (F–G) FACS detection (F) and quantification (G) of intracellular cytokines and cytotoxic molecules production by the indicated cells (n = 8). (H–K) Studying the antigen responses of Allo/U15BCAR-NKT cells. Allo/U15BCAR-NKT cells were stimulated with/out αGC/PBMC for 1 week. (H) Experimental design. (I) Growth curve of Allo/U15BCAR-NKT cells (n = 4). (J) ELISA analyses of IL-15 production by Allo/U15BCAR-NKT cells cultured in the presence or absence of αGC stimulation for 48 h (n = 4). (K) ELISA analyses of effector cytokine (IFN-γ, TNF-α, IL-2, IL-4, and IL-17a) production on day 7 (n = 4). Representative of 3 experiments. Data are presented as the mean ± SEM. ns, not significant; ∗p < 0.05, ∗∗p < 0.01, ∗∗∗∗p < 0.0001 by one-way ANOVA.
Figure 3
Figure 3
U15BCAR-NKT cells display an HLA-negative phenotype and resist to T cell-mediated allorejection (A and B) Studying the HLA expression on Allo/U15BCAR-NKT cells. Conventional BCAR-T cells were included as a control. (A) FACS measurements of surface HLA-I/II on Allo/U15BCAR-NKT cells. (B) Quantification of (A) (n = 5). (C and D) Studying the T cell-mediated allorejection against Allo/U15BCAR-NKT cells using an in vitro mixed lymphocyte reaction (MLR) assay. PBMCs from over 10 random mismatched healthy donors were used as responder cells, and irradiated Allo/U15BCAR-NKT cells were used as stimulator cells. Data from four representative donors are presented. BCAR-T cells were included as an allorejection control. (C) Experimental design. (D) ELISA analyses of IFN-γ production on day 4 (n = 3). (E) Diagram showing Allo/U15BCAR-NKT cells display HLA-low/negative phenotype and resist T cell-mediated allorejection. (F–J) Studying the T cell-mediated allorejection against Allo/U15BCAR-NKT cells using an in vivo humanized NSG mouse model. (F) Experimental design. BLI, bioluminescence live animal imaging. (G) Diagram of Allo15BCAR-NKT/FG, U15BCAR-NKT/FG, and BCAR-T/FG cells. The three therapeutic cells were engineered to overexpress the firefly luciferase and green fluorescence protein (FG) dual reporters. (H) FACS detection of FG expression in the indicated cells. (I) BLI images showing the presence of therapeutic cells in experimental mice over time. (J) Quantification of (I) (n = 3). Representative of 3 experiments. Data are presented as the mean ± SEM. ns, not significant; ∗p < 0.05, ∗∗p < 0.01, ∗∗∗∗p < 0.0001 by one-way ANOVA.
Figure 4
Figure 4
U15BCAR-NKT cells directly kill tumor cells at high efficacy and use multiple targeting mechanisms (A) Schematics showing the indicated human MM.1S cell lines. MM.1S-FG, MM.1S cell line engineered to express FG dual reporters; MM.1S-FG-CD1d, MM.1S-FG cell line further engineered to overexpress human CD1d; KOMM.1S-FG, MM.1S-FG cell line further engineered to knock out the BCMA gene. (B) FACS detection of BCMA and CD1d on the indicated tumor cells. (C and D) Studying the antitumor efficacy of U15BCAR-NKT cells against human MM.1S cell lines. Allo15BCAR-NKT, BCAR-T, and non-BCAR-engineered PBMC-T cells were included as therapeutic cell controls. (C) Experimental design. (D) Tumor cell killing data at 24 h (n = 4). (E and F) Studying the tumor killing mechanism of U15BCAR-NKT cells mediated by NK activating receptors (i.e., NKG2D and DNAM-1). (E) Experimental design. (F) Tumor cell killing data at 24 h (E:T ratio = 10:1; n = 4). (G) Diagram showing the CAR/TCR/NKR triple tumor-targeting mechanisms of U15BCAR-NKT cells. (H–J) FACS characterization of U15BCAR-NKT cells 24 h after co-culturing with MM.1S-FG. (H) FACS detection of surface CD69 as well as intracellular Perforin and Granzyme B in U15BCAR-NKT cells. (I) Quantification of (H) (n = 3). (J) ELISA analyses of IFN-γ production by U15BCAR-NKT cells (n = 3). (K–N) Studying the antitumor efficacy of U15BCAR-NKT cells against primary MM patient samples. (K) Diagram showing the collection of bone marrow (BM) samples from MM patients. (L) FACS detection of CAR target (BCMA), iNKT TCR target (CD1d), and NKR target (ULBP-1 and CD155) on primary MM patient-derived tumor cells. (M) Experimental design to study the primary MM tumor cell killing by therapeutic cells. (N) Tumor cell killing data at 24 h (n = 4). Representative of 3 experiments. Data are presented as the mean ± SEM. ns, not significant; ∗p < 0.05, ∗∗p < 0.01, ∗∗∗p < 0.001, ∗∗∗∗p < 0.0001 by one-way ANOVA (F, I, J, and N) or two-way ANOVA (D).
Figure 5
Figure 5
U15BCAR-NKT cells exhibit potent antitumor efficacy in vivo (A–D) Studying the in vivo antitumor efficacy of U15BCAR-NKT cells in an MM.1S-FG human MM xenograft NSG mouse model. Therapeutic cells are injected on day 4 to mimic the low tumor burden condition. (A) Experimental design. (B) BLI images showing the presence of tumor cells in experimental mice over time. (C) Quantification of (B) (n = 5). TBL, total body luminescence. (D) Kaplan-Meier survival curves of experimental mice over time (n = 5). (E–H) Studying the in vivo antitumor efficacy of U15BCAR-NKT cells in an MM.1S-FG human MM xenograft NSG mouse model. Therapeutic cells are injected on day 20 to mimic the high tumor burden condition. (E) Experimental design. (F) BLI images showing the presence of tumor cells in experimental mice over time. (G) Quantification of (F) (n = 5). (H) Kaplan-Meier survival curves of experimental mice over time (n = 5). (I–L) Studying the in vivo antitumor efficacy of U15BCAR-NKT cells in an MM.1S-CD1d-FG human MM xenograft NSG mouse model. Therapeutic cells are injected on day 20 to mimic the high tumor burden condition. (I) Experimental design. (J) BLI images showing the presence of tumor cells in experimental mice over time. (K) Quantification of (J) (n = 5–6). (L) Kaplan-Meier survival curves of experimental mice over time (n = 5–6). (M–P) Studying the in vivo antitumor efficacy of U15BCAR-NKT cells in a KOMM.1S-FG human MM xenograft NSG mouse model. Therapeutic cells are injected on day 4 to mimic the low tumor burden condition. (M) Experimental design. (N) BLI images showing the presence of tumor cells in experimental mice over time. (O) Quantification of (N) (n = 4–5). (P) Kaplan-Meier survival curves of experimental mice over time (n = 4–5). Representative of 2 experiments. Data are presented as the mean ± SEM. ns, not significant; ∗p < 0.05, ∗∗p < 0.01, ∗∗∗p < 0.001, ∗∗∗∗p < 0.0001, by one-way ANOVA (G and O), two-way ANOVA (C and K), or by log rank (Mantel-Cox) test adjusted for multiple comparisons (D, H, L, and P).
Figure 6
Figure 6
U15BCAR-NKT cells maintain high antitumor efficacy despite T cell-mediated allorejection (A) Experimental design to study the in vivo antitumor efficacy of U15BCAR-NKT cells under T cell-mediated allorejection in a human MM xenograft NSG mouse model. Allo15BCAR-NKT and BCAR-T cells were included as controls. (B) BLI images showing the presence of tumor cells in experimental mice over time. (C) Quantification of (B) (n = 5). (D) Kaplan-Meier survival curves of experimental mice over time (n = 5). Representative of 2 experiments. Data are presented as the mean ± SEM. ns, ∗∗p < 0.01, by log rank (Mantel-Cox) test adjusted for multiple comparisons.
Figure 7
Figure 7
U15BCAR-NKT cells alter the TME by selectively depleting TAMs and MDSCs via CD1d recognition (A) Diagram showing the TAM/MDSC targeting by U15BCAR-NKT cells via CD1d/iNKT TCR recognition. (B–J) Study the TAM/MDSC targeting by U15BCAR-NKT cells using in vitro cultured cells. (B) Diagram showing the generation of healthy donor PBMC-derived TAMs and MDSCs. MDM, monocyte-derived macrophage; Mφ, macrophage. (C) FACS detection of macrophage markers on the indicated cells. (D) FACS detection of CD1d on the indicated cells. (E) Quantification of (D). (F) Experimental design to study Mφ/MDSC targeting by U15BCAR-NKT cells using an in vitro Mφ/MDSC targeting assay. (G) Mφ/MDSC killing data at 24 h (n = 4). (H) FACS analyses of Granzyme B production by U15BCAR-NKT cells 24 h after co-culturing with Mφ. (I) T and B cell killing data by U15BCAR-NKT cells at 24 h (n = 4). (J) Mφ/MDSC killing data by BCAR-T cells at 24 h (n = 4). (K–O) Study the TAM/MDSC targeting by U15BCAR-NKT cells using primary MM patient samples. (K) Schematics showing the collection of primary MM patient samples. (L) FACS analysis of immune cell composition in the MM patient BM samples. Gran, granulocyte; Mono, monocytes. (M) FACS analyses of surface CD1d expression in the indicated TME cell component. MFI, mean florescence intensity. (N) Experimental design to study TME targeting by U15BCAR-NKT cells. (O) Killing data of the indicated TME cell component (n = 3). Representative of 3 experiments. Data are presented as the mean ± SEM. ns, not significant; ∗p < 0.05, ∗∗p < 0.01, ∗∗∗p < 0.001, ∗∗∗∗p < 0.0001 by Student’s t test (J), or one-way ANOVA (E, G, H, I, and M).
Figure 8
Figure 8
U15BCAR-NKT cells exhibit a high safety profile featured by low CRS attributes and minimal GvHD risk (A and B) Studying the graft-versus-host response of U15BCAR-NKT cells using an in vitro MLR assay. PBMCs from over 10 random mismatched healthy donors were used as stimulator cells. Data from six representative donors are presented. Allo15BCAR-NKT and conventional BCAR-T cells were included as responder controls. (A) Experimental design. (B) ELISA analyses of IFN-γ production on day 4. N, no addition of stimulator PBMCs (n = 3). (C and D) Studying the GvHD risk of U15BCAR-NKT cells using a human MM.1S xenograft NSG mouse model. Experimental design is shown in Figure 5A. (C) H&E-stained tissue sections. Tissues were collected from experimental mice on day 60. Scale bars, 100 μm. (D) Quantification of (C) (n = 7). (E and F) Studying CRS response induced by U15BCAR-NKT cells using an in vivo human MM.1S xenograft NSG mouse model. (E) Experimental design. (F) ELISA analyses of mouse IL-6 and SAA3 in mouse plasma collected on days 11 and 13 (n = 3). SAA-3, serum amyloid A-3. NT, mouse plasma sample collected from tumor-bearing mice receiving no therapeutic cell treatment. Representative of 3 experiments. Data are presented as the mean ± SEM. ns, not significant, ∗p < 0.05, ∗∗p < 0.01, ∗∗∗p < 0.001, ∗∗∗∗p < 0.0001, by one-way ANOVA (B, D, and F).

References

    1. June C.H., O’Connor R.S., Kawalekar O.U., Ghassemi S., Milone M.C. CAR T cell immunotherapy for human cancer. Science. 2018;359:1361–1365. doi: 10.1126/science.aar6711. - DOI - PubMed
    1. Sterner R.C., Sterner R.M. CAR-T cell therapy: current limitations and potential strategies. Blood Cancer J. 2021;11:69. doi: 10.1038/s41408-021-00459-7. - DOI - PMC - PubMed
    1. Labanieh L., Mackall C.L. CAR immune cells: design principles, resistance and the next generation. Nature. 2023;614:635–648. doi: 10.1038/s41586-023-05707-3. - DOI - PubMed
    1. Finck A.V., Blanchard T., Roselle C.P., Golinelli G., June C.H. Engineered cellular immunotherapies in cancer and beyond. Nat. Med. 2022;28:678–689. doi: 10.1038/s41591-022-01765-8. - DOI - PMC - PubMed
    1. Li Y.-R., Dunn Z.S., Yu Y., Li M., Wang P., Yang L. Advancing cell-based cancer immunotherapy through stem cell engineering. Cell Stem Cell. 2023;30:592–610. doi: 10.1016/j.stem.2023.02.009. - DOI - PMC - PubMed

MeSH terms

Substances