. 2024 Feb 2;4(1):ycae020.
doi: 10.1093/ismeco/ycae020. eCollection 2024 Jan.

Phylogenetics and environmental distribution of nitric oxide-forming nitrite reductases reveal their distinct functional and ecological roles

Affiliations

Phylogenetics and environmental distribution of nitric oxide-forming nitrite reductases reveal their distinct functional and ecological roles

Grace Pold et al. ISME Commun. .

Abstract

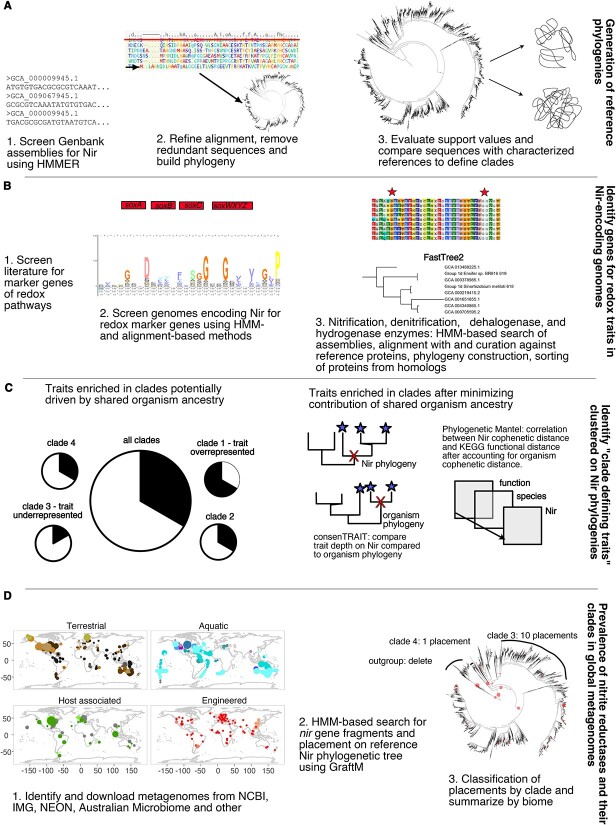
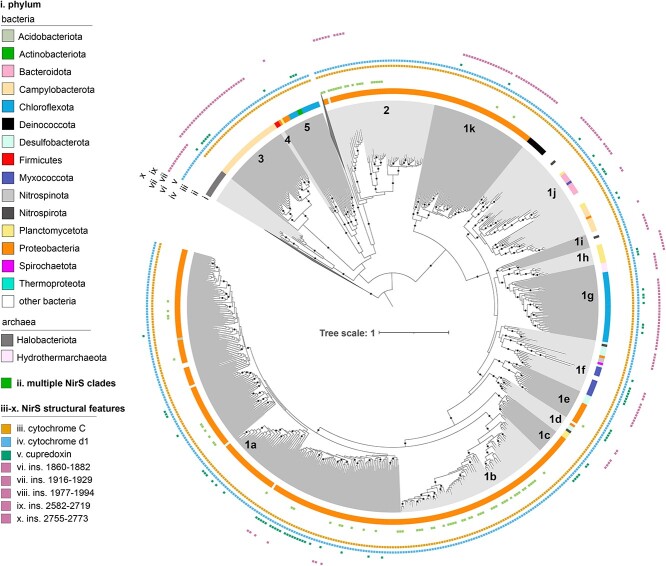
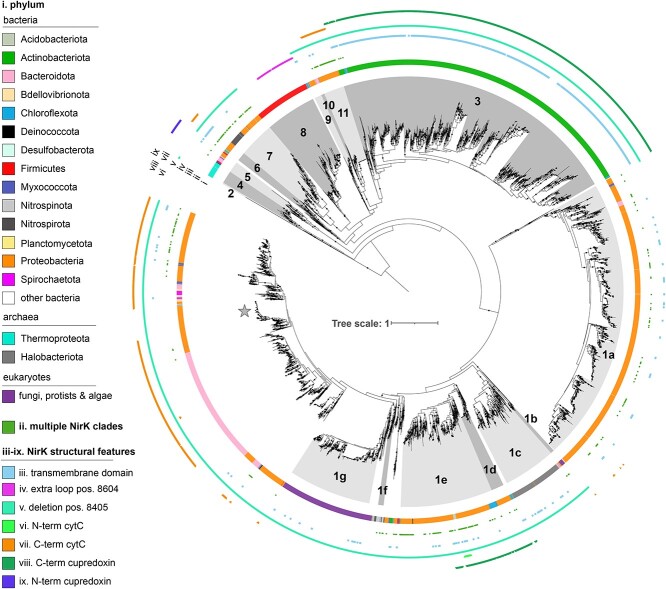
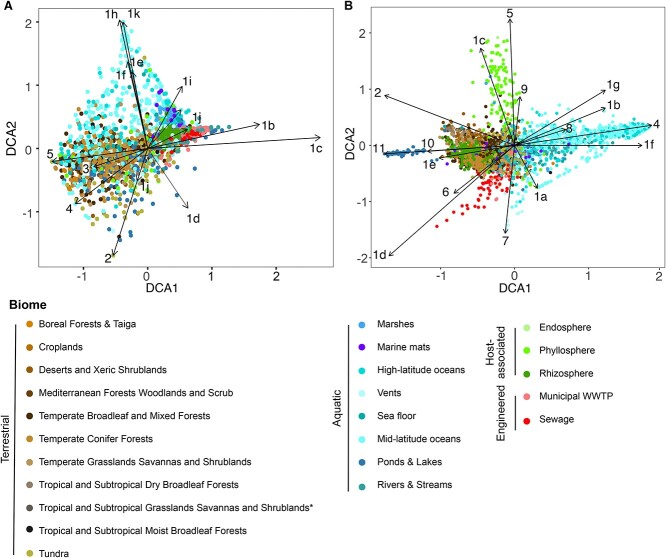
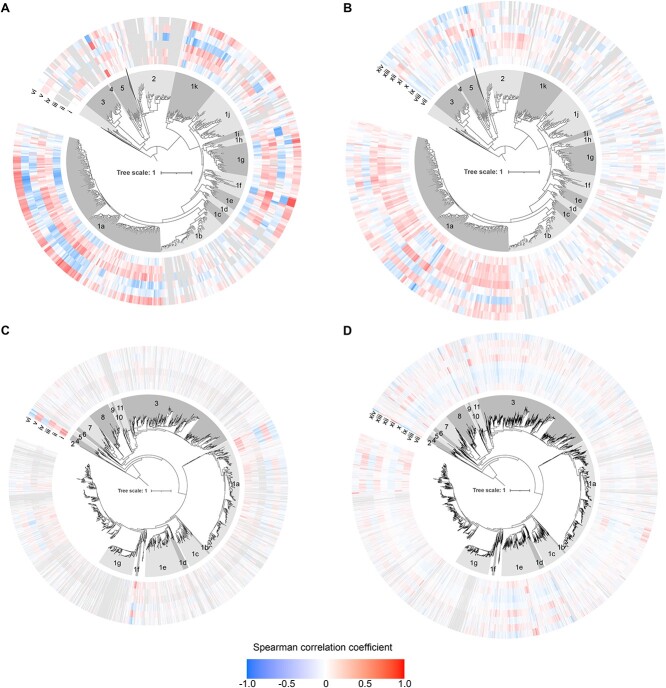
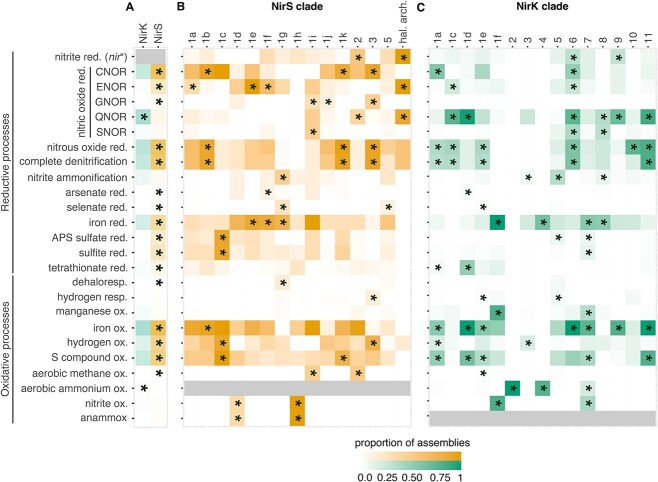
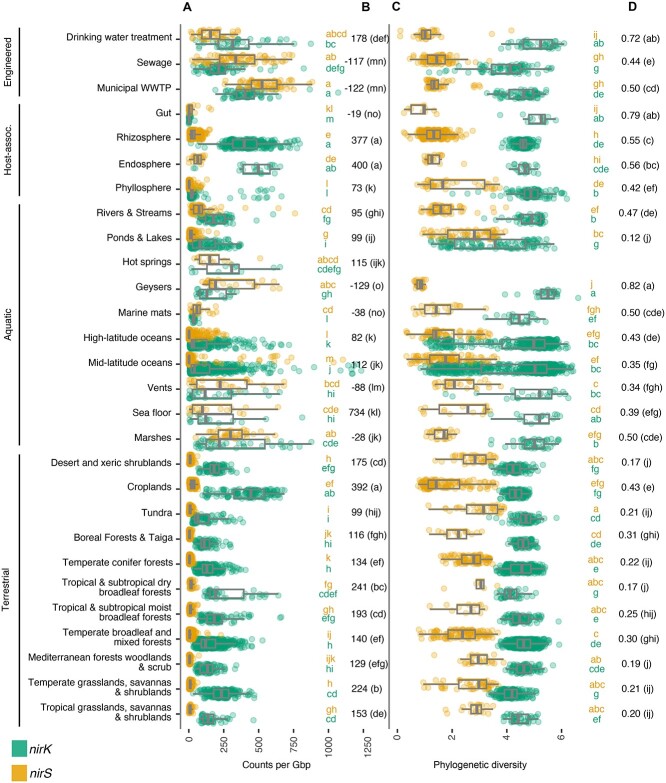
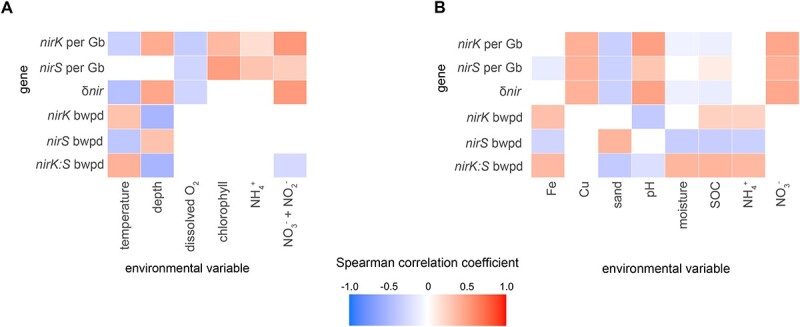
The two evolutionarily unrelated nitric oxide-producing nitrite reductases, NirK and NirS, are best known for their redundant role in denitrification. They are also often found in organisms that do not perform denitrification. To assess the functional roles of the two enzymes and to address the sequence and structural variation within each, we reconstructed robust phylogenies of both proteins with sequences recovered from 6973 isolate and metagenome-assembled genomes and identified 32 well-supported clades of structurally distinct protein lineages. We then inferred the potential niche of each clade by considering other functional genes of the organisms carrying them as well as the relative abundances of each nir gene in 4082 environmental metagenomes across diverse aquatic, terrestrial, host-associated, and engineered biomes. We demonstrate that Nir phylogenies recapitulate ecology distinctly from the corresponding organismal phylogeny. While some clades of the nitrite reductase were equally prevalent across biomes, others had more restricted ranges. Nitrifiers make up a sizeable proportion of the nitrite-reducing community, especially for NirK in marine waters and dry soils. Furthermore, the two reductases showed distinct associations with genes involved in oxidizing and reducing other compounds, indicating that the NirS and NirK activities may be linked to different elemental cycles. Accordingly, the relative abundance and diversity of NirS versus NirK vary between biomes. Our results show the divergent ecological roles NirK and NirS-encoding organisms may play in the environment and provide a phylogenetic framework to distinguish the traits associated with organisms encoding the different lineages of nitrite reductases.

Keywords: comparative genomics; denitrification; metagenomes; nitrite reductase; phylogenetics.


Conflict of interest statement

None declared.

Figures

Figure 1
Figure 1
Methods overview diagram. A) generation of reference alignment B) phylogenetic reconstruction C) evaluation of phylogenetic congruence between Nir and organism phylogenies D) screening metagenomes for nir gene fragments. HMM logo in panel b was generated in Skylign (http://skylign.org/).
Figure 2
Figure 2
Maximum-likelihood NirS phylogeny. The phylogeny was inferred from 542 full-length NirS amino acid sequences using the LG+F+R9 model in IQ-TREE. Black circles on tree indicate nodes with SH-aLRT ≥ 80% and Ufboot ≥ 95% support. Tips of tree are shaded according to clade, and data rings denote (i) phylum determined using GTDB-TK; (ii) presence of secondary nirS copies from other clades; (iii–x) select NirS structural features. The two outgroups, consisting of NirN and NirF sequences, are collapsed for clarity. Clades are numbered and lettered following Wei et al. [29] and Bonilla-Rosso et al. [28] to the degree possible, starting with the “canonical” Clade 1a [48].
Figure 3
Figure 3
Maximum-likelihood NirK phylogeny. The phylogeny was inferred from 6,422 full-length NirK amino acid sequences using the LG+F+R10 model in IQ-TREE. Black circles on tree indicate nodes with SH-aLRT ≥ 80% and UFboot ≥ 95% support. Tips of tree are shaded according to clade, and data rings denote (i) phylum determined using GTDB-TK; (ii) presence of secondary nirK copies from other clades; (iii–ix) select NirK structural features. The outgroup, consisting of 367 multicopper oxidases derived from Cyanobacteria and Thermoprotetota genomes, is collapsed for clarity; clades are numbered and lettered following Wei et al. [29] and Bonilla-Rosso et al. [28] as much as possible, starting with the “canonical” Clade 1a; the star marks the location of the AniA NirK proteins from N. gonorrhoeae. [48]
Figure 4
Figure 4
Nitrite reductase composition of globally distributed metagenomes. Ordinations of A) nirS and B) nirK clade composition based on detrended correspondence analysis. Each point represents the average of 100 rarefactions of 15 placements for a sample. Arrows terminate at the species score for each clade. Biomes represented by fewer than 10 samples after rarefying to 15 placements are excluded from the ordination.
Figure 5
Figure 5
Environmental correlations of nitrite reductases and their clades. Spearman correlation of edge masses on A, B) NirS and C, D NirK phylogenies against environmental variables in A, C) water column seawater and B, D) terrestrial biomes. Values represent correlations in leaves of tree. Outer rings are coloured according to correlation strength, with grey indicating insufficient data. (i) water nitrate + nitrite, (ii) water ammonium, (iii) chlorophyll, (iv) dissolved oxygen, (v) water depth, (vi) water temperature, (vii) soil nitrate, (viii) soil ammonium, (ix) percent SOC, (x) soil moisture, (xi) pH in CaCl2, (xii) sand content, (xiii) copper, and (xiv) iron. These variables were selected for having data available from many metagenomes and were potentially relevant for structuring microbial communities (reactive N availability (i, ii, vii, viii), C availability or input (iii, ix), oxygenation degree (iii, iv, x), and physiochemical properties (v-vi, xi-xiv). Bootstrap support values have been removed for visual clarity. Metagenomes with >15 placements for the gene were included. Since not all metadata are available for all samples, correlations correspond to different subsets of samples [48].
Figure 6
Figure 6
Proportion of assemblies carrying genes for redox traits. A) Proportion for all assemblies carrying the gene for NirS or NirK, or the proportion of assemblies within each clade carrying the genes for the associated function in the B) NirS and C) NirK phylogenies. Shading indicates the fraction of assemblies represented in the reference phylogeny which have the gene or trait of interest. Asterisks denote traits with a greater than expected frequency within a clade based on chi-squared post hoc tests. Grey indicates the trait was not tested due to not being found in members of any clade in the corresponding phylogeny. NirK clades 1b and 1g are not shown because they consist exclusively of eukaryotes and lack reliable protein predictions, while NirS clade 4 is excluded because it consists of just two taxa. nir* refers to nirS when discussing assemblies carrying NirK and nirK when discussing assemblies carrying NirS. Assemblies carrying both nirK and nirS genes were excluded from panel A and are shown in Table S8. Genes used as markers for each trait are listed in the Supplementary Methods.
Figure 7
Figure 7
Abundance and diversity of nir genes in metagenomes across biomes. A) Abundance of nirK and nirS genes per gigabase (Gb) sequenced, with B) median difference in nirK and nirS abundance (δnir). C) Diversity of nirK and nirS genes based on balance-weighted phylogenetic diversity (BWPD), with D) median ratios of nirK:nirS diversity. Ecosystem classifications are shown to the left. Biomes were compared using Benjamini-Hochberg FDR-corrected pairwise ranked comparisons following Kruskall-Wallis. Shared letters denoting similar abundance (in A) or diversity (in C) between biomes are shaded by nir type. Biomes represented by fewer than 10 metagenomes were excluded from the figure. Metagenomes off the scale of the axis are not shown but included in calculations for boxplot and pairwise comparisons. Boxplots show median and quartiles, and whiskers show 95 percentiles, and values for individual samples are shown as points.
Figure 8
Figure 8
Environmental correlations of prevalence and diversity of nitrite reductase genes. Correlations between environmental variables and the abundance of nirK per Gb sequenced, nirS per Gb sequenced, ratio of their genes, alpha diversity (bwpd, balance-weighted phylogenetic diversity) and ratio of diversity, in A aquatic and B terrestrial metagenomes. SOC: soil organic carbon.

References

    1. Zumft WG. Cell biology and molecular basis of denitrification. Microbiol Mol Biol Rev 1997;61:84. - PMC - PubMed
    1. Graf DRH, Jones CM, Hallin S. Intergenomic comparisons highlight modularity of the denitrification pathway and underpin the importance of community structure for N2O emissions. PLoS One 2014;9:e114118. 10.1371/journal.pone.0114118 - DOI - PMC - PubMed
    1. Glockner AB, Jüngst A, Zumft WG. Copper-containing nitrite reductase from Pseudomonas aureofaciens is functional in a mutationally cytochrome cd1-free background (NirS−) of Pseudomonas stutzeri. Arch Microbiol 1993;160:18–26. 10.1007/bf00258141 - DOI - PubMed
    1. Sánchez C, Minamisawa K. Redundant roles of Bradyrhizobium oligotrophicum Cu-type (NirK) and cd1-type (NirS) nitrite reductase genes under denitrifying conditions. FEMS Microbiol Lett 2018;365:fny015. 10.1093/femsle/fny015 - DOI - PubMed
    1. Tuomainen JM, Hietanen S, Kuparinen Jet al. . Baltic Sea cyanobacterial bloom contains denitrification and nitrification genes, but has negligible denitrification activity. FEMS Microbiol Ecol 2003;45:83–96. 10.1016/S0168-6496(03)00131-4 - DOI - PubMed