. 2024 Feb 28;4(3):100271.
doi: 10.1016/j.xjidi.2024.100271. eCollection 2024 May.

Identification of Keratinocyte Cytoprotectants against Toxicity by the Multikinase Inhibitor Sorafenib Using Drug Repositioning

Affiliations

Identification of Keratinocyte Cytoprotectants against Toxicity by the Multikinase Inhibitor Sorafenib Using Drug Repositioning

Yayoi Kamata et al. JID Innov. .

Abstract

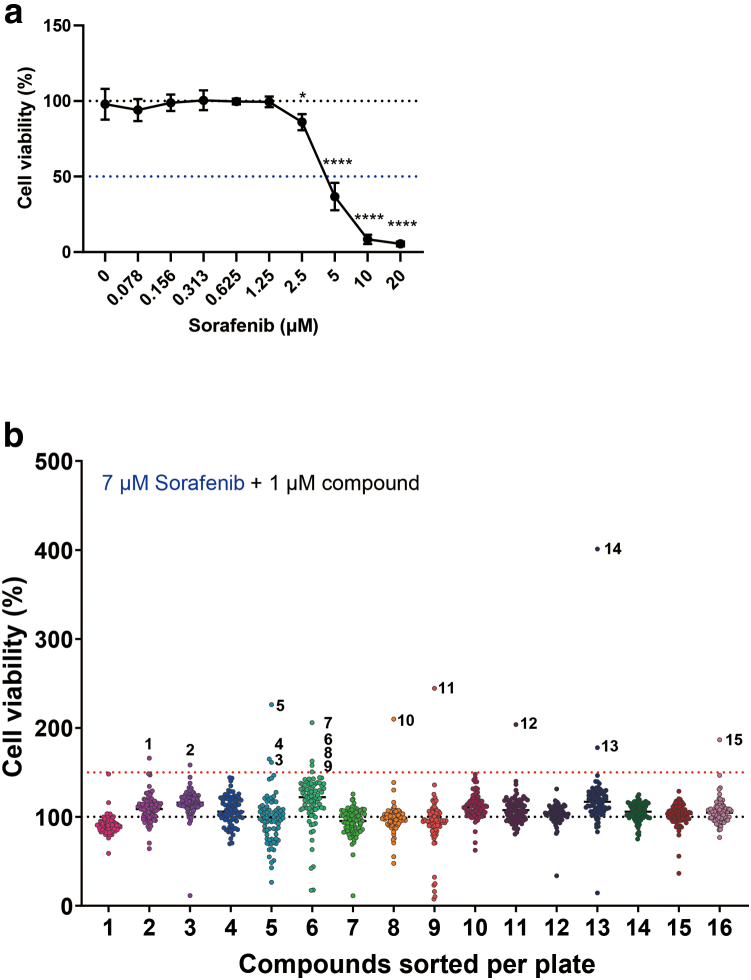
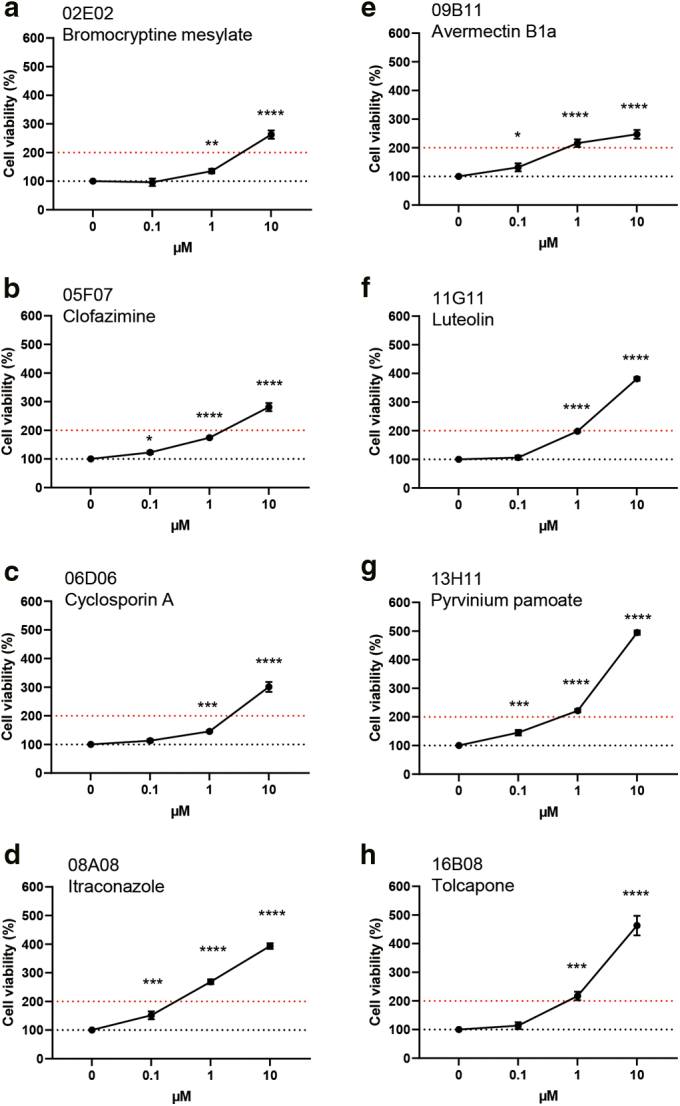
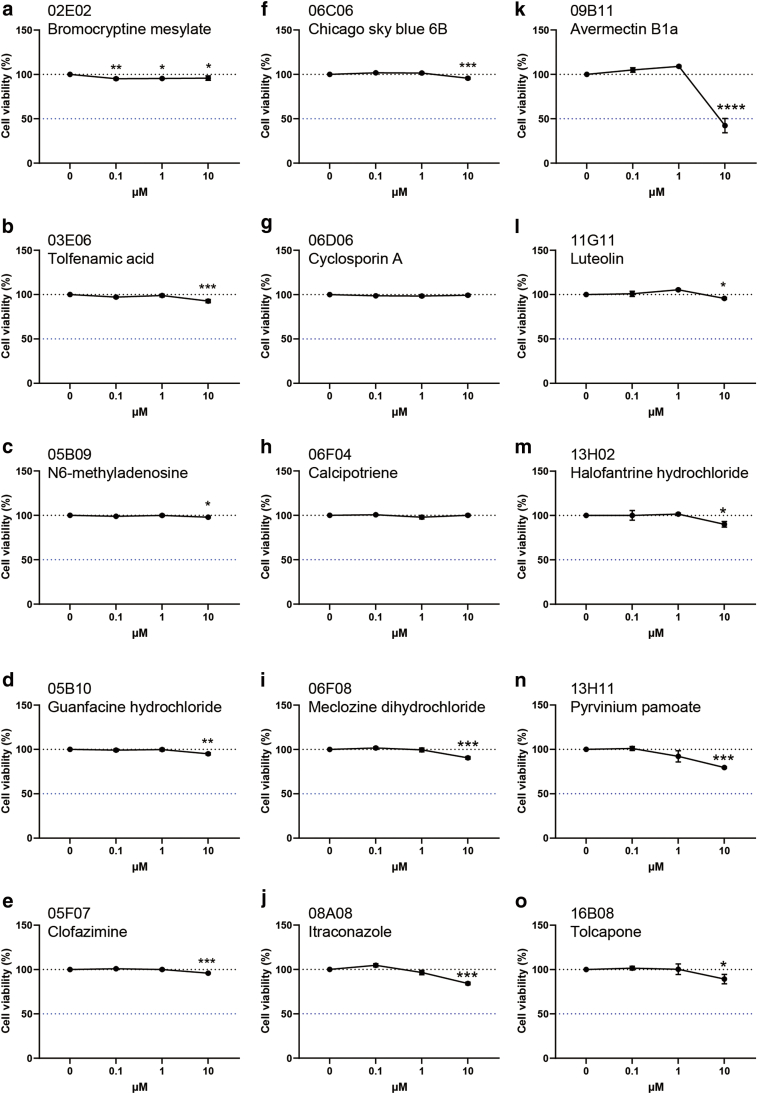
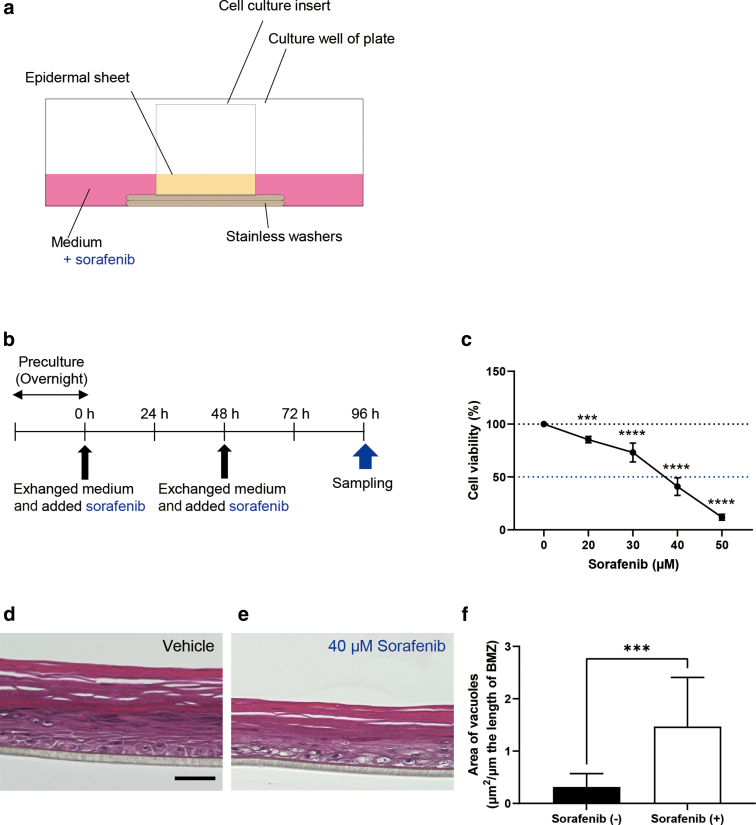
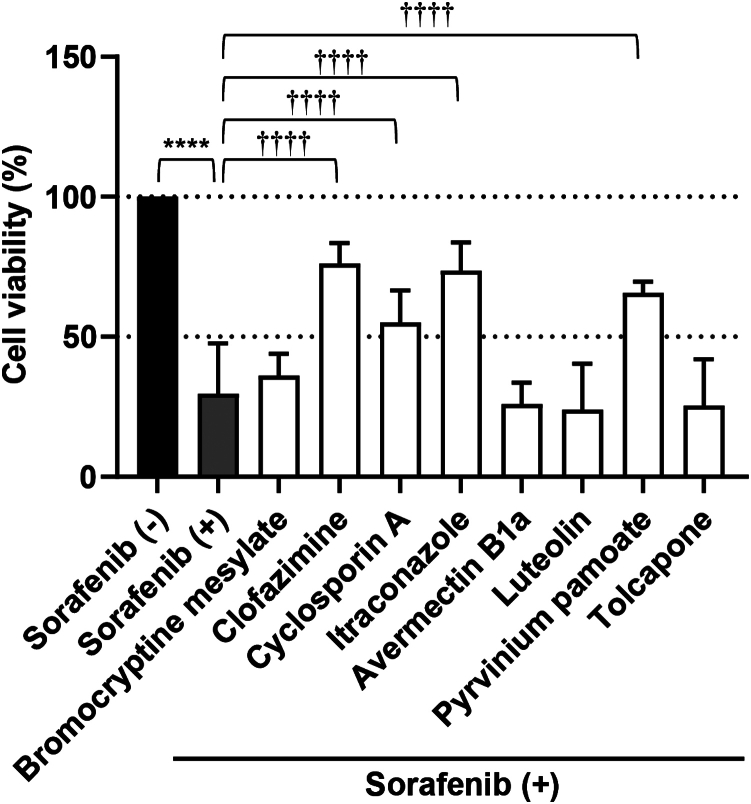
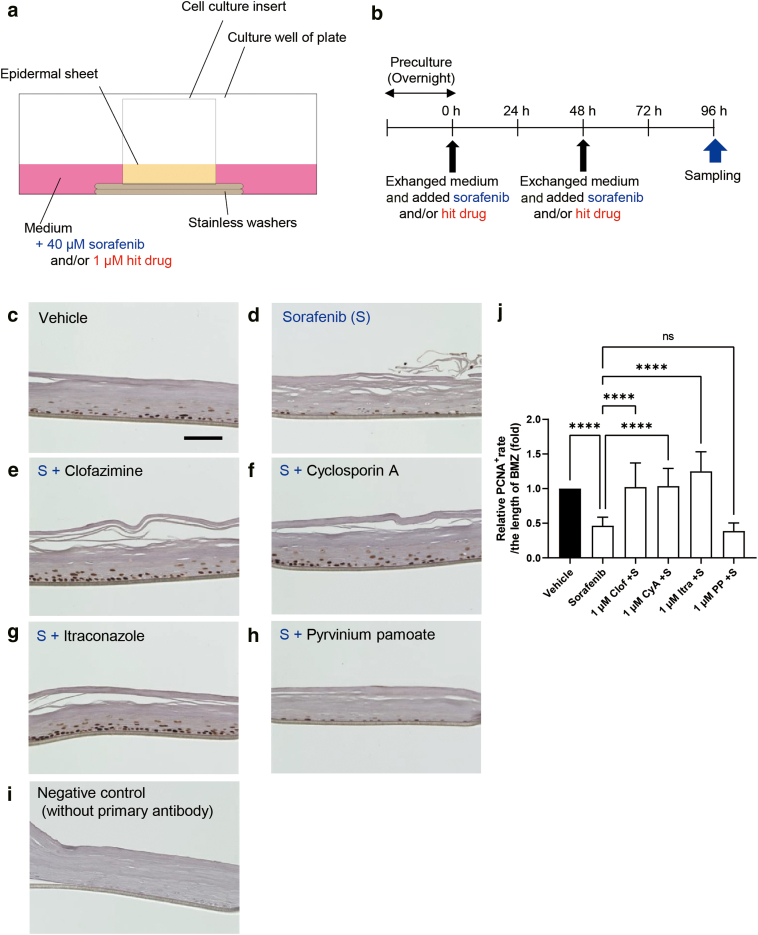
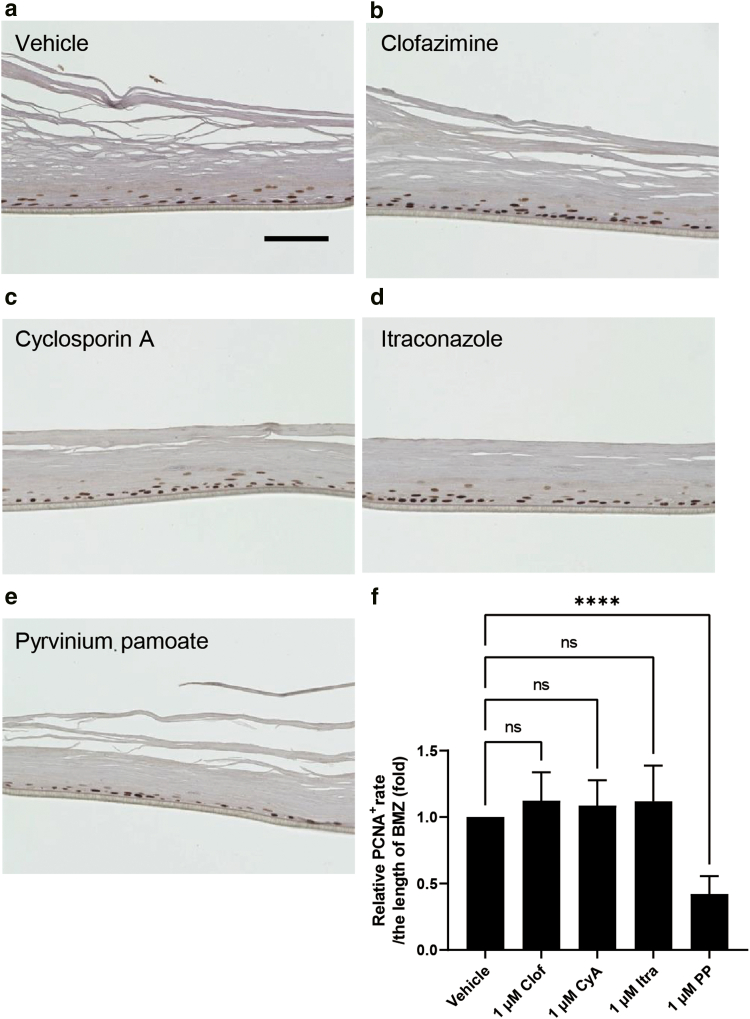
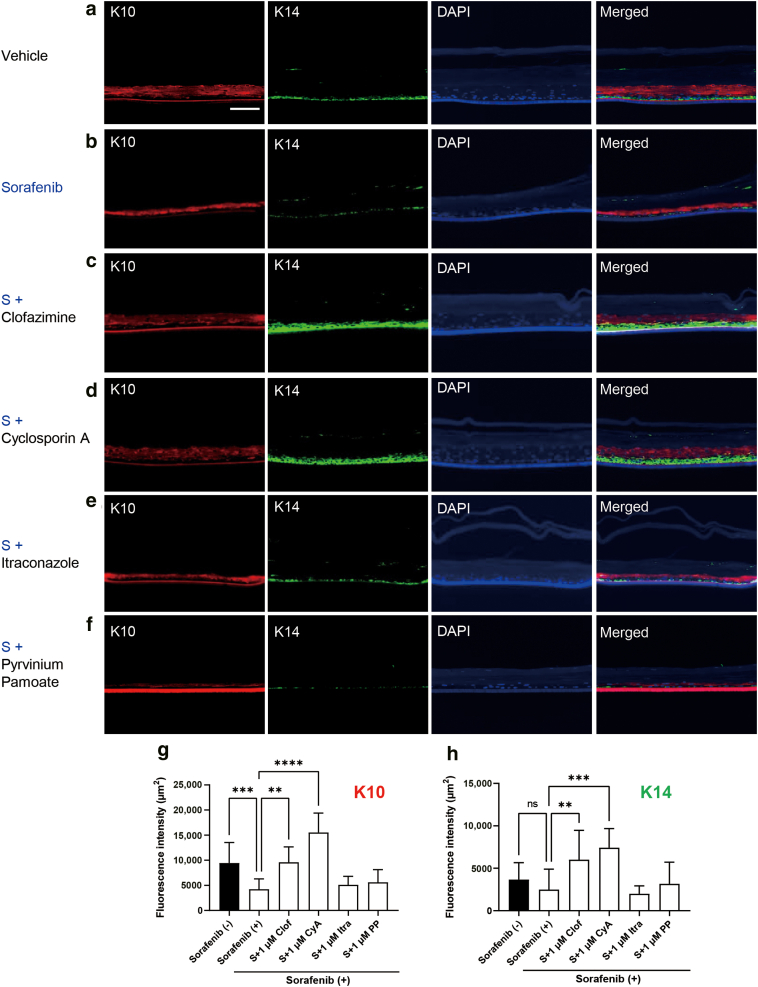
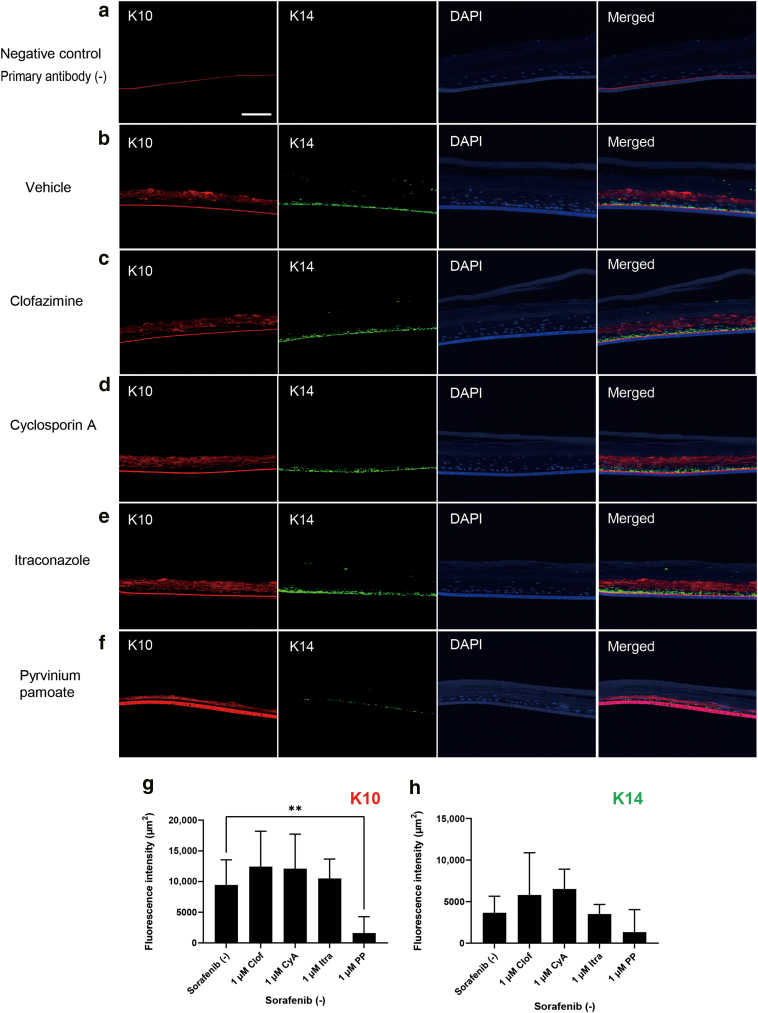
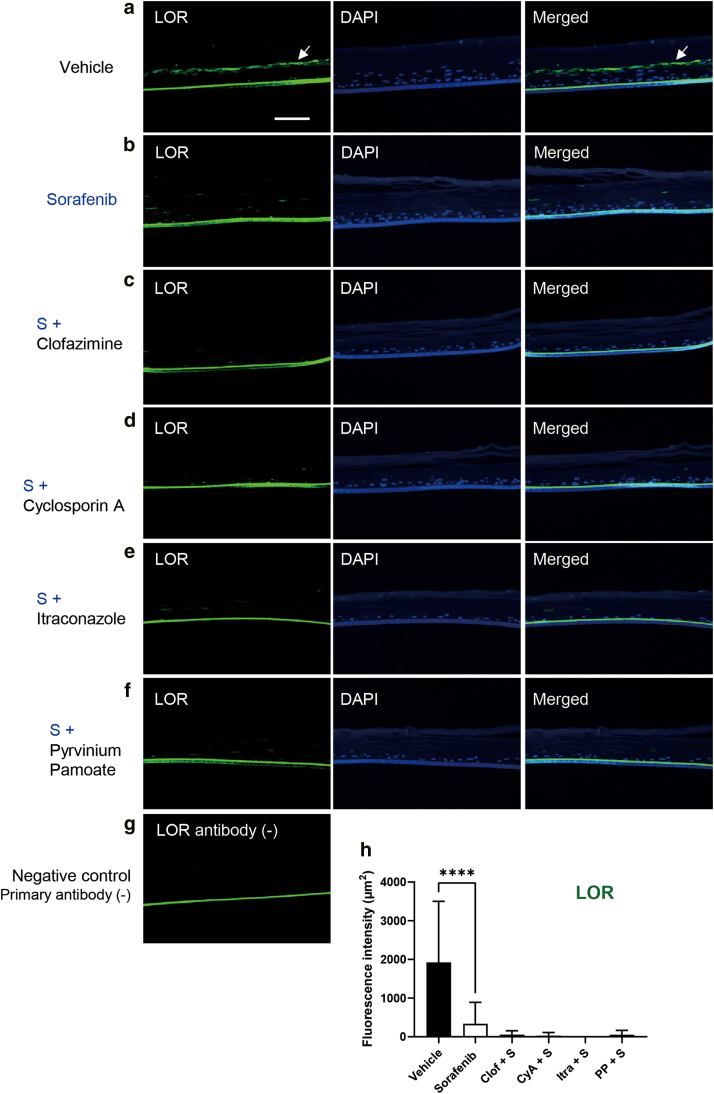
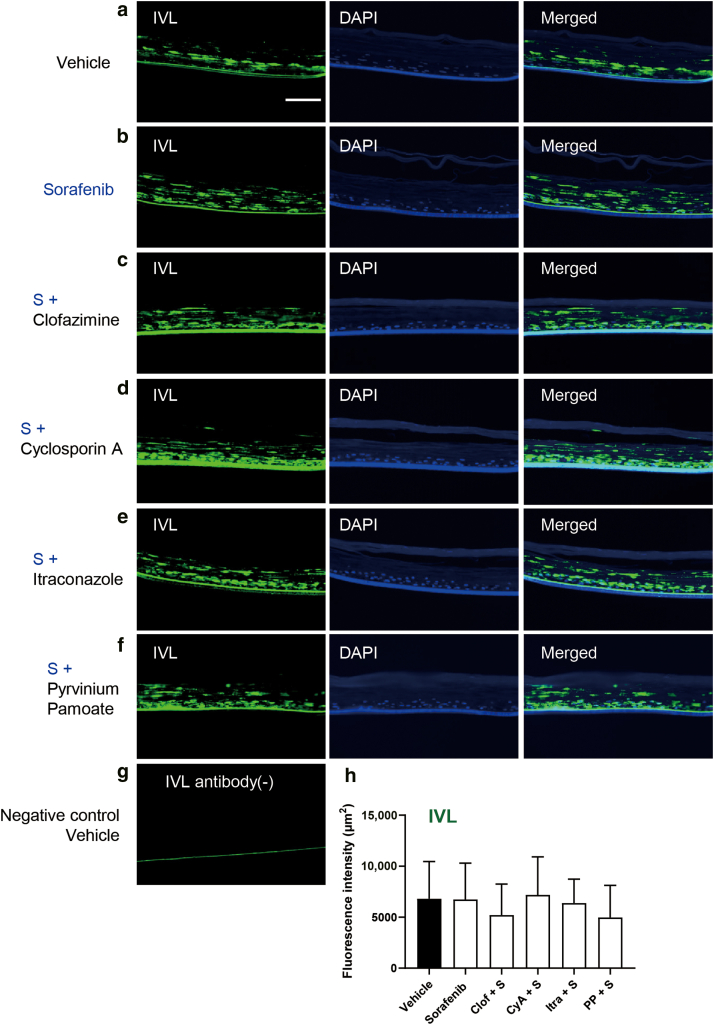
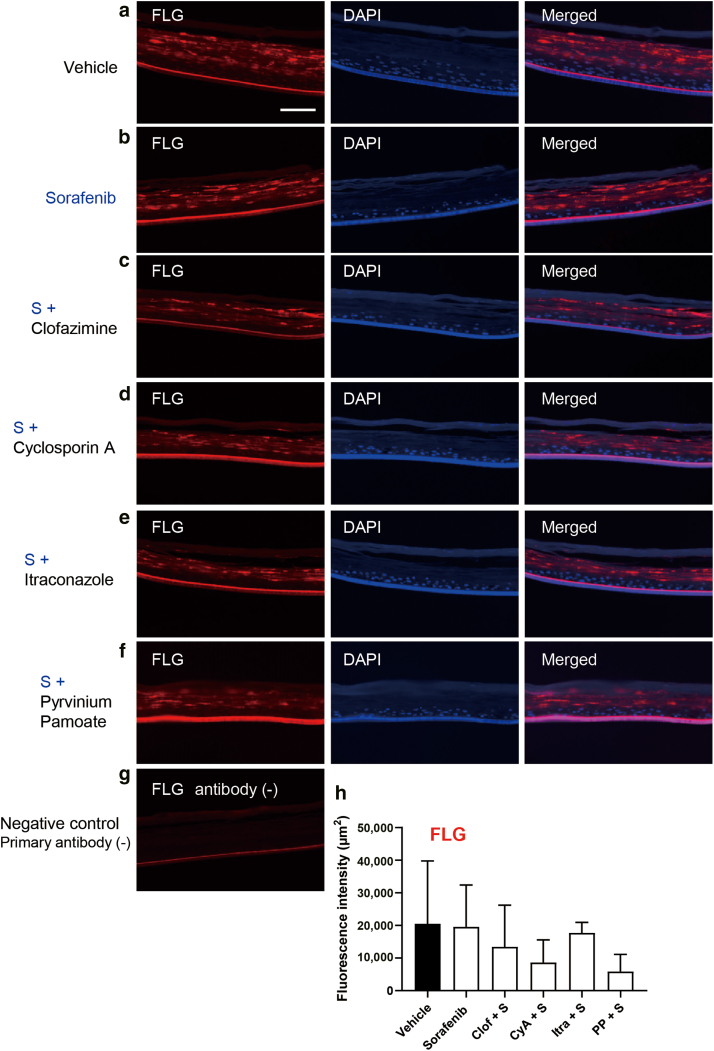
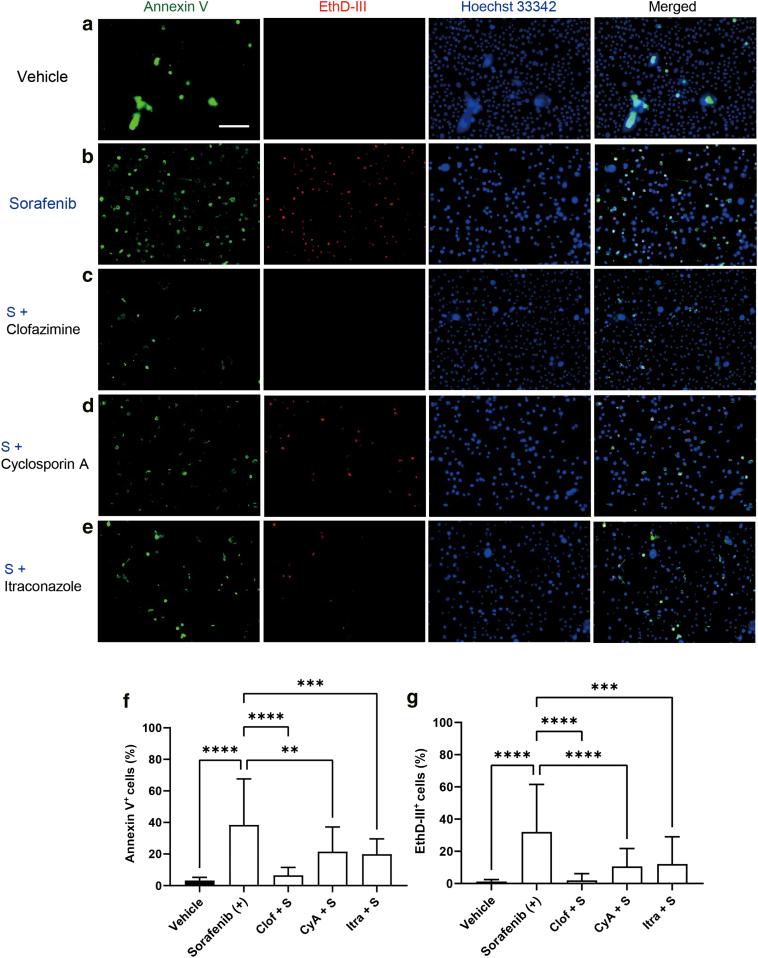
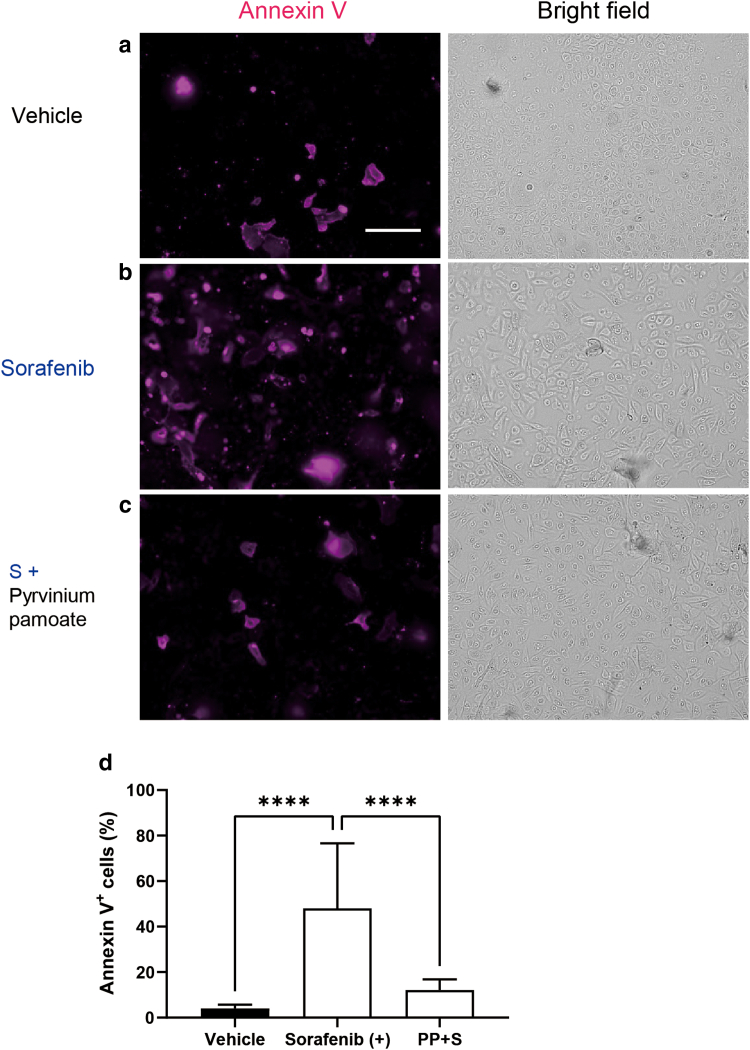
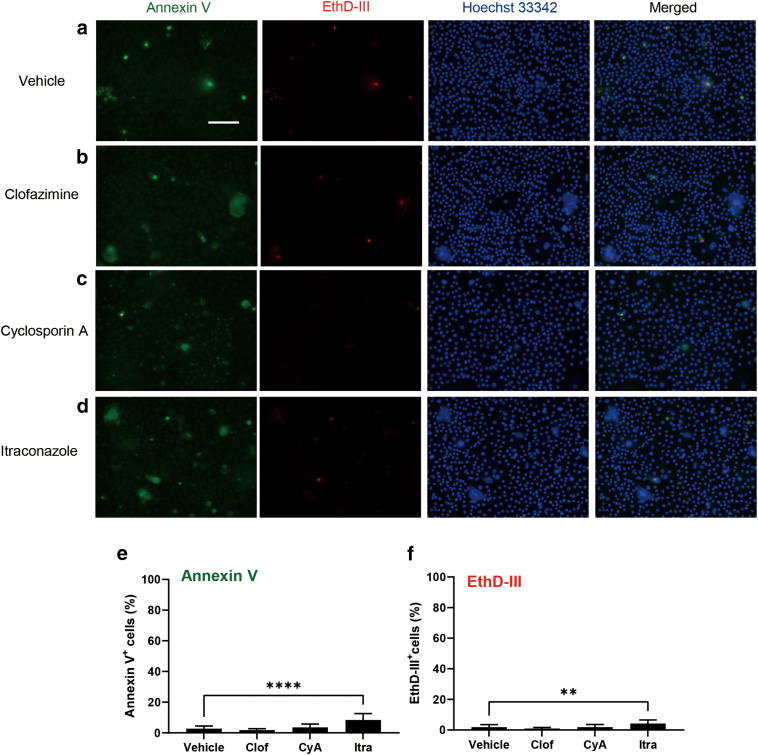
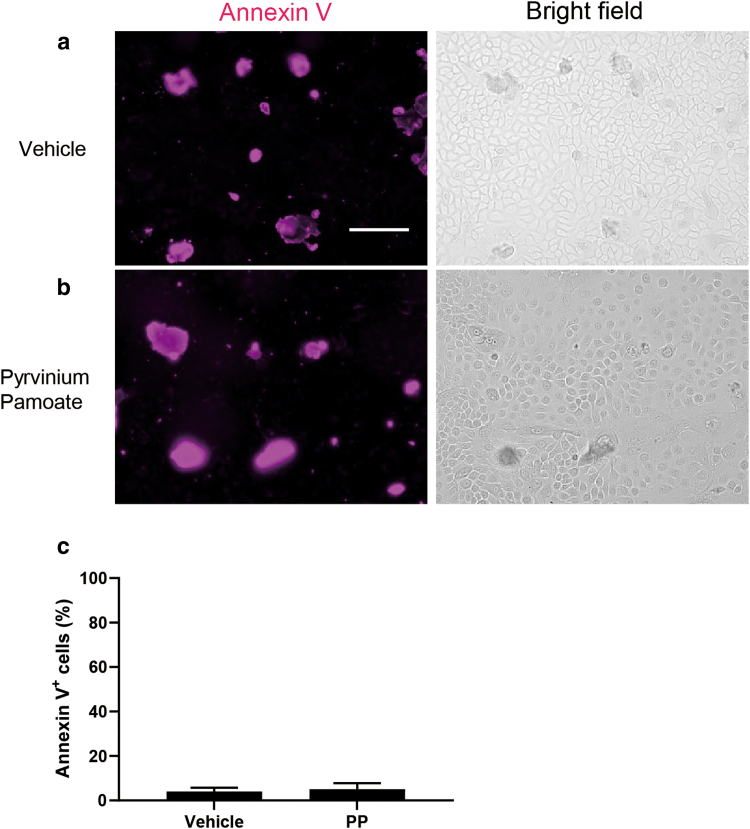
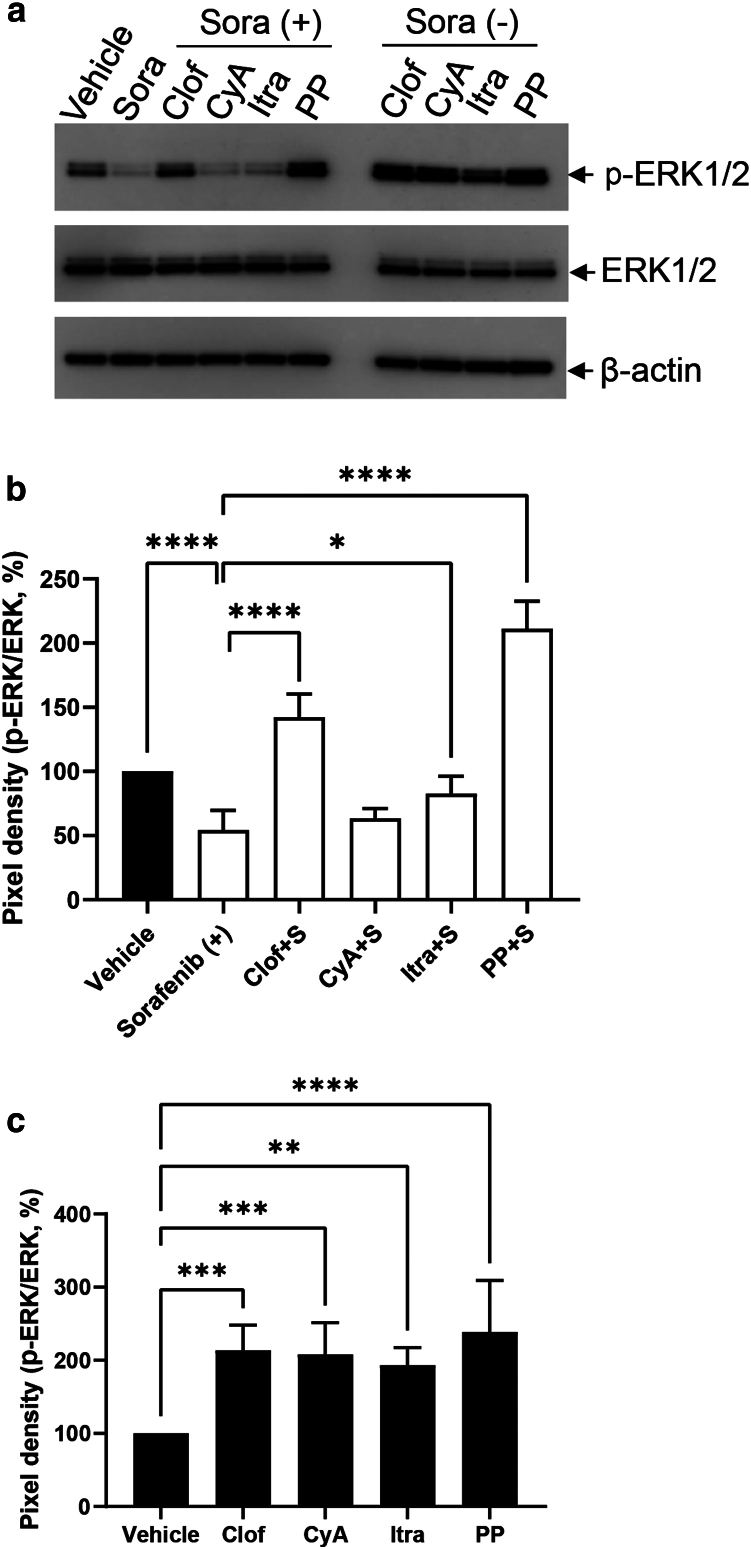
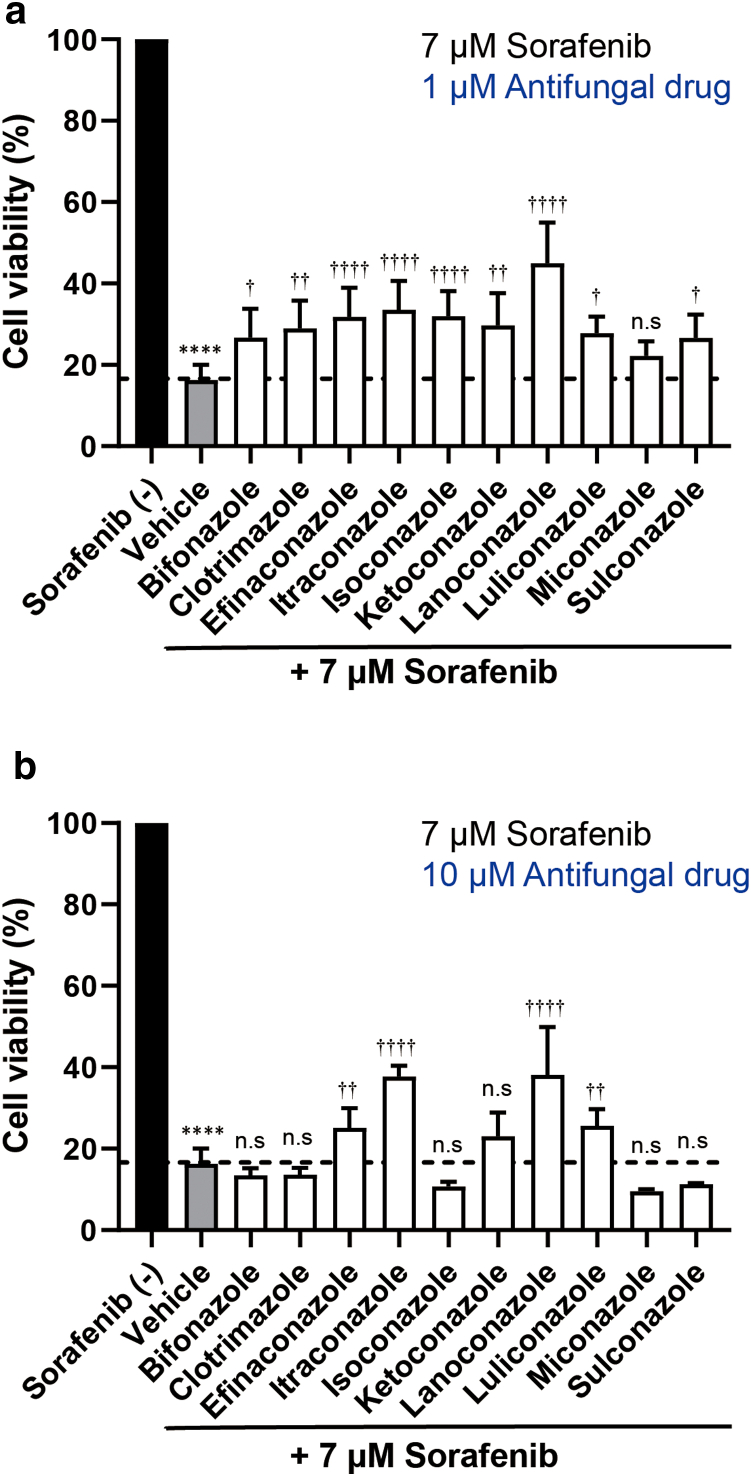
Hand-foot skin reaction is the most common adverse event of multikinase inhibitors, such as sorafenib. Although hand-foot skin reaction is not life threatening, severe cases impair quality of life because of pain and reduced activities of daily living. However, the pathological mechanisms of hand-foot skin reaction have not yet been elucidated in detail, and there is currently no effective treatment. We aimed to identify keratinocyte cytoprotectants against sorafenib toxicity. The screening of cytoprotectants against sorafenib toxicity was performed using cultured normal human epidermal keratinocytes or a reconstructed human epidermis model and off-patent approved drugs in the Prestwick Chemical library. Among 1273 drugs in the chemical library, 8 dose-dependently increased cell viability by >200% in the presence of sorafenib. In the presence of sorafenib, the number of proliferating cell nuclear antigen-positive cells was significantly higher in clofazimine-, cyclosporin A-, and itraconazole-treated reconstructed human epidermis models than in sorafenib-treated models, and candidate drugs suppressed sorafenib-induced apoptosis in normal human epidermal keratinocytes. In addition, clofazimine, itraconazole, and pyrvinium pamoate significantly recovered the phosphorylation of extracellular signal-regulated kinase 1/2 in the presence of sorafenib. Collectively, hit drugs promoted cell viability and normalized keratinocyte proliferation in the presence of sorafenib. These candidate drugs have potential as treatments for multikinase inhibitor-induced hand-foot skin reaction.

Keywords: Apoptosis; Drug development; Hand-foot skin reaction; Keratinocyte; Multikinase inhibitor.


Figures

Figure 1
Figure 1
Screening of cytoprotectants against the cytotoxicity of sorafenib in NHEKs. (a) NHEKs were incubated at 37 °C overnight with each concentration of sorafenib before CCK-8 assay. Data were evaluated by a 1-way ANOVA followed by Dunnett’s test; ∗∗∗∗P < .0001 and P < .05. (b) NHEKs were incubated at 37 °C overnight with 7 μM sorafenib and 1 μM each off-patent approved drugs before the CCK-8 assay. The black dotted line represents 100% cell viability after a single treatment with 7 μM sorafenib. The red dotted line shows the threshold (150% cell viability) for positive hit drugs. All results are presented as the mean ± SD of triplicate wells in the single plate. CCK-8, Cell Counting Kit-8; NHEK, normal human epidermal keratinocyte.
Figure 2
Figure 2
Hit drugs dose-dependently promote cell viability in the presence of sorafenib. NHEKs were incubated at 37 °C overnight with (a–h) each hit drug in the presence of 7 μM sorafenib. Cell viability was assessed by the CCK-8 assay. The black dotted line represents 100% cell viability after a single treatment with 7 μM sorafenib. The red dotted line shows the threshold (200% cell viability) for positive hit drugs. (a–h) Each graph is indicated with a plate location number. Data were evaluated by a 1-way ANOVA followed by Dunnett’s test; ∗∗∗∗P < .0001, ∗∗∗P < .001, ∗∗P < .01, and P < .05. All results are presented as the mean ± SD of triplicate wells in the single plate. CCK-8, Cell Counting Kit-8.
Figure 3
Figure 3
Second screening of hit drugs against sorafenib toxicity in NHEKs. NHEKs were incubated at 37 °C overnight with (a–g) each hit drug in the presence of 7 μM sorafenib. Cell viability was assessed by CCK-8 assay. The black dotted line represents 100% cell viability with a single treatment of 7 μM sorafenib. The red dotted line shows the threshold (200% cell viability) for positive hit drugs. Data were evaluated by a 1-way ANOVA followed by Dunnett’s test; ∗∗∗∗P < .0001, ∗∗∗P < .001, ∗∗P < .01, and P < .05. All results are presented as the means ± SD of triplicate wells in the single plate. CCK-8, Cell Counting Kit-8; NHEK, normal human epidermal keratinocyte.
Figure 4
Figure 4
Cell toxicity of hit drugs towards NHEKs in the absence of sorafenib. NHEKs incubated at 37 °C overnight with (a–o) each hit drug in the absence of sorafenib. Cell viability was assessed by the CCK-8 assay. The black dotted line is the cell viability of the vehicle represented as 100%. Data were evaluated by a 1-way ANOVA followed by Dunnett’s test; ∗∗∗∗P < .0001, ∗∗∗P < .001, ∗∗P < .01, and P < .05. All results are presented as the means ± SD of triplicate wells in the single plate. CCK-8, Cell Counting Kit-8; NHEK, normal human epidermal keratinocyte.
Figure 5
Figure 5
Cytotoxicity of sorafenib in the RHE model. (a) Schematic illustration of the RHE model. (b) Experimental schedule for the cytotoxic test. (c) Dose-dependent cytotoxicity of sorafenib toward the RHE model. Data were evaluated by a 1-way ANOVA followed by Dunnett’s test; ∗∗∗∗P < .0001 and ∗∗∗P < .001. (d–f) H&E staining of the RHE model. RHE was incubated for 96 h with medium containing (e) 40 μM sorafenib or (d) DMSO (vehicle). Bar = 50 μm. (f) Areas of vacuolation were measured using an analysis application of the BZ-X800 series. Area of vacuoles were indicated as μm2 per μm of the length of basement membrane zone and evaluated by the Student’s t-test; ∗∗∗P = .0002. The results were presented as the mean ± SD of triplicate epidermis in the same experiment. h, hour; RHE, reconstructed human epidermis.
Figure 6
Figure 6
Preliminary screening of hit drugs against sorafenib toxicity in the RHE model. RHE was incubated for 96 h in the presence of 40 μM sorafenib and/or 10 μM of the candidate drug. Cell viability was analyzed by the MTT assay. Data were evaluated by a 1-way ANOVA followed by Tukey’s multiple comparison test; ∗∗∗∗P < .0001 (vs vehicle without sorafenib, black bar) and ††††P < .0001 (vs vehicle with sorafenib, gray bar). The results are presented as the means ± SD of triplicate epidermis in the same experiment. h, hour; RHE, reconstructed human epidermis.
Figure 7
Figure 7
Detection of PCNA-positive cells in the sorafenib- and/or hit drug–treated RHE model. (a) Schematic illustration of the RHE model. (b) Experimental schedule for the screening of hit drugs. (c–i) Immunohistochemical staining of PCNA in the RHE model. Bar = 100 μm. (j) Quantification of PCNA-positive nuclei in all nuclei. PCNA-positive nuclei were manually counted and indicated as a relative value (%) of all nuclei. Relative PCNA-positive rate were indicated by the number of PCNA+ cells per μm of the length of basement membrane zone. The results are presented as the mean ± SD of triplicate epidermis in the same experiment. Data were evaluated by a 1-way ANOVA followed by Tukey’s test; ∗∗∗∗P < .0001. S denotes sorafenib, Clof denotes clofazimine, CyA denotes cyclosporin A, Itra denotes itraconazole, and PP denotes pyrvinium pamoate. h, hour; PCNA, proliferating cell nuclear antigen; RHE, reconstructed human epidermis.
Figure 8
Figure 8
Detection of PCNA-positive cells in the hit drug–treated RHE model without sorafenib. (a–e) Immunohistochemical staining of PCNA in paraffin-embedded sections of the hit drug–treated RHE model. Bar = 100 μm. (f) Quantification of PCNA-positive nuclei among all nuclei. PCNA-positive nuclei were manually counted and indicated as a relative value (%) in all nuclei per μm of the length of the basement membrane zone. The results are presented as the means ± SD of triplicate epidermis in the same experiment. Data were evaluated by a 1-way ANOVA followed by Dunnett’s multiple comparison test; ∗∗∗∗P < .0001. S denotes sorafenib, Clof denotes clofazimine, CyA denotes cyclosporin A, Itra denotes itraconazole, BMZ denotes basement membrane zone; and PP denotes pyrvinium pamoate. ns, not significant; PCNA, proliferating cell nuclear antigen; RHE, reconstructed human epidermis.
Figure 9
Figure 9
Immunohistochemical staining for K10 and K14 in the sorafenib- and/or hit drug–treated RHE model. (a–f) Immunohistochemistry for K10 and K14 in paraffin-embedded sections of the RHE model. Nuclei were counterstained with DAPI. Dual immunofluorescence was observed using the all-in-one fluorescence microscope BZ-X800. Bar = 100 μm. Red: K10, green: K14, and blue: DAPI (nuclei). (g, h) Fluorescence intensity was measured using an analysis application of the BZ-X800 series. Data were evaluated by a 1-way ANOVA followed by Tukey’s test; ∗∗∗∗P < .0001, ∗∗∗P < .001, and ∗∗P < .01. S denotes sorafenib, Clof denotes clofazimine, CyA denotes cyclosporin A, Itra denotes itraconazole, and PP denotes pyrvinium pamoate. K, keratin; ns, not significant; RHE, reconstructed human epidermis.
Figure 10
Figure 10
Immunohistochemical staining of K10 and K14 in the hit drug–treated RHE model without sorafenib. (a) The section without primary antibody (only secondary antibody) indicated as negative control. (b–f) Immunohistochemical image of K10 and K14 in paraffin-embedded sections of the RHE model. Nuclei were counterstained with DAPI. Dual immunofluorescence was observed by the all-in-one fluorescence microscope BZ-X800. Bar = 100 μm. (g, h) Fluorescence intensity was measured using an analysis application of the BZ-X800 series. The results are presented as the means ± SD of triplicate epidermisin the same experiment. Data were evaluated by a 1-way ANOVA followed by Dunnett’s multiple comparison test; ∗∗∗∗P < .0001, ∗∗∗P < .001, and ∗∗P < .01. S denotes sorafenib, Clof denotes clofazimine, CyA denotes cyclosporin A, Itra denotes itraconazole, and PP denotes pyrvinium pamoate. K, keratin; RHE, reconstructed human epidermis.
Figure 11
Figure 11
Immunohistochemical staining for loricrin in the sorafenib- and/or hit drug–treated RHE model. (a–f) Immunohistochemistry for loricrin in paraffin-embedded sections of the RHE model. Nuclei were counterstained with DAPI. Dual immunofluorescence was observed using the all-in-one fluorescence microscope BZ-X800. (g) The section without primary antibody (only secondary antibody) indicated as negative control. Bar = 100 μm. Green: loricrin, blue: DAPI (nuclei). (h) Fluorescence intensity was measured using an analysis application of the BZ-X800 series. The results are presented as the means ± SD of triplicate epidermis. Data were evaluated by a 1-way ANOVA followed by Tukey’s test; ∗∗∗∗P < .0001. S denotes sorafenib, Clof denotes clofazimine, CyA denotes cyclosporin A, Itra denotes itraconazole, PP denotes pyrvinium pamoate, and LOR denotes loricrin. RHE, reconstructed human epidermis.
Figure 12
Figure 12
Immunohistochemical staining for involucrin in the sorafenib- and/or hit drug–treated RHE model. (a–f) Immunohistochemistry for involucrin in paraffin-embedded sections of the RHE model. Nuclei were counterstained with DAPI. Dual immunofluorescence was observed using the all-in-one fluorescence microscope BZ-X800. (g) The section without primary antibody (only secondary antibody) indicated as negative control. Bar = 100 μm. Green: involucrin, blue: DAPI (nuclei). (h) Fluorescence intensity was measured using an analysis application of the BZ-X800 series. The results are presented as the means ± SD of triplicate epidermis. Data were evaluated by a 1-way ANOVA followed by Tukey’s test; ∗∗∗∗P < .0001. S denotes sorafenib, Clof denotes clofazimine, CyA denotes cyclosporin A, Itra denotes itraconazole, PP denotes pyrvinium pamoate, and IVL denote: involucrin. RHE, reconstructed human epidermis.
Figure 13
Figure 13
Immunohistochemical staining for FLG in the sorafenib- and/or hit drug–treated RHE model. (a–f) Immunohistochemistry for FLG in paraffin-embedded sections of the RHE model. Nuclei were counterstained with DAPI. Dual immunofluorescence was observed using the all-in-one fluorescence microscope BZ-X800. (g) The section without primary antibody (only secondary antibody) indicated as negative control. Bar = 100 μm. Red: FLG, blue: DAPI (nuclei). (h) Fluorescence intensity was measured using an analysis application of the BZ-X800 series. The results are presented as the means ± SD of triplicate epidermis. Data were evaluated by a 1-way ANOVA followed by Tukey’s test; ∗∗∗∗P < .0001. S denotes sorafenib, Clof denotes clofazimine, CyA denotes cyclosporin A, Itra denotes itraconazole, and PP denotes pyrvinium pamoate. RHE, reconstructed human epidermis.
Figure 14
Figure 14
Apoptosis assay of sorafenib- and/or hit drug–treated NHEK. NHEKs were incubated with (a) DMSO (vehicle), (b) 7 μM sorafenib, and (c) 1 μM clofazimine, (d) cyclosporin A, or (e) itraconazole. After overnight incubation, the cells were stained by FITC-annexin V (green), EthD-III (red), and Hoechst 33342 (blue) and observed and analyzed by fluorescence microscope BZ-X800 and its analysis application. Cell numbers were counted in 16 random fields of view per group. (f, g) Relative ratio (%) of (f) annexin V and (g) EthD-III–positive cells. The results are presented as the mean ± SD. Data were evaluated by 1-way ANOVA followed by Tukey’s test; ∗∗∗∗P < .0001, ∗∗∗P < .001, and ∗∗P < .01. S denotes sorafenib, Clof denotes clofazimine, CyA denotes cyclosporine A, and Itra denotes itraconazole. Bar = 100 μm. EthD-III, ethidium homodimer III; NHEK, normal human epidermal keratinocyte.
Fig. 15
Fig. 15
Detection of autofluorescence of sorafenib and hit drugs using DAPI, GFP, and Texas Red filters. NHEKs were incubated with (a) 7 μM sorafenib, (b) 1 μM clofazimine, (c) cyclosporin A, (d) itraconazole, or (c) pyrvinium pamoate. After overnight incubation, the cells were observed without staining by fluorescence microscope BZ-X800. We used filters: DAPI (Ex 360 nm/Em 460 nm), GFP (Ex 470 nm/Em 525 nm), and Texas Red (Ex 560 nm/Em 630 nm). No filter: bright field. Bar = 100 μm. Em, emission wavelength; Ex, excitation wavelength; NHEK, normal human epidermal keratinocyte.
Figure 16
Figure 16
Detection of autofluorescence of sorafenib and hit drugs using Cy5 filter. NHEKs were incubated with (a) 7 μM sorafenib, (b) 1 μM clofazimine, (c) cyclosporin A, (d) itraconazole, or (c) pyrvinium pamoate. After overnight incubation, the cells were observed without staining by fluorescence microscope BZ-X800. We used filters: Cy5 (Ex 640 nm/Em 690 nm). No filter: bright field. Bar = 100 μm. Em, emission wavelength; Ex, excitation wavelength; NHEK, normal human epidermal keratinocyte.
Figure 17
Figure 17
Apoptosis assay of sorafenib- and/or pyrvinium pamoate–treated NHEK. NHEKs were incubated with (a) DMSO (vehicle), (b) 7 μM sorafenib, and/or (c) 1 μM pyrvinium pamoate. After overnight incubation, the cells were stained by Annexin V–conjugated Alexa Fluor 647 (violet) and observed and analyzed by fluorescence microscope BZ-X800 and its analysis application. Annexin V–positive cell numbers were counted in 16 random fields of view per group. The number of whole cells in a bright field was counted by manual handling. (d) Relative ratio (%) of annexin V–positive cells. The results were presented as the mean ± SD. Data were evaluated by 1-way ANOVA followed by Tukey’s test; ∗∗∗∗P < .0001. S denotes sorafenib, and PP denotes pyrvinium pamoate. Bar = 100 μm. NHEK, normal human epidermal keratinocyte.
Figure 18
Figure 18
Apoptosis assay of hit drugs treated NHEK. NHEKs were incubated with (a) DMSO (vehicle), (b) 1 μM clofazimine, (c) cyclosporin A, or (d) itraconazole. After overnight incubation, the cells were stained by FITC-annexin V (green), EthD-III (red), and Hoechst 33342 (blue) and observed and analyzed by fluorescence microscope BZ-X800 and its analysis application. Cell numbers were counted in 16 random fields of view per group. (e, f) Relative ratio (%) of (f) annexin V– and (g) EthD-III–positive cells. The results are presented as the means ± SD. Data were evaluated by 1-way ANOVA followed by Dunnett’s test; ∗∗∗∗P < .0001 and ∗∗P < .01. Clof denotes clofazimine, CyA denotes cyclosporine A, and Itra denotes itraconazole. Bar = 100 μm. EthD-III, ethidium homodimer III; NHEK, normal human epidermal keratinocyte.
Figure 19
Figure 19
Apoptosis assay of pyrvinium pamoate treated NHEK. NHEKs were incubated with (a) DMSO (vehicle) and (b) 1 μM pyrvinium pamoate. After overnight incubation, the cells were stained by annexin V–conjugated Alexa Fluor 647 (violet) and observed and analyzed by fluorescence microscope BZ-X800 and its analysis application. Annexin V–positive cell numbers were counted in 16 random fields of view per group. The number of whole cells in a bright field was counted by manual handling. (f) Relative ratio (%) of annexin V–positive cells. The results are presented as the means ± SD. Data were evaluated by 1-way ANOVA followed by Dunnett’s test. S denotes sorafenib, and PP denotes pyrvinium pamoate. Bar = 100 μm. NHEK, normal human epidermal keratinocyte.
Figure 20
Figure 20
Western blot analysis of ERK1/2 phosphorylation in NHEKs. NHEKs were incubated with DMSO (vehicle), 7 μM sorafenib, 1 μM clofazimine, cyclosporin A, itraconazole, or pyrvinium pamoate. After preincubation for 1 h, the cell lysates were prepared, and western blotting was performed. (a) Western blot images of the p-ERK1/2, ERK1/2, and β-actin (internal control). Protein contents of all samples were set at 5 μg/lane. (b, c) Bands were semiquantified by ImageJ. Data were indicated as a relative ratio of p-ERK/ERK. The results are presented as the mean ± SD of separately triplicate experiments. Data were evaluated by 1-way ANOVA followed by Tukey’s test; ∗∗∗∗P < .0001, ∗∗∗P < .001, ∗∗P < .01, and P < .05. S denotes sorafenib, Clof denotes clofazimine, CyA denotes cyclosporin A, and PP denotes pyrvinium pamoate. ERK, extracellular signal–regulated kinase; h, hour; NHEK, normal human epidermal keratinocyte; p-ERK, phosphorylated extracellular signal–regulated kinase.
Figure 21
Figure 21
Effect of azole antifungal drugs against sorafenib toxicity in NHEKs. NHEKs were incubated at 37 °C overnight with (a) 1 μM or (b) 10 μM azole antifungal agent in the presence of 7 μM sorafenib. Cell viability was assessed by CCK-8 assay. The dashed lines indicate 17% cell viability with a single treatment of 7 μM sorafenib. Data were evaluated using 1-way ANOVA followed by Tukey’s test; ∗∗∗∗P < .0001 (vs vehicle without sorafenib) and ††††P < .0001, ††P < .01, and P < .05 (vs vehicle in the presence of 7 μM sorafenib). All results are presented as the means ± SD of triplicate experiments. CCK-8, Cell Counting Kit-8; NHEK, normal human epidermal keratinocyte; ns, not significant.
Figure 22
Figure 22
Immunohistochemical staining for K6A in sorafenib-treated RHE model. (a, b) Immunohistochemistry for K6A in paraffin-embedded sections of the RHE model. Nuclei were counterstained with DAPI. Dual immunofluorescence was observed using the all-in-one fluorescence microscope BZ-X800. Bar = 100 μm. Green: K6A, blue: DAPI (nuclei). (c) Fluorescence intensity was measured using an analysis application of the BZ-X800 series. The results are presented as the means ± SD of triplicate epidermis. Data were evaluated by a 1-way ANOVA followed by Student’s t-test. K6A, keratin 6A; RHE, reconstructed human epidermis.

Similar articles

Cited by

References

    1. Adnane L., Trail P.A., Taylor I., Wilhelm S.M. Sorafenib (BAY 43-9006, Nexavar), a dual-action inhibitor that targets RAF/MEK/ERK pathway in tumor cells and tyrosine kinases VEGFR/PDGFR in tumor vasculature. Methods Enzymol. 2006;407:597–612. - PubMed
    1. Ahmadi A., Mohammadnejadi E., Karami P., Razzaghi-Asl N. Current status and structure activity relationship of privileged azoles as antifungal agents (2016–2020) Int J Antimicrob Agents. 2022;59 - PubMed
    1. Amor K.T., Ryan C., Menter A. The use of cyclosporine in dermatology: part I. J Am Acad Dermatol. 2010;63:925–946. quiz 947. - PubMed
    1. Ancker O.V., Krüger M., Wehland M., Infanger M., Grimm D. Multikinase inhibitor treatment in thyroid cancer. Int J Mol Sci. 2019;21:10. - PMC - PubMed
    1. Arbiser J.L., Moschella S.L. Clofazimine: a review of its medical uses and mechanisms of action. J Am Acad Dermatol. 1995;32:241–247. - PubMed

LinkOut - more resources