. 2024 Mar 25;24(7):2985-3001.
doi: 10.1021/acs.cgd.4c00087. eCollection 2024 Apr 3.

7.10 MAG. A Novel Host Monoacylglyceride for In Meso (Lipid Cubic Phase) Crystallization of Membrane Proteins

Affiliations

7.10 MAG. A Novel Host Monoacylglyceride for In Meso (Lipid Cubic Phase) Crystallization of Membrane Proteins

Pawel Krawinski et al. Cryst Growth Des. .

Abstract

A novel monoacylglycerol, 7.10 MAG, has been produced for use in the in meso (lipid cubic phase) crystallization of membrane proteins and complexes. 7.10 MAG differs from monoolein, the most extensively used lipid for in meso crystallization, in that it is shorter in chain length by one methylene and its cis olefinic bond is two carbons closer to the glycerol headgroup. These changes in structure alter the phase behavior of the hydrated lipid and the microstructure of the corresponding mesophases formed. Temperature-composition phase diagrams for 7.10 MAG have been constructed using small- and wide-angle X-ray scattering over a range of temperatures and hydration levels that span those used for crystallization. The phase diagrams include lamellar crystalline, fluid isotropic, lamellar liquid-crystalline, cubic-Ia3d, and cubic-Pn3m phases, as observed with monoolein. Conspicuous by its absence is the inverted hexagonal phase which is rationalized on the basis of 7.10 MAG's chemical constitution. The cubic phase prepared with the new lipid facilitates the growth of crystals that were used to generate high-resolution structures of intramembrane β-barrel and α-helical proteins. Compatibility of fully hydrated 7.10 MAG with cholesterol and phosphatidylcholine means that these two lipids can be used as additives to optimize crystallogenesis in screening trials with 7.10 MAG as the host lipid.


Conflict of interest statement

The authors declare no competing financial interest.

Figures

Figure 1
Figure 1
N.T matrix showing the total and unique number of membrane protein crystal structures solved using different N.T MAGs. The numbers in the unshaded regions correspond to the total number of protein structures in the Protein Data Bank (RCSB.org) attributed to a particular N.T MAG. The numbers in the shaded regions correspond to the unique number of protein structures in the PDB attributed to a particular N.T MAG. Analysis of the PDB was performed on 9th January 2024. The structure above the matrix explains the N.T. notation used to describe the host MAG lipids. The data shown for 7.10 MAG were derived from the current study. The asterisk is to alert the reader that while three membrane protein structures (AlgE, Lnt, and A2aR) were solved using crystals grown in 7.10 MAG, a fourth protein, the bacterial diacylglycerol kinase, DgkA, was crystallized in this MAG and the crystals diffracted to 3.5 Å. However, a structure has not yet been determined for DgkA.
Figure 2
Figure 2
Diffraction patterns of the different solid, liquid, and liquid-crystalline phases observed for 7.10 MAG at different hydration levels and different temperatures. (A–I). 2D diffraction patterns. (A) 7.10 MAG at 15% (w/w) water and 5 °C in the Lc phase. WAXS and SAXS. (B) 7.10 MAG at 10% (w/w) water and 25 °C in the Lα phase. WAXS and SAXS. (C) 7.10 MAG at 5% (w/w) water and 95 °C in the FI phase. WAXS and SAXS. (D) 7.10 at 35% (w/w) water and 25 °C in the Ia3d phase. WAXS and SAXS. (E) 7.10 MAG at 60% (w/w) water and 25 °C in the cubic-Pn3m phase. WAXS and SAXS. (F) 7.10 MAG at 35% (w/w) water and 25 °C in the cubic-Ia3d phase. SAXS. (G). 7.10 MAG at 60% (w/w) water and 25 °C in the cubic-Pn3m phase. SAXS. (H). 7.10 MAG at 30% (w/w) water and 25 °C in the cubic-Ia3d phase. SAXS, spotty pattern. (I). 7.10 MAG at 45% (w/w) water and 25 °C in the cubic-Pn3m phase. SAXS, spotty pattern. (J–L) I–2θ plots along with phase identification, indexing, and lattice parameter determination as insets. (J) 7.10 MAG at 15% (w/w) water and 25 °C in the Lα phase. (K) 7.10 MAG at 30% (w/w) water and 27 °C in the Ia3d phase. (L). 7.10 MAG at 40% (w/w) water and 25 °C in the Pn3m phase. Key: d(hkl), experimentally determined d-spacing value; h, k, l, Miller indices of Bragg reflections. The slope of the line of best fit is the lattice parameter of the phase with the corresponding values of 38.8, 122.1, and 93.0 Å for the Lα, cubic-Ia3d, and cubic-Pn3m phases, respectively.
Figure 3
Figure 3
Operational phase diagram for the 7.10 MAG/water system. Phases were identified by SAXS and WAXS measurements recorded in the cooling (blue arrow) and heating (red arrow) directions from ∼25 °C (dark dashed horizontal line). The identity of each of the phases is as follows: (□) Lc, (○) Lα, (◊) cubic-Ia3d, (△) cubic-Pn3m, and (+) FI. Temperature readings are reliable to ±1 °C. The maximum hydration boundaries for the cubic-Pn3m and FI phases are estimated and are shown as dashed lines. Spontaneous transitioning from an undercooled Lα phase to a more stable Lc phase likely occurred in the 20% (w/w) water sample in the 10 to −5 °C range (dashed red lines). Phase boundaries are approximate and have been drawn to guide the eye.
Figure 4
Figure 4
Evidence that fully hydrated 7.10 MAG does not form the HII phase and that it transitions directly from the cubic-Pn3m to the FI phase with increasing temperature. Under these conditions, the transition begins at ∼100 °C and is complete by ∼103 °C (shaded region) at an average heating rate of 6 °C/h. Data shown are the structure parameters of the cubic-Pn3m (△) and FI (+) phases. The sample used in this measurement was prepared with 60% (w/w) water.
Figure 5
Figure 5
Dependence of the structure parameters of the phases formed by the 7.10 MAG/water system on temperature (A) and water content (B) recorded in the heating direction from 25 to 105 °C. Samples were prepared and stored at RT until used in this heating study. The identity of each of the phases is as follows: (□) Lc, (○) Lα, (◊) cubic-Ia3d, (△) cubic-Pn3m, and (+) FI.
Figure 6
Figure 6
Dependence of the lattice parameters of the phases formed by the 7.10 MAG/water system on temperature (A) and water content (B) recorded in the cooling direction from 25 to −5 °C. Samples were prepared and stored at RT until used in this cooling study. The identity of each of the phases is as follows: (□) Lc, (○) Lα, (◊) cubic-Ia3d, (△) cubic-Pn3m, and (+) FI.
Figure 7
Figure 7
Phase behavior of the 7.10 MAG/water system recorded in the heating direction under approach-to-equilibrium conditions. Phases were identified by SAXS measurements on homogeneous lipid/water samples quenched to liquid nitrogen temperatures and held at −5 °C for 40 min before being heated in steps of 2 °C with incubation times of 20 min at each temperature. Solid lines correspond to phase boundaries as defined by the SAXS and WAXS data. Dashed lines correspond to boundaries that are assumed to exist on the basis of data collected on related systems and on the Gibbs phase rule. No attempt has been made to conform to the phase rule in the boxed region of the diagram (red dotted box) which is expected to have many areas of phase coexistence based on the observations made with the related system. The identity of each of the phases is as follows: (□) Lc, (□) Lc plus ice, (○) Lα, (◊) cubic-Ia3d, (Δ) cubic-Pn3m, and (+) FI. Symbols with shading indicate the presence of trace amounts of an unidentified phase or phases.
Figure 8
Figure 8
Dependence of the lattice parameters of the phases formed by the 7.10 MAG/water system on temperature and water content under approach-to-equilibrium data collection conditions. Lattice parameters were determined based on SAXS measurements recorded in the heating direction from −5 to 65 °C following sample quenching to liquid nitrogen temperatures and incubation at −5 °C for 40 min. The identity of each of the phases is as follows: (□) Lc, (□) Lc plus ice, (○) Lα, (◊) cubic-Ia3d, (△) cubic-Pn3m, and (+) FI. Symbols with shading indicate the presence of trace amounts of an unidentified phase or phases.
Figure 9
Figure 9
Compatibility of the lipid cubic phase formed by 7.10 MAG with cholesterol. Mixtures of 7.10 MAG and cholesterol were used to form mesophase samples with a water content of 60 (w/w) at 20 °C. Following SAXS measurements for phase identification and microstructure determination at 25 °C, the samples were cooled and incubated at 20, 15, 10, 5, and 0 °C for 30 min before being used for separate rounds of SAXS measurements. Phase lattice parameters are shown as a function of temperature in the cooling direction (A) and as a function of cholesterol concentration (B). The identity of each of the phases is as follows: (Δ) cubic-Pn3m, and (x) crystalline cholesterol.
Figure 10
Figure 10
Compatibility of the lipid cubic phase formed by 7.10 MAG with DOPC. Mixtures of 7.10 MAG and DOPC were used to form mesophase samples with a water content of 60% (w/w) at 20 °C. Following SAXS measurements for phase identification and microstructure determination at 25 °C, the samples were cooled and incubated at 20, 15, 10, 5, and 0 °C for 30 min before being used for separate rounds of SAXS measurements. Phase lattice parameters are shown as a function of temperature in the cooling direction (A) and as a function of cholesterol concentration (B). The identity of each of the phases is as follows: (Δ) cubic-Pn3m.
Figure 11
Figure 11
Effect of AlgE and Lnt and their solubilizing buffers on the lattice parameter of the cubic-Pn3m phase formed when combined with 7.10 MAG. The lattice parameters are the average of measurements made on duplicate samples.
Figure 12
Figure 12
Crystals of AlgE (left), Lnt (middle) and A2aR (right) grown in 7.10 MAG at 20 °C. AlgE crystals, grown in 100 mM sodium citrate pH 5.6, 25–300 mM (NH4)2SO4 and 34–41% (v/v) PEG400 for 30 days show the usual ziggurat arrangement. Lnt crystals, grown for 30 days in 100 mM MES at pH 6.0, 8% (v/v) MPD, and either sodium or potassium thiocyanate from 50 to 400 mM, also display the expected bullet or rice shape. A2aR crystals grew as needles in 30–35.5% (v/v) PEG400, 50 mM sodium thiocyanate, 100 mM sodium citrate at pH 5, 0.2% (v/v) 2,5-hexanediol, and 25 μM ZM241385 and were harvested after 14 days.
Figure 13
Figure 13
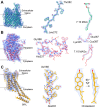
X-ray structures and corresponding electron density of AlgE, Lnt and A2aR obtained using crystals grown by the in meso method in 7.10 MAG. Electron density is displayed in mesh representation as follows: blue mesh––2Fo-Fc map contoured at 1.5 σ; green mesh––Fo-Fc map contoured at 3 σ; and red mesh––Fo-Fc map contoured at −3 σ. All maps are carved 1.6 Å from the shown atoms. (A) Left: AlgE structure. Middle: β-Strand L272-T282. Right: A 7.10 MAG molecule. (B) Left: Lnt structure. Middle: Arm 3 (residues H337-G368). Right: active site residues E267, K335 and C387, with two 7.10 MAG molecules in the binding pocket. (C) Left: A2aR-BRIL structure. Middle: α-Helix V188-A203. Right: cholesterol molecule bound to A2aR in two views 90° apart.

References

    1. Petsko A. G.; Ringe D.. Protein Structure and Function; New Science Press: London, 2003.
    1. Luzzati V.Biological Membranes. Physical Fact and Function; Academic Press: London, 1968.
    1. Shipley G.Recent X-ray Diffraction Studies of Biological Membranes and Membrane Components; Academic Press: New York, 1973.
    1. Laughlin R. G. The use and utility of phase science. J. Chem. Educ. 1992, 69, 26.10.1021/ed069p26. - DOI
    1. Laughlin R. G.The Aqueous Phase Behavior of Surfactants; Academic Press, 1994.

LinkOut - more resources