[Preprint]. 2024 Mar 27:2024.03.25.586715.
doi: 10.1101/2024.03.25.586715.

Multifaceted roles of cohesin in regulating transcriptional loops

Affiliations

Multifaceted roles of cohesin in regulating transcriptional loops

Minji Kim et al. bioRxiv. .

Abstract

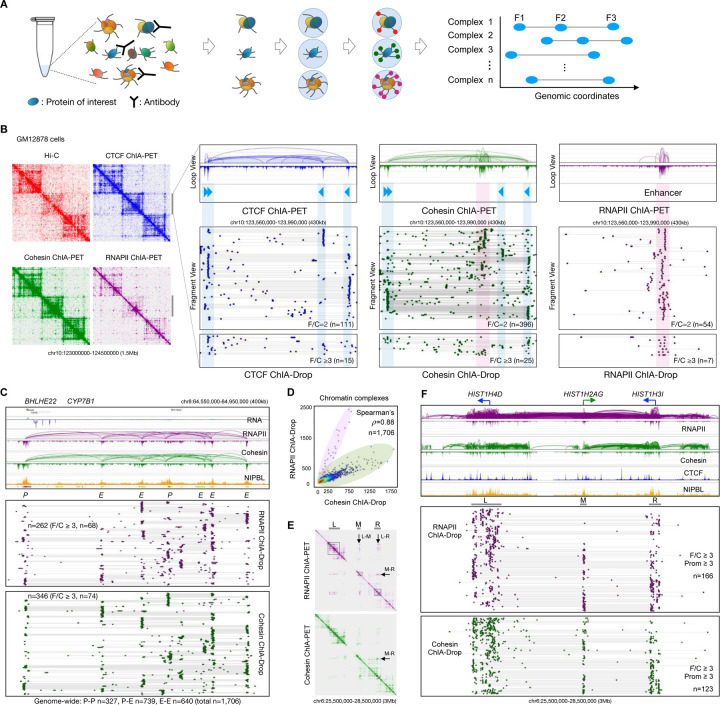
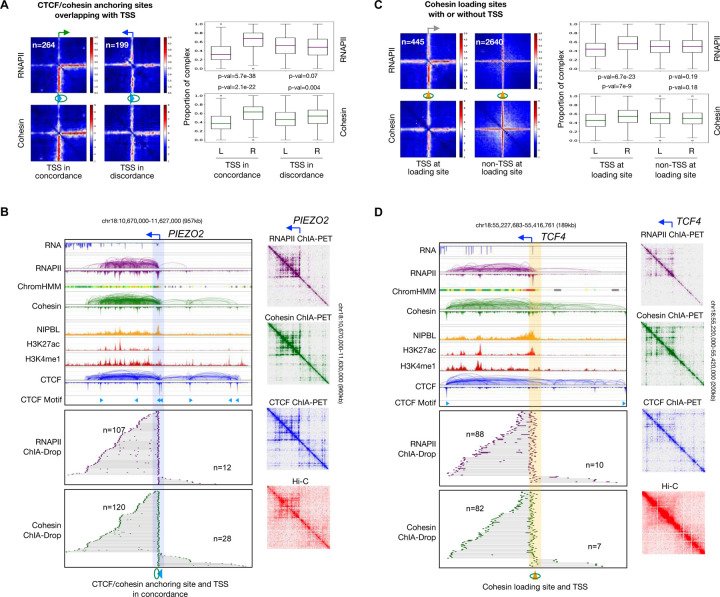
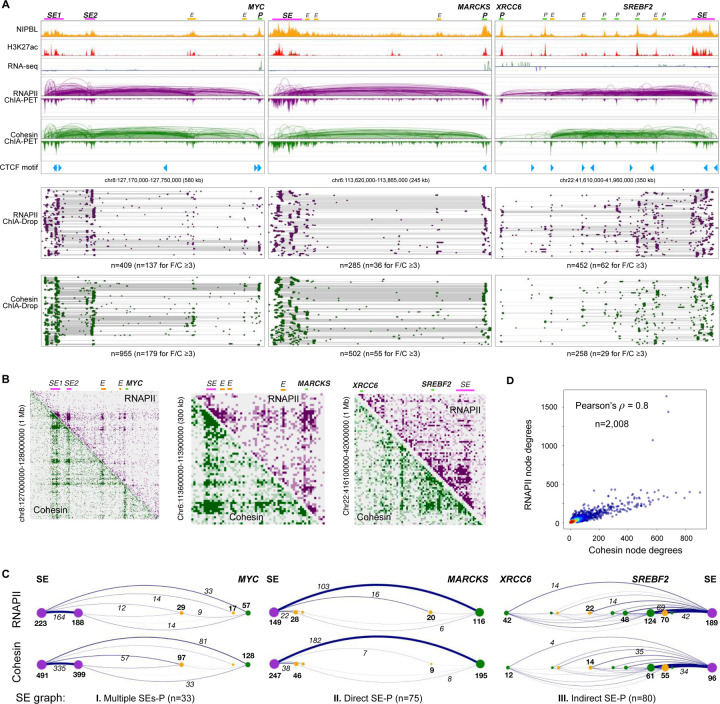
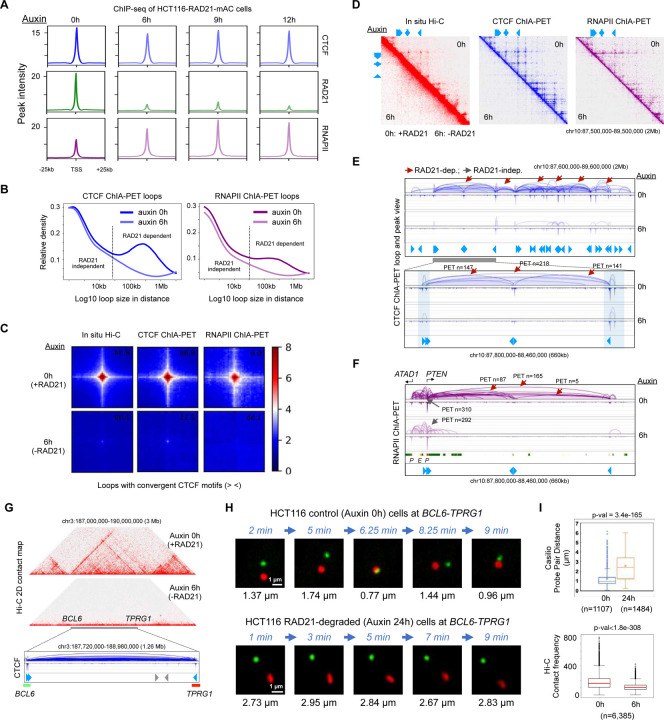
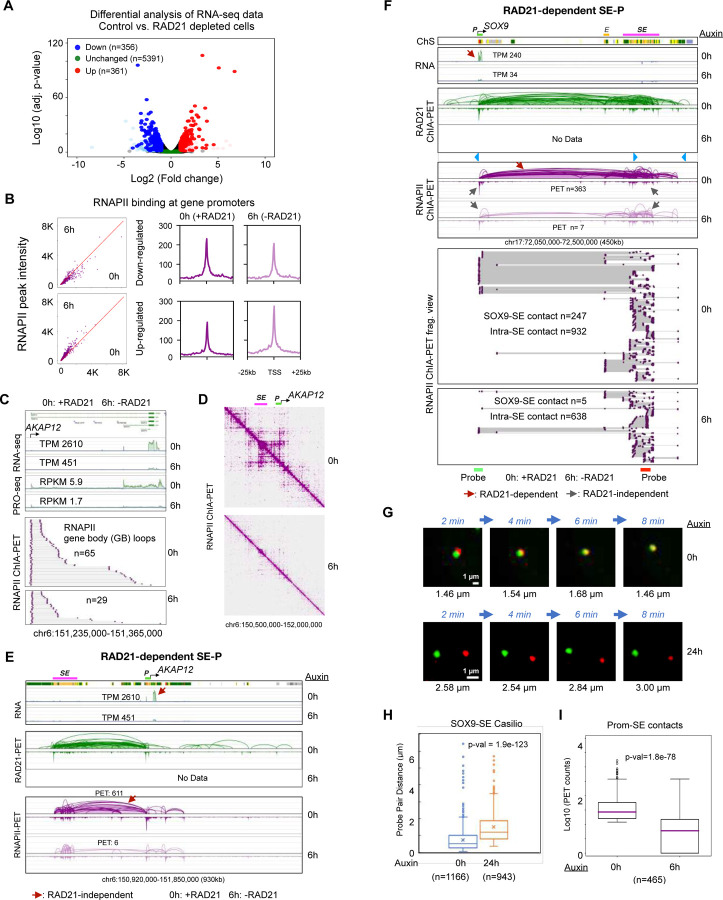
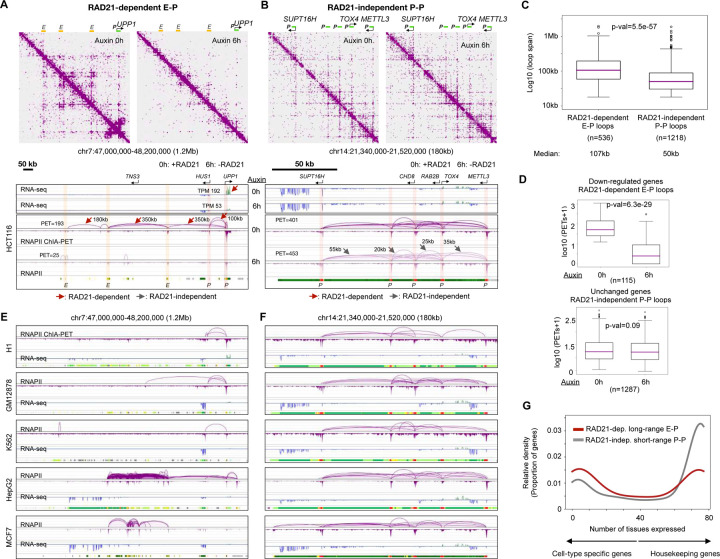
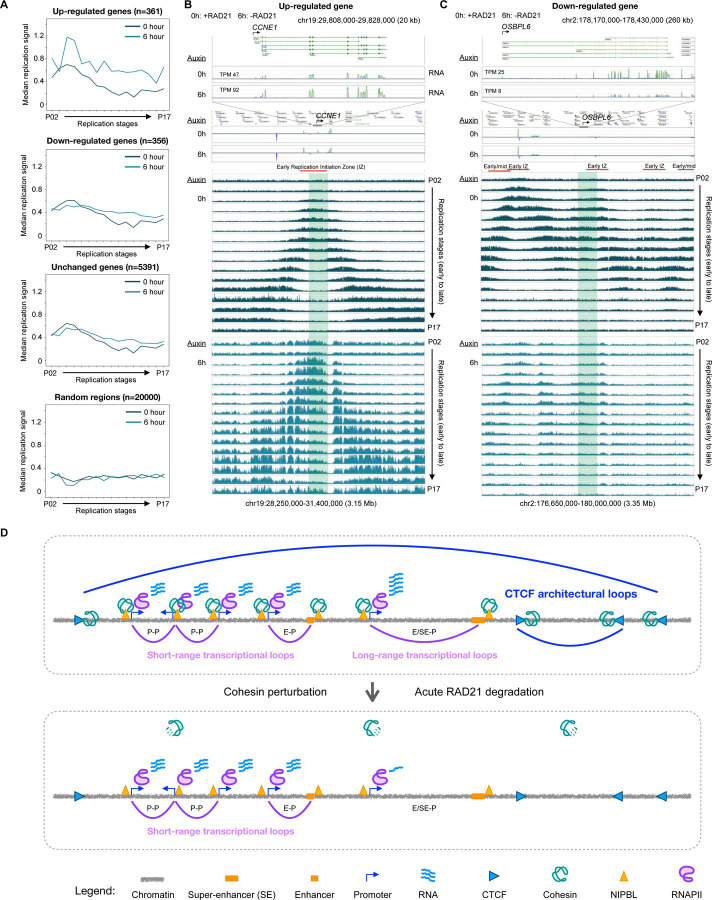
Cohesin is required for chromatin loop formation. However, its precise role in regulating gene transcription remains largely unknown. We investigated the relationship between cohesin and RNA Polymerase II (RNAPII) using single-molecule mapping and live-cell imaging methods in human cells. Cohesin-mediated transcriptional loops were highly correlated with those of RNAPII and followed the direction of gene transcription. Depleting RAD21, a subunit of cohesin, resulted in the loss of long-range (>100 kb) loops between distal (super-)enhancers and promoters of cell-type-specific genes. By contrast, the short-range (<50 kb) loops were insensitive to RAD21 depletion and connected genes that are mostly housekeeping. This result explains why only a small fraction of genes are affected by the loss of long-range chromatin interactions due to cohesin depletion. Remarkably, RAD21 depletion appeared to up-regulate genes located in early initiation zones (EIZ) of DNA replication, and the EIZ signals were amplified drastically without RAD21. Our results revealed new mechanistic insights of cohesin's multifaceted roles in establishing transcriptional loops, preserving long-range chromatin interactions for cell-specific genes, and maintaining timely order of DNA replication.

Keywords: 3D genome mapping; Cohesin; RNAPII; auxin-inducible degron (AID); chromatin loop formation; live-cell imaging; multiplex chromatin interaction; super-enhancers; transcription regulation.


Conflict of interest statement

DECLARATION OF INTERESTS The authors declare no competing interests.

Figures

Figure 1:
Figure 1:. ChIA-Drop data for mapping chromatin interactions mediated by CTCF, cohesin, and RNAPII.
(A) A brief schematic of ChIA-Drop, which encapsulates ChIP-enriched samples of chromatin complexes into individual droplets with unique barcodes for obtaining single-molecule multiplex chromatin interactions via DNA sequencing and mapping analysis. Each ChIA-Drop complex contains multiple fragments (in blue ovals F1, F2, F3) connected by a straight line. (B) 2D contact matrices of Hi-C, CTCF, cohesin, and RNA Polymerase II (RNAPII) ChIA-PET data at a 1.5 Mb region. Corresponding ChIA-PET loops and peaks at a further zoomed-in 430kb region are included as references (top panels). CTCF binding motifs in CTCF and cohesin data tracks are marked with light blue arrows indicating the binding motif orientation. Below in the bottom panels, fragment views show detailed chromatin interactions by ChIA-Drop data, where each row of dots and a connecting line represents a putative chromatin complex with ≥ 2 interacting fragments; pairwise (fragments per complex (F/C) = 2) and multi-way (F/C ≥ 3) interactions are presented separately with the number of complexes in each category denoted as n. CTCF-enriched and RNAPII-enriched regions are highlighted in blue and purple, respectively. (C) An example of a chromatin domain. Top tracks are RNA-seq, RNAPII and cohesin ChIA-PET loops/peaks, NIPBL ChIP-seq, and ChromHMM states promoters (P) and enhancers (E). Lower tracks are chromatin fragment views of RNAPII and cohesin ChIA-Drop complexes with two or more (≥ 2) enhancers (E) and promoters (P) simultaneously connected by RNAPII and cohesin ChIA-Drop complexes, with their numbers recorded as n. (D) A scatter plot of RNAPII and cohesin ChIA-Drop chromatin complexes co-localized at 1,706 loci, a subset of which exhibit significantly higher RNAPII counts than cohesin (highlighted in purple) and deviate from the main trajectory of other chromatin loci (highlighted in green). (E) The histone gene cluster (HIST1) on chromosome 6 is organized into left (L), middle (M), and right (R) regions. The 2D pairwise contact map of RNAPII ChIA-PET data (purple) have inter-region interactions as indicated by arrows for clusters L-M, L-R, and M-R, while the cohesin ChIA-PET data (green) show relatively weak inter-region signals. (F) Detailed browser views of the 3 Mb chromatin domain harboring histone gene clusters. Top tracks: RNAPII and cohesin ChIA-PET loops/peaks and CTCF and NIPBL ChIP-seq peaks. Bottom tracks: chromatin fragment views of RNAPII and cohesin ChIA-Drop data with more than 2 fragments per complex (F/C≥3). The number of multiplex chromatin interactions among individual histone genes are provided as n. See also Figure S1.
Figure 2:
Figure 2:. Transcriptional loops mediated by RNAPII and cohesin through concerted efforts.
(A) Left panel: 2D pairwise contact aggregation maps of chromatin loop anchoring sites (CTCF-cohesin, blue arrow with green circle) co-localized with gene transcription start site (TSS) in RNAPII and cohesin ChIA-Drop data. TSS (green right-angled arrow, rightward) is in concordance with the direction of CTCF binding motif (blue arrow, rightward), or TSS (blue right-angled arrow, leftward) is in discordance with CTCF motif direction (blue arrow, rightward). Right panel: boxplots of RNAPII and cohesin ChIA-Drop complexes corresponding to the left panel. Proportions of chromatin contacts from the CTCF binding motif leftward (L) and rightward (R) with TSS in concordance (left) and in discordance (right) are calculated. All p-values are from the two-sided Mann-Whitney test. (B) An example of RNAPII-associated chromatin loops at TSS (right-angled arrow) co-localized with CTCF/cohesin anchoring site (highlighted in blue) and in concordance with CTCF binding motif at the PIEZO2 locus. Top tracks are RNA-seq, RNAPII ChIA-PET, chromatin states (ChromHMM; enhancers in yellow, promoters in red), cohesin ChIA-PET, NIPBL ChIP-seq, H3K27ac ChIP-seq, H3K4me1 ChIP-seq, CTCF ChIA-PET, and CTCF binding motif (directional blue arrows). Middle and lower tracks are RNAPII and cohesin ChIA-Drop complexes extending from CTCF/cohesin anchoring site in each direction, with n denoting their numbers. On the right are the 2D contact maps of RNAPII ChIA-PET, cohesin ChIA-PET, CTCF ChIA-PET, and Hi-C data encompassing all possible interactions. (C) Same as in panel A but for RNAPII binding at cohesin loading sites (yellow cone with circle, non-directional), which also coincide with TSS (grey right-angled arrow). (D) Similar to panel B but at TSS co-localized with NIPBL binding/cohesin loading site (highlighted in yellow) at the TCF4 locus. See also Figure S2.
Figure 3:
Figure 3:. Multiplex transcriptional chromatin interactions involving super-enhancers.
(A) Three examples of chromatin interaction paths from super-enhancers (SE) to target gene promoters (P): left panel, multiple SEs connecting to MYC promoter; middle panel, direct connections from SE to MARCKS promoter; right panel, indirect connections through many intermediate Es and Ps from SE to connect to XRCC6 promoter. Top tracks: ChIP-seq of NIPBL and H3K27ac, RNA-seq, ChIA-PET loops/peaks of RNAPII (purple) and cohesin (green), and CTCF binding motifs. Bottom tracks: fragment view of multiplex chromatin complexes in RNAPII (purple) and in cohesin (green) ChIA-Drop data, where n is the number of chromatin complexes, a subset of which have more than 2 fragments per complex (F/C ³3). (B) The 2D contact maps of RNAPII and cohesin ChIA-Drop data at three exemplary regions, each including MYC, MARCKS, XRCC6 genes. (C) Graph representations for the three categories of SE-P chromatin interaction patterns in RNAPII (top panel) and cohesin (bottom panel) ChIA-Drop data corresponding to the three examples of SE-P in panel A. The nodes in SE-P graph are SE in purple, enhancer E in yellow, and promoter P in green dots. The node degrees are reflected by the dot sizes and indicated by bold numbers, while the edge weights (number of complexes connecting the two nodes) are reflected in the line thickness and recorded as italic numbers. The three types of SE-P graphs in GM12878 cells are: I) Multiple SEs-P involving two or more SEs together connecting to the target gene promoter (n=33); II) Direct SE-P where SE directly connect to the target gene promoter (n=75); III) Indirect SE-P, where SE through multiple intermediate elements in a series of cascade connections indirectly connect to the target gene promoter (n=80). (D) A scatterplot between node degrees (see Methods) of RNAPII and cohesin ChIA-Drop complexes. See also Figure S3.
Figure 4:
Figure 4:. Effects of RAD21 depletion on long- and short-range chromatin interactions mediated by CTCF and RNAPII.
(A) Aggregation plots of ChIP-seq signal at binding sites of CTCF, RAD21, and RNAPII in control (auxin 0h; h: hours) and RAD21-depleted cells treated with auxin at three time points (auxin 6, 9, and 12 hours). (B) A relative density function is plotted for the distance between two contact points of chromatin loops in CTCF ChIA-PET (left) and RNAPII ChIA-PET (right) data before (auxin 0h) and after (auxin 6h) RAD21 depletion. The two curves are similar for loops that are less than 30 kb in length (left side of the dotted vertical line) and deviate for loops that are greater than 30 kb, indicating that small loops (< 30 kb) are RAD21-independent and large loops (> 30 kb) are RAD21-dependent. (C) An aggregation of 2D contacts of chromatin loops with convergent (> <) CTCF motifs in in situ Hi-C, CTCF ChIA-PET, and RNAPII ChIA-PET data from HCT116 cells before (0h) and after 6 hours of auxin treatment (6h). (D) In a large segment of 2Mb region of chromosome 10, 2D contact maps of in situ Hi-C, CTCF ChIA-PET, and RNAPII ChIA-PET data are shown for HCT116 cell line before (0h; upper right triangle) and after (6h; lower left triangle) depleting RAD21. (E) Browser views of the same 2 Mb region in panel D and a zoomed-in region (660 kb) for CTCF ChIA-PET loops and peaks before (0h, dark blue) and after (6h, light blue) RAD21 depletion, along with CTCF binding motifs illustrated as blue arrows. RAD21-dependent (reduced) loops are indicated by red arrows and RAD21-independent (unchanged) loops are labeled with gray arrows, while PET n is the number of paired-end-tags in each loop. (F) The same zoomed-in region of 660 kb in panel E is shown for RNAPII ChIA-PET loops and peaks before (0h) and after (6h) RAD21 depletion, along with chromatin states, promoters (P) and enhancers (E) and CTCF motifs in blue arrows. (G) A 3 Mb chromatin domain in HCT116-RAD21-mAC used for real-time imaging analysis in live cells. Top: a 2D contact matrix of Hi-C data before (auxin 0h) and after RAD21 depletion (auxin 6h) in the 3 Mb region. Bottom: zoom-in browser view of CTCF ChIA-PET loops/peaks and binding motifs (blue) in wild-type HCT116 cells illustrating the normal chromatin looping topology. Non-repetitive regions flanking each of the two anchor sites (shown as blue arrows in convergent CTCF motifs) of this loop near BCL6 and TPRG1 genes are selected as the Casilio imaging targets illustrated in green and red bars, which are 1,243 kb apart. (H) Time-lapse images of the probe pairs with pairwise 3D distances (μm) measured at each time point in minutes (min). Scale bars, 1 μm. (I) Top panel: Boxplot of pairwise spot distances in untreated control (0h) (n=1,107 measurements in 21 nuclei and 27 probe pairs; mean=1.21 μm; median=0.94 μm) and 24-hour auxin-treated (24h) HCT116 cells (n=1,484 measurements in 26 nuclei and 38 probe pairs; mean=2.25 μm; median=2.00 μm). ‘x’ denotes the mean and middle line is median. Bottom panel: Boxplot of Hi-C contact frequency in genomic loci (n=6,385) with convergent CTCF motifs in untreated control (0h) and 6-hour auxin-treated (6h) cells. p-values from the two-sided Mann-Whitney U test. See also Figure S4, Video S1, S2.
Figure 5:
Figure 5:. Functional roles of RAD21-dependent super-enhancer to promoter loop in transcription.
(A) A volcano plot of differential expression analysis showing down-regulated (n=356; blue), unchanged (n=5,391; green), up-regulated (n=361; red) genes using RNA-seq data before and after auxin treatment (6 hours) in HCT116 cells. Other genes are presented in light blue, pink, and grey. See Methods. (B) RNAPII binding intensity at promoters of down-regulated and up-regulated genes with scatterplots between 0h and 6h (left panel) and aggregated peaks 25 kb upstream and downstream of TSS (right panel). (C) Gene body loops of RNAPII ChIA-PET data before (0h) and after (6h) depleting RAD21 are sorted from the promoter of a down-regulated AKAP12 gene towards the transcription end site in the same forward orientation as the gene transcription; n denotes the number of chromatin complexes. TPM (transcript per kilobase million) from RNA-seq (this study) and RPKM (reads per kilobase million) from PRO-seq (Rao et al., 2017) are also recorded. (D) The 2D contact maps of 0h (with RAD21) and 6h (without RAD21) RNAPII ChIA-PET data are presented at a 1.5 Mb region encompassing super-enhancer (SE) and its target gene promoter (P) AKAP12. (E) A browser view of SE-AKAP12 interactions between AKAP12 gene promoter (P) and super-enhancer (SE). Top: tracks of ChromHMM chromatin states and RNA-seq showing that AKAP12 is expressed with TPM (transcripts per million) of 2,610 in control cells (0h) and of 451 in RAD21-depleted cells (6h). Bottom: tracks of ChIA-PET data for RAD21 (green) and RNAPII (purple) in control (0h) and 6 hours of auxin-treated cells (6h). PET n: number of paired-end tags. (F) Browser views of SE-SOX9 interactions encompassing SOX9 promoter (P) and the associated enhancer (E) and super-enhancer (SE). Top: tracks of ChromHMM chromatin states (ChS) demarcating SOX9 promoter (P), enhancer (E), and super-enhancer (SE), and RNA-seq data in control cells (0h) and RAD21-depleted cells (6h). Middle: tracks of ChIA-PET data for RAD21 (green) and RNAPII (purple) in control (0h) and 6 hours auxin treated cells (6h) capturing chromatin loops connecting SOX9 to distal enhancer (E) and super-enhancer (SE). The RAD21-dependent (reduced) loops and RAD21-independent (unchanged) loops are indicated with red and grey arrows, respectively. Bottom: RNAPII ChIA-PET fragment view for connections of SOX9-E, SOX9-SE, E-SE, and intra-SE. The approximate genomic positions of probes (green and red bars) for Casilio live cell imaging are depicted. TPM: transcripts per kilobase million; PET n: number of paired-end tags. (G) Representative time-lapse images of the probe pairs indicated by arrows in Figure S5G with pairwise 3D distances (μm) recorded at each time point in minutes (min) in both control (0h) and Auxin-treated (24h) cells. Scale bars, 1 μm. (H) Boxplot of Casilio distances between the paired green and red probes for SOX9-SE (super-enhancer) loop in control (0h) cells (1,166 measurements of 31 pairs in 17 nuclei; mean=0.74 μm, median=0.53 μm) and auxin-treated (24h) RAD21-depleted cells (943 measurements of 23 pairs in 15 nuclei; mean=1.51 μm; median=1.20 μm) cells. ‘x’ denotes the mean, and middle line is median. p-value from the two-sided Mann-Whitney U test. (I) Boxplot of PET counts between target gene promoters and SE in RNAPII ChIA-PET data in log10 scale. p-value from the two-sided Mann-Whitney U test. See also Figure S5, Video S3, S4.
Figure 6:
Figure 6:. Distinct roles of RAD21-dependent E-P and RAD21-independent P-P RNAPII loops in gene regulation.
(A) An example of RNAPII-associated chromatin loops attenuated by RAD21 depletion. In a large chromatin domain (1.2 Mb) harboring UPP1 gene and associated regulatory elements enhancer (E) and promoter (P) demarcated by ChromHMM, 2D contact maps of RNAPII ChIA-PET before (0h) and after (6h) depleting RAD21 are shown. Below, tracks of RNAPII ChIA-PET loops/peaks views in HCT116 cell line connect UPP1 gene promoter (P) to many distal enhancers (E), with RAD21-dependent attenuated loops marked by red arrows. TPM: transcripts per kilobase million; PET n: number of paired-end tags. (B) An example of RAD21-independent RNAPII loops connecting active gene promoters. In a 180 kb region harboring METTL3 and other genes, 2D contact maps of RNAPII ChIA-PET before (0h) and after (6h) depleting RAD21 are shown. Below, the tracks of RNA-seq and RNAPII ChIA-PET data show connections of active gene promoters that are between 20 kb and 55 kb apart, and these short-range P-P loops are not affected by the RAD21 depletion (grey arrow). Active gene promoters as annotated with ChromHMM states are highlighted in red. (C) Boxplot of loop span of RAD21-dependent enhancer-promoter (E-P) and RAD21-independent promoter-promoter (P-P) loops. Number of loops (n) used for plotting and the median of loop span are provided. (D) Boxplots of PET numbers of RAD21-dependent E-P loops involving down-regulated genes (top panel) and of RAD21-independent P-P loops connecting unchanged genes (bottom panel). (E) In the same region as panel A, the RNAPII ChIA-PET loops and peaks, RNA-seq coverage, and ChromHMM states are also shown for 5 other cell lines: H1, GM12878, K562, HepG2, MCF7. (F) Same region as panel B with the same annotation as panel E. (G) Density plot of the number of tissues (out of 76 tissues), in which each gene is expressed, for those connected in RAD21-dependent E-P loops (red) and those in RAD21-independent P-P loops (grey) (see Methods). See also Figure S6.
Figure 7:
Figure 7:. DNA replication signal patterns in differential genes, and proposed model.
(A) The median replication signal of gene body is plotted for each of the 16-stage Repli-seq data before (0 hour) and after (6 hour) depleting RAD21 for up-regulated, down-regulated, and unchanged genes, along with 20000 random regions (see Methods). (B) An up-regulated gene CCNE1 with TPM (transcript per kilobase million) computed from RNA-seq data before (0h: 0 hour) and after (6h: 6 hours) depleting RAD21. A larger 3.15 Mb region encompassing CCNE1 is shown with 16-stage Repli-seq data (Emerson et al., 2022) from early P02 to late P17 replication stages with auxin treatment denoting cell with (0h) or without (6h) RAD21. Red bar indicates the early initiation zone defined by Emerson et al. using HCT116 0h Repli-seq data. (C) Similar to panel B, for a down-regulated gene OSBPL6. (D) Chronologically, cohesin first loads to chromatin at NIPBL binding sites that are usually co-localized with RNAPII and active transcriptional elements (promoters, enhancers), then it goes along with RNAPII in the direction of transcription and establish short-range transcriptional interactions for local constitutive genes (P-P and E-P) and in long-range loops for connecting distal (super-)enhancers to target gene promoters (SE-P); after arriving at CTCF binding sites, cohesin is interlocked with CTCF, anchors itself there, and actively reels in DNA string in accordance with the CTCF motif orientation, thereby constituting large architectural loops. The architectural loops (blue), the long-range transcriptional loops (purple for RNAPII), and the associated genes are sensitive to RAD21 depletion (cohesin-dependent), whereas the short-range transcription loops (purple for RNAPII) and associated genes are cohesin-independent. See also Figure S7.

References

    1. Abdennur N., and Mirny L.A. (2019). Cooler: scalable storage for Hi-C data and other genomically labeled arrays. Bioinformatics, 36, 311–316. - PMC - PubMed
    1. Allahyar A., Vermeulen C., Bouwman B.A., Krijger P.H., Verstegen M.J., Geeven G., van Kranenburg M., Pieterse M., Straver R., Haarhuis J.H. and Jalink K. (2018). Enhancer hubs and loop collisions identified from single-allele topologies. Nature genetics, 50(8), 1151–1160. - PubMed
    1. Arrastia M.V., Jachowicz J.W., Ollikainen N., Curtis M.S., Lai C., Quinodoz S.A., Selck D.A., Ismagilov R.F. and Guttman M. (2022). Single-cell measurement of higher-order 3D genome organization with scSPRITE. Nature biotechnology, 40(1), 64–73. - PMC - PubMed
    1. Bae S., Park J., and Kim J.-S. (2014). Cas-OFFinder: a fast and versatile algorithm that searches for potential off-target sites of Cas9 RNA-guided endonucleases. Bioinformatics, 30, 1473–1475. - PMC - PubMed
    1. Banigan E.J., van den Berg A.A., Brandão H.B., Marko J.F., and Mirny L.A. (2020). Chromosome organization by one-sided and two-sided loop extrusion. eLife, 9, e53558. - PMC - PubMed

Publication types