[Preprint]. 2024 Mar 26:2024.03.26.586803.
doi: 10.1101/2024.03.26.586803.

Massively parallel combination screen reveals small molecule sensitization of antibiotic-resistant Gram-negative ESKAPE pathogens

Affiliations

Massively parallel combination screen reveals small molecule sensitization of antibiotic-resistant Gram-negative ESKAPE pathogens

Megan W Tse et al. bioRxiv. .

Update in

Abstract

Antibiotic resistance, especially in multidrug-resistant ESKAPE pathogens, remains a worldwide problem. Combination antimicrobial therapies may be an important strategy to overcome resistance and broaden the spectrum of existing antibiotics. However, this strategy is limited by the ability to efficiently screen large combinatorial chemical spaces. Here, we deployed a high-throughput combinatorial screening platform, DropArray, to evaluate the interactions of over 30,000 compounds with up to 22 antibiotics and 6 strains of Gram-negative ESKAPE pathogens, totaling to over 1.3 million unique strain-antibiotic-compound combinations. In this dataset, compounds more frequently exhibited synergy with known antibiotics than single-agent activity. We identified a compound, P2-56, and developed a more potent analog, P2-56-3, which potentiated rifampin (RIF) activity against Acinetobacter baumannii and Klebsiella pneumoniae. Using phenotypic assays, we showed P2-56-3 disrupts the outer membrane of A. baumannii. To identify pathways involved in the mechanism of synergy between P2-56-3 and RIF, we performed genetic screens in A. baumannii. CRISPRi-induced partial depletion of lipooligosaccharide transport genes (lptA-D, lptFG) resulted in hypersensitivity to P2-56-3/RIF treatment, demonstrating the genetic dependency of P2-56-3 activity and RIF sensitization on lpt genes in A. baumannii. Consistent with outer membrane homeostasis being an important determinant of P2-56-3/RIF tolerance, knockout of maintenance of lipid asymmetry complex genes and overexpression of certain resistance-nodulation-division efflux pumps - a phenotype associated with multidrug-resistance - resulted in hypersensitivity to P2-56-3. These findings demonstrate the immense scale of phenotypic antibiotic combination screens using DropArray and the potential for such approaches to discover new small molecule synergies against multidrug-resistant ESKAPE strains.

Keywords: Acinetobacter baumannii; Biological Sciences; Gram-negative ESKAPE pathogens; Microbiology; antibiotic combinations discovery; antibiotic potentiators.


Conflict of interest statement

Competing Interests Statement: P.C.B. is a consultant to or holds equity in 10X Genomics, General Automation Lab Technologies/Isolation Bio, Celsius Therapeutics, Next Gen Diagnostics, Cache DNA, Concerto Biosciences, Stately, Ramona Optics, Bifrost Biosystems, and Amber Bio. His laboratory has received research funding from Calico Life Sciences, Merck, and Genentech for unrelated work. The Broad Institute and MIT may seek to commercialize aspects of this work, and related applications for intellectual property have been filed.

Figures
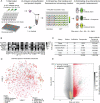
Figure 1.
Figure 1.. Overview of the antibiotic combinations screen using the DropArray platform.
(A) The workflow for antibiotic combinations screening in DropArray. The workflow for antibiotic combinations screening in DropArray. Each microwell carried two droplets where a droplet contained either GFP-expressing strains with antibiotics at 2–3 concentrations or compounds from chemical libraries. We 1) encoded assay inputs with fluorescent barcodes, 2) emulsified them into nanoliter droplets and pooled for 3) loading and random self-assembly of pairwise combinations on the discoveryChip. We imaged microwells prior and after droplet merging, and 4) measured GFP fluorescence as a proxy for bacterial biomass. (B) The panel of Gram-negative pathogen strains and antibiotics screened. In the heatmap, we indicated the approximate IC90 (µg/mL) determined in plates for each antibiotic and strain (Supplemental Methods). (C) Number of strains, antibiotics, compounds and strain-antibiotic-compound combinations screened per library. (D) Chemical space depicted using a t-SNE of the Morgan fingerprints for each compound screened for antibiotic potentiating activity. We included one-third of all compounds that passed screening quality metrics for representation (Supplemental Methods). Solid red stars represent potentiator hits (compounds with a Bliss sum score ≥0.3 and FDR q-values ≤0.05 with at least one strain-antibiotic pair), solid black stars represent single-agent hits (compounds exhibiting ≥30% growth inhibitory activity with FDR q-values ≤0.05 in at least one strain), and black-outlined gray stars represent compounds scoring as both a potentiator and a single-agent hit. (E) Bliss sum scores and significance values for all strain-antibiotic-compound combinations screened (black), called combination hits (red), selected antibiotic-antibiotic positive controls (green), and antibiotic-media negative controls (beige) represented as a volcano plot (hit-calling thresholds: Bliss sum score ≥0.3 and FDR q-values ≤0.05). P-value and FDR calculations: Materials and Methods.
Figure 2.
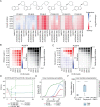
Figure 2.. P2-56 synergizes with RIF in A. baumannii and K. pneumoniae.
(A) Chemical structure of P2-56. (B) Antibiotic interaction profile of P2-56 from the primary DropArray screening data where we estimated interactions using Bliss sum scores (synergy in red, antagonism in blue, and not tested in gray). *: FDR q-value ≤0.05. Bliss scores and growth inhibition values from plate-based checkerboards of resynthesized P2-56 and RIF in (C) A. baumannii ATCC 17978, (D) A. baumannii LAC-4, (E) K. pneumoniae ATCC 43816, and (F) K. pneumoniae AR0087 (values represent the mean of 2 technical replicates and 2 biological replicates). P-value and FDR calculations: Materials and Methods.
Figure 3.
Figure 3.. P2-56-3 increases outer membrane permeability.
(A) Structural analogs of P2-56 tested in combination with RIF at varying concentrations in 5 strains of A. baumannii. Log2(fold-change) of the growth inhibition with RIF with 50 µM of compound relative to growth inhibition with RIF only (synergy in red and antagonism in blue). Plate-based checkerboards showing Bliss scores (left) and growth inhibition (right) to evaluate the drug interactions between P2-56-3 and (B) RIF and (C) novobiocin in A. baumannii ATCC 17978 (mean of 2 technical replicates and 2 biological replicates). (D) Time-kill curve of A. baumannii ATCC 17978 treated with RIF concentrations with and without P2-56-3. Colony forming unit (CFU) concentrations for all three technical replicates represented. Data shown and error bars represent the median ± range. Limit of detection is 200 CFU/mL. (E) Relative NPN fluorescence, as a measure of outer membrane permeability, of A. baumannii ATCC 17978 treated with P2-56-3, colistin (positive control), and vancomycin (negative control). Data shown and error bars represent the mean ± SD (3 technical replicates and 1 representative biological replicate). (F) Relative DiBAC4(3) fluorescence, as a measure of inner membrane depolarization, of A. baumannii ATCC 17978 treated with P2-56-3, polymyxin B (positive control), and DMSO (solvent control). Data represented as box plots show median and interquartile range. * p ≤0.05 for difference between high and low concentrations. (E, F) P-value, FDR, and/or relative fluorescence calculations: Materials and Methods.
Figure 4.
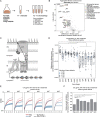
Figure 4.. Inhibition of LOS transport in A. baumannii enhances fitness defects in the presence of P2-56-3.
(A) Schematic of the P2-56-3 and RIF challenge experiments using essential gene depletion strains. Banks of ~12,000 CRISPRi mutants were challenged with 4 different drug conditions: untreated, 100 µM P2-56-3, 0.7 µg/mL RIF, and the combination of 0.7 µg/mL RIF and 100 µM P2-56-3. (B) Difference in aggregated fitness scores of essential gene depletion strains treated with the combination and RIF only and their significance values represented. Gene depletion strains exhibiting the highest differences in fitness scores labeled (FDR q-value ≤0.05 & fitness difference ≤-0.1). (C) Diagram of LOS synthesis (lpx) in the cytoplasm and transport (lpt) across the inner and outer membranes (37, 38). (D) Difference in fitness scores between the combination treatment and RIF only for all lpt and lpx gene depletions. All sgRNA guides targeting each gene represented. Data represented as box plots show median and interquartile range. (E) Growth curves and (F) relative growth inhibition of LOS transport and negative control (Neg) gene depletion strains treated with 0.9 µg/mL RIF only and in combination with P2-56-3 at 8 hours. *: FDR q-value ≤0.05 for comparison between depletion strain and the negative control. (E, F) Data shown and error bars represent the mean ± SEM if shown (4 technical and 2 biological replicates). (B, D, F) P-value and FDR calculations: Materials and Methods.
Figure 5.
Figure 5.. P2-56-3 is more effective in A. baumannii strains with compromised outer membranes.
(A) Schematic of P2-56-3 and RIF challenge experiments using nonessential gene knockout mutants. Transposon knockout mutants were challenged with 4 different drug conditions: untreated, 100 µM P2-56-3, 0.7 µg/mL RIF, and the combination of 0.7 µg/mL RIF with 100 µM P2-56-3. (B) Difference in aggregated fitness scores of nonessential gene knockout mutants treated with the combination and RIF only and their significance values represented. Gene knockout mutants exhibiting the highest differences in fitness scores labeled (FDR q-value ≤0.05 & fitness difference ≤-0.1). (C) Growth curves and (D) relative growth inhibition at 8 hours of MLA knockout mutant treated with 0.7 µg/mL RIF only and in combination with P2-56-3. *: p-value ≤0.05 for comparison between knockout mutant and WT. (E) Growth curves and (F) relative growth inhibition at 8 hours of adeAB, adeFGH, and adeIJK knockout and hyperexpresser strains treated with 1.4 µg/mL RIF only and in combination with P2-56-3. *: FDR q-value ≤0.05 for comparison between mutant and WT. (CF) Data shown and error bars represent the mean ± SEM if shown (4 technical and 3 biological replicates). (B, D, F) P-value and/or FDR calculations: Materials and Methods.

References

    1. Murray C. J. L., et al. Global burden of bacterial antimicrobial resistance in 2019: a systematic analysis. Lancet 399, 629–655 (2022). - PMC - PubMed
    1. O’Neill J., Tackling drug-resistant infections globally: final report and recommendations. Review on Antimicrobial Resistance (2016).
    1. Tacconelli E., et al. Discovery, research, and development of new antibiotics: the WHO priority list of antibiotic-resistant bacteria and tuberculosis. Lancet Infect. Dis. 18, 318–327 (2018). - PubMed
    1. Trusts P. C., Antibiotics Currently in Global Clinical Development (2021).
    1. Butler M. S., Henderson I. R., Capon R. J., Blaskovich M. A. T., Antibiotics in the clinical pipeline as of December 2022. J. Antibiot. 76, 431–473 (2023). - PMC - PubMed

Publication types