[Preprint]. 2024 Mar 29:rs.3.rs-4014556.
doi: 10.21203/rs.3.rs-4014556/v1.

Androgen loss weakens anti-tumor immunity and accelerates brain tumor growth

Affiliations

Androgen loss weakens anti-tumor immunity and accelerates brain tumor growth

Juyeun Lee et al. Res Sq. .

Abstract

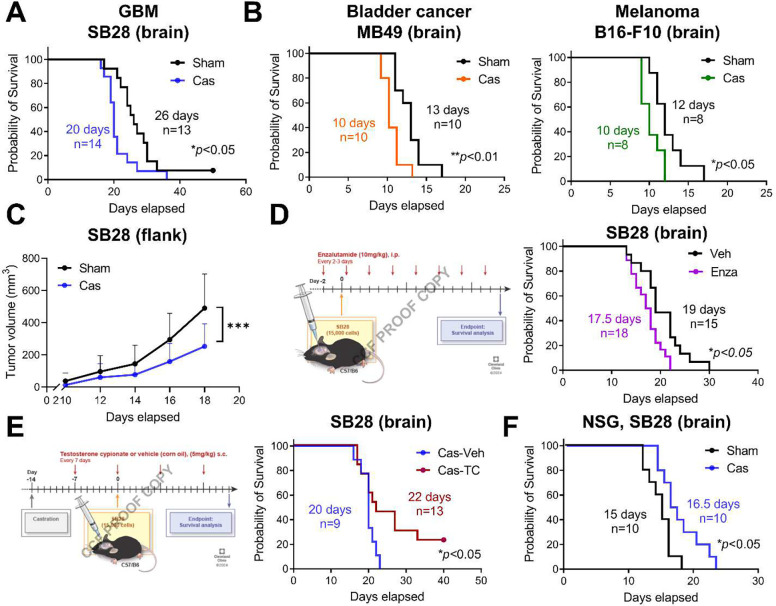
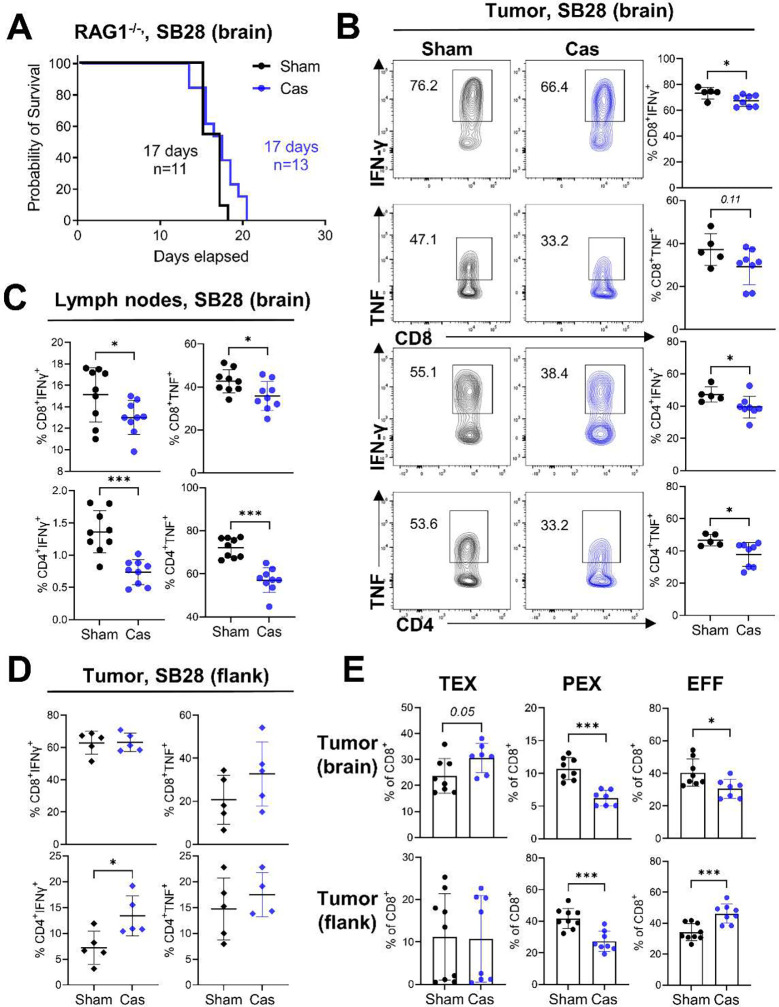
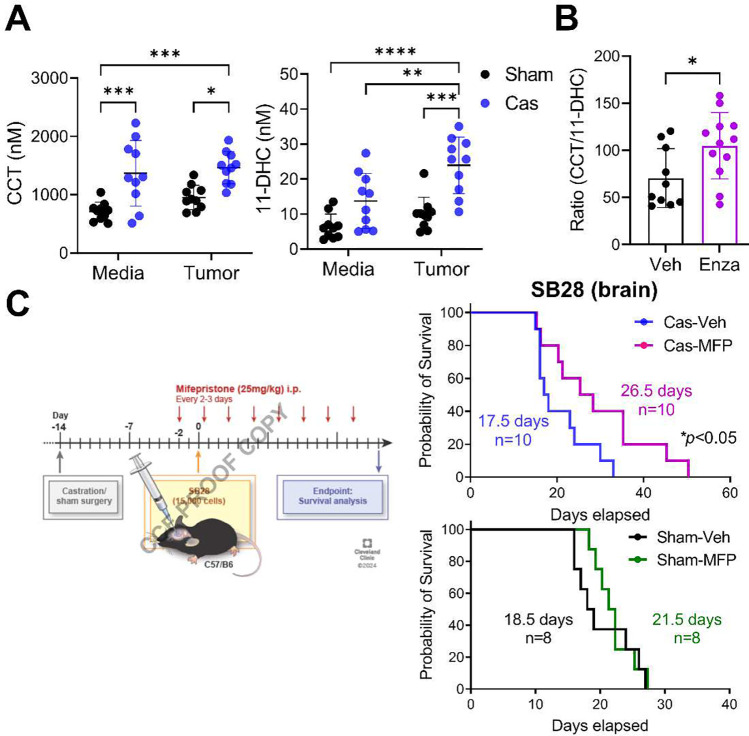
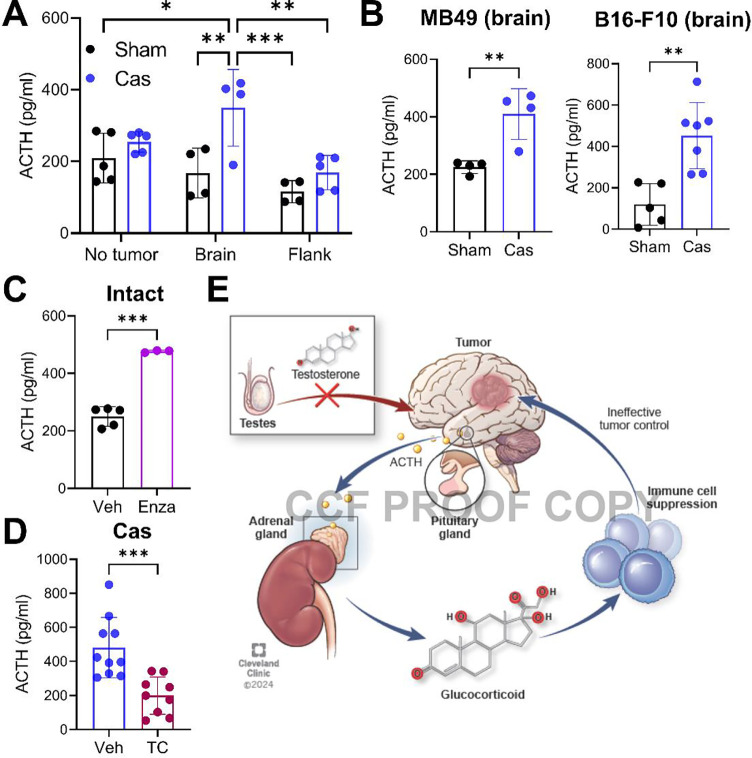
Many cancers, including glioblastoma (GBM), have a male-biased sex difference in incidence and outcome. The underlying reasons for this sex bias are unclear but likely involve differences in tumor cell state and immune response. This effect is further amplified by sex hormones, including androgens, which have been shown to inhibit anti-tumor T cell immunity. Here, we show that androgens drive anti-tumor immunity in brain tumors, in contrast to its effect in other tumor types. Upon castration, tumor growth was accelerated with attenuated T cell function in GBM and brain tumor models, but the opposite was observed when tumors were located outside the brain. Activity of the hypothalamus-pituitary-adrenal gland (HPA) axis was increased in castrated mice, particularly in those with brain tumors. Blockade of glucocorticoid receptors reversed the accelerated tumor growth in castrated mice, indicating that the effect of castration was mediated by elevated glucocorticoid signaling. Furthermore, this mechanism was not GBM specific, but brain specific, as hyperactivation of the HPA axis was observed with intracranial implantation of non-GBM tumors in the brain. Together, our findings establish that brain tumors drive distinct endocrine-mediated mechanisms in the androgen-deprived setting and highlight the importance of organ-specific effects on anti-tumor immunity.


Conflict of interest statement

Competing interests N.S. is a co-inventor on a Cleveland Clinic patent on HSD3B1. The other authors declare no competing interest.

Figures

Figure 1.
Figure 1.. Loss of testosterone leads to shortened survival of brain tumor-bearing mice in an androgen-dependent manner.
A-B. Kaplan-Meier curve depicting survival of B6 mice after intracranial implantation of (A) SB28 cells (15,000 cells/mouse) or (B) MB49 (5,000 cells/mouse) or B16-F10 (40,000 cells/mouse). C. Tumor growth curve of B6 mice inoculated with SB28 subcutaneously in the flank region. Data combined from two independent experiments. n=10/sham, n=9/cas. Data represent the mean ± SD analyzed by two-way ANOVA with Tukey’s multiple comparison test for tumor growth (***p<0.001). D. Survival analysis of B6 male mice intracranially implanted with SB28 cells after enzalutamide treatment as depicted. E. Survival analysis of castrated B6 male mice intracranially implanted with SB28 cells after testosterone cypionate injections (TC, 250 μg/injection, s.c. weekly) or vehicle (veh, corn oil). F. Kaplan-Meier curve depicting survival of NSG mice after intracranial implantation of SB28 cells (10,000 cells/mouse). For survival analysis, median survival days and number of animals are indicated in the graph. Data combined from two to three independent experiments. Log-rank test was performed (*p<0.05, **p<0.01).
Figure 2.
Figure 2.. Castration induces a systemic attenuation of T cell function.
A. Survival analysis of RAG1−/− mice after castration or sham surgery with a brain tumor. Combined results from four independent experiments with log-rank test. Median survival length and number of animals are indicated. B-C, Flow cytometric analysis of T cells was performed in sham or castrated mice 14 days after brain tumor implantation. Cytokine production in T cells infiltrated into (B) tumors (n=5/sham, n=8/cas) or (C) inguinal lymph nodes (n=9/group) was measured after a 4 h incubation with stimulation cocktail. D. Cytokine production in T cells infiltrated into flank tumors (n=5/group). E. Frequency of exhausted T cell subsets in CD8+ T cells from brain tumors (upper) (n=8/sham, n=7/cas) or flank tumors (lower) (n=9/sham, n=8/cas). Terminally exhausted: CD8+CD44+PD1+TIM3+TCF1, Progenitor exhausted: CD8+CD44+PD1+TIM3TCF1+, Effector: CD8+CD44+TIM3TCF1. Data combined from two independent experiments. Unpaired Student’s t-test was performed (*p<0.05, **p<0.01, ***p<0.01).
Figure 3.
Figure 3.. Elevated serum glucocorticoid levels result in reduced survival following castration.
A. Mouse serum was collected 14 days after intracranial tumor implantation or media injection. Mass spectrometry analysis was performed to measure the levels of corticosterone (CCT) and 11-DHC (11-dehydrocorticosterone). n=10/group. Two-way ANOVA analysis with Tukey’s multiple comparison test was performed (*p<0.05, **p<0.01, ***p<0.001). B. Ratio of CCT/11-DHC measured in serum of mice treated with enzalutamide (Enza, 10 mg/kg, i.p.) or vehicle (Veh, corn oil) three times a week. n=10/veh, n=12/enza. C. Survival analysis of mice bearing a brain tumor (SB28) and treated with mifepristone (MFP, 25 mg/kg, i.p.) or vehicle (Veh, corn oil) three times a week. Median survival length and number of animals are indicated in the graph. Data combined from two independent experiments. Experiments for castration (upper) and sham (lower) mice were performed separately. Long-rank test (*p<0.05).
Figure 4.
Figure 4.. Castration-induced activation of the HPA axis is exacerbated by presence of a brain tumor.
A. Serum ACTH level was measured using ELISA. Serum was collected 14 days (brain) or 20 days (flank) after SB28 tumor implantation or from mice without a tumor. n=4–5/group. Two-way ANOVA with Tukey’s multiple comparison test (*p<0.05, **p<0.01, ***p<0.001). B. Serum ACTH level from mice after intracranial tumor implantation with MB49 (5,000 cells/mouse) or B16-F10 (40,000 cells/mouse). Unpaired student t-test (*p<0.05, **p<0.01). C. Serum ACTH level from gonadally intact SB28-bearing (brain) mice treated with vehicle (Veh, corn oil) or enzalutamide (Enza, 10 mg/kg, i.p.). Serum samples were collected at endpoint. n=5/veh, n=3/enza. D. Serum ACTH level from castrated SB28-bearing (brain) mice treated with vehicle (Veh, corn oil) or testosterone cypionate (TC, 250 μg/injection, s.c., weekly). Serum samples were collected at endpoint. n=10/veh, n=9/TC. Unpaired t-test (*p<0.05, ***p<0.001). E. Proposed model depicting how the loss of testosterone and the presence of a brain tumor synergistically activate the HPA axis and regulate anti-tumor immunity.

References

    1. Cook M. B., McGlynn K. A., Devesa S. S., Freedman N. D. & Anderson W. F. Sex disparities in cancer mortality and survival. Cancer Epidemiol Biomarkers Prev 20, 1629–1637, doi:10.1158/1055-9965.EPI-11-0246 (2011). - DOI - PMC - PubMed
    1. Siegel R. L., Miller K. D. & Jemal A. Cancer Statistics, 2017. CA Cancer J Clin 67, 7–30, doi:10.3322/caac.21387 (2017). - DOI - PubMed
    1. Abdel-Hafiz H. A. et al. Y chromosome loss in cancer drives growth by evasion of adaptive immunity. Nature 619, 624–631, doi:10.1038/s41586-023-06234-x (2023). - DOI - PMC - PubMed
    1. Qi M., Pang J., Mitsiades I., Lane A. A. & Rheinbay E. Loss of chromosome Y in primary tumors. Cell, doi:10.1016/j.cell.2023.06.006 (2023). - DOI - PubMed
    1. Rubin J. B. et al. Sex differences in cancer mechanisms. Biol Sex Differ 11, 17, doi:10.1186/s13293-020-00291-x (2020). - DOI - PMC - PubMed

Publication types

LinkOut - more resources