[Preprint]. 2024 Mar 25:2024.03.20.585130.
doi: 10.1101/2024.03.20.585130.

Functional Diversity of Memory CD8 T Cells is Spatiotemporally Imprinted

Affiliations

Functional Diversity of Memory CD8 T Cells is Spatiotemporally Imprinted

Miguel Reina-Campos et al. bioRxiv. .

Update in

  • Tissue-resident memory CD8 T cell diversity is spatiotemporally imprinted.
    Reina-Campos M, Monell A, Ferry A, Luna V, Cheung KP, Galletti G, Scharping NE, Takehara KK, Quon S, Challita PP, Boland B, Lin YH, Wong WH, Indralingam CS, Neadeau H, Alarcón S, Yeo GW, Chang JT, Heeg M, Goldrath AW. Reina-Campos M, et al. Nature. 2025 Mar;639(8054):483-492. doi: 10.1038/s41586-024-08466-x. Epub 2025 Jan 22. Nature. 2025. PMID: 39843748 Free PMC article.

Abstract

Tissue-resident memory CD8 T cells (TRM) kill infected cells and recruit additional immune cells to limit pathogen invasion at barrier sites. Small intestinal (SI) TRM cells consist of distinct subpopulations with higher expression of effector molecules or greater memory potential. We hypothesized that occupancy of diverse anatomical niches imprints these distinct TRM transcriptional programs. We leveraged human samples and a murine model of acute systemic viral infection to profile the location and transcriptome of pathogen-specific TRM cell differentiation at single-transcript resolution. We developed computational approaches to capture cellular locations along three anatomical axes of the small intestine and to visualize the spatiotemporal distribution of cell types and gene expression. TRM populations were spatially segregated: with more effector- and memory-like TRM preferentially localized at the villus tip or crypt, respectively. Modeling ligand-receptor activity revealed patterns of key cellular interactions and cytokine signaling pathways that initiate and maintain TRM differentiation and functional diversity, including different TGFβ sources. Alterations in the cellular networks induced by loss of TGFβRII expression revealed a model consistent with TGFβ promoting progressive TRM maturation towards the villus tip. Ultimately, we have developed a framework for the study of immune cell interactions with the spectrum of tissue cell types, revealing that T cell location and functional state are fundamentally intertwined.


Conflict of interest statement

M.R-C. is a co-founder, scientific advisor, and board member of TCura Bioscience, Inc. A.F. is a co-founder, CEO, and board member of TCura Bioscience, Inc. B.S.B. receives consulting fees from Bristol Myers Squibb, Pfizer, and research grants from Merck, Gilead. A.W.G. is a co-founder of TCura Bioscience, Inc. and serves on the scientific advisory board of ArsenalBio and Foundery Innovations. The rest of the authors declare that they have no competing interests.

Figures

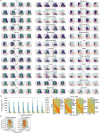
Extended Data 1,
Extended Data 1,
related to Figure 1. a, Schematic of the experimental workflow for mouse takedown at progressing timepoints post LCMV infection (pi) before Immunofluorescence staining. An object classifier in QuPath is used to identify P14 and epithelial cells from IF staining. b, Diagram of the methodology used to design the Xenium mouse SI probe panel. Using snRNA-seq data from the mouse small intestine, a 350 gene set was designed to maximize Adjusted Rand Index (ARI) and Adjusted Mutual Information (AMI) scores of classifier-derived Leiden cluster predictions. c, Genes least informative for predicting cell type are continuously pruned using recursive feature elimination with ARI and AMI of classifier-derived Leiden cluster predictions calculated at each pruning step. d, Pearson residual correlations of total gene abundances between timepoint biological replicates. e, Snapshots from a Xenium spatial transcriptomics day 6 small intestine show unique cell types in close spatial proximity. Canonical cell type marker gene transcript positions are colored to show a (from left to right) P14 T Cell (Xist+Cd8α+Cd3e+) and cDC1 (Clec9a+Xcr1+), P14 T Cell and Endothelial (Pecam1+), P14 T Cell and Fibroblast (Acta2+), P14 T Cell and Lymphatic (Lyve1+), and Cd8α T Cell (Cd8α+Cd3e+) and Neuron (Rbfox3+). Predicted cell segmentation boundaries are colored by the “Type” annotation. f, Cell type frequency percentages across all timepoints. Error bars span the percentages for the two biological replicates per time point.
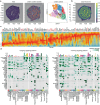
Extended Data 2,
Extended Data 2,
related to Figure 2. a, IMAPs of all cell subtypes from each time point (two biological replicates for each time point), with colored gates dividing the top IE, top LP, crypt IE, crypt LP, and muscularis. b, Number of P14 CD8 T cells present in binned segments of equal length of the longitudinal axis for each replicate and time point. c, Convolved gene expression of P14 cells along the crypt-villus axis at every timepoint (n = 2 pooled biological replicates). d, IMAPs of day 90 P14 CD8 T cells (one of two biological replicates) colored by Blimp1high effector-like and Id3high memory precursor-like signature enrichment derived from Milner et al.
Extended Data 3,
Extended Data 3,
related to Figure 3. a, Overview of Visium-based spatial transcriptomics on day 21 mouse SI tissue - (left) H&E staining and (right) spots Leiden-clustered according to RNA expression and positioned on the tissue. b, Visium spots colored by imputed crypt-villus axis values using continuous label transfer after jointly embedding with the mouse Xenium day 30 SI. c, Convolved gene expression of cytokines along the imputed crypt-villus axis in the Visium sample. Red labels indicate genes that were included in the Xenium gene panel. d, Full version of Fig 3g. Strength of outgoing (left), and incoming (right) signals in each signaling pathway across all cell subtypes. P14 CD8 T cells are separated into distinct regional types based on IMAP gating.
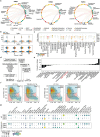
Extended Data 4,
Extended Data 4,
related to Figure 4. a, CellChat circle plots showing top enriched interactions between TGFβ isoform senders and regionally gated P14 receivers across all 8 SI samples (4 timepoints, 2 replicates each). Each cell subtype is represented by a node, and a directed edge is displayed from a top sender subtype to a receiver P14 regional subtype for significant TGFβ sender-P14 interactions. b, Violin plots depicting the log-normalized TGFβRI and TGFβRII expression counts within P14s across each timepoint. Violins are plotted with Scanpy, scaled by width, and black dotted lines mark expression quartiles. c, The expression of TGFβ isoforms and genes involved in TGFβ presentation from Fig 4g as measured by Xenium. d, Schematic for MERSCOPE gene panel design process. Most important genes for defining cell types were identified using XGBoost on a group of immune datasets, before adding biologically important genes and filtering out MERSCOPE-incompatible genes. e, Change in frequency of each cell type between WT and TGFβR2 KO conditions. Frequency values reflect proportional increases or decreases of TGFβR2 KO cell type counts relative to WT. f, IMAPs of WT and TGFβR2 KO P14 T cells colored by enrichment of the core TRM signature from Milner et al, and the TGFβ program derived from Nath et al. g, A comparison of TGFβ isoform expression between cell subtypes in WT and TGFβR2 KO.
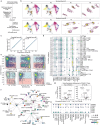
Extended Data 5,
Extended Data 5,
related to Figure 5. a, Schematic for designing the Xenium human SI gene panel. The Xenium base human colon panel was expanded with canonical immune genes, the human homologs of top spatially differentially expressed genes from the Xenium mouse data, and computationally derived genes that best capture the heterogeneity within immune cell types found in scRNA-seq data from Boland et al. b, Xenium processed terminal ileum samples divided into two rows corresponding to the two human donors. Adjacent tissue sections were taken from both donors and are positioned side-by-side within the joint MDE embedding (left) and spatially (right). Cells are colored by their annotations in Fig 5a. c, Scattered raw gene expression abundances between the technical replicates of both human ileums overlayed with a line of best fit. The Pearson residual correlation coefficient (r) is calculated between the gene abundances of both samples. d, Expression of genes used to annotate immune subtypes. Colors of dots indicate the mean expression of the gene in each subcluster, and size of the dots correspond to the percentage of cells in each subcluster expressing the gene. The final cell subtype annotations of each subcluster are shown as y-ticks along the right side of the plot. e, IMAP positioning of select T-Cell subtypes within all (n=4) human sections (Peyer’s Patches excluded). Cells are colored by kernel density estimates of their coordinate location within the IMAP. IMAP gates are positioned as in Fig 5d. f, Aggregated physical interaction network where edges between nodes represent a normalized Squidpy interaction score lying above a 0.1 threshold (10% of the connections). Nodes are positioned using a Kamada-Kawai layout algorithm on the averaged interaction matrix of all human sections. g, Differential expression testing of all genes expressed in at least 5% of human CD8αβ T Cells using diffxpy. A two-tailed Wald test yielded a fold change and adjusted p-value (padj) for each gene (X) between human CD8αβ T cells gated in the crypt versus those gated in the top of the villus, and (X) human CD8αβ T cells gated intraepithelial versus those gated in the lamina propria. All genes are plotted by their log2 fold change and −log100(padj), and significantly differentially expressed genes (padj < 0.05) are colored red. h, Expression of TGFβ isoforms and genes involved in TGFβ presentation across cell types after pooling the cells from all human sections (n=4).
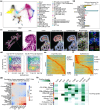
Figure 1.
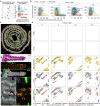
Figure 1.. Characterization of the spatial and transcriptional state of antigen-specific CD8 T cells in responses to acute viral infection in the mouse small intestine with spatial transcriptomics.
a, Diagram of a coordinate system to define morphological axes within the small intestine (left). Villus (V), Crypt (C), Muscularis (M) mark different physical regions in the tissue. Distance to the nearest epithelial cells (x) and distance to the base of the muscularis (y) form the basis of an Immune Allocation Plot (IMAP) (right). Top and crypt regions can house both intraepithelial lymphocytes (IEL) and lamina propria (LP) lymphocytes. b, IMAP representation of intestinal P14 localization progression measured by Immunofluorescence (IF) staining at timepoints post-infection (two biological replicates with n=3 mice per time point, 1 representative mouse shown). Gates for Top of Villus (Blue), Crypt (Red), and Muscularis (Beige) highlight the different regions. Points, representing cell positions, are colored by kernel density estimates over the IMAP (x,y) coordinates. c, Xenium-based spatial transcriptomics data structure overview. (row 1) Xenium output of a Day 8 pi mouse small intestine, with cells colored by Leiden cluster based on quantified RNA abundances. Zoom in of a villus showing (row 2) H&E staining, (row 3) confocal IF images of CD8α and plasma membrane marker Wheat Germ Agglutinin (WGA), and (row 4) Xenium DAPI staining with cell boundary segmentation masks overlaid and colored by Leiden cluster. (row 5) A further zoom in to a subregion of the same villus depicting (left) Xenium DAPI staining overlaid by cell boundary segmentation and all transcripts assigned to cells, and (right) IF image of CD8α and WGA with Cd8a, Cd8b, Gzmb, and female P14 specific Xist transcript locations overlaid. d, Processed Xenium data overview of mouse small intestines (SI) at day 6, 8, 30, and 90 takedown timepoints (columns). Rows depict (row 1) positioning of cells within a joint MDE embedding of all SI Xenium samples colored by cell type, (row 2) in situ spatial positioning of the cells, and close-ups colored by (row 3) cell type, (row 4) P14s highlighted red, and (row 5) Leiden cluster. One out of two biological replicates for each time point is shown.
Figure 2.
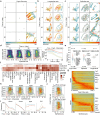
Figure 2.. Intestinal regionalization along key axes instructs TRM diversity in the mouse intestine.
a-c, Spatial axes shown within the joint MDE embedding and in situ location, and (a) colored by their crypt-villus axis position from closer to crypt (blue) to closer to tip of villus (red), (b) colored by their longitudinal axis position from proximal (blue) to distal (red), (c) colored by their epithelial axis position from close to epithelial cells (blue) to closer to lamina propria (red). One out of two biological replicates for each time point is shown. d, (left) IMAPs of P14 CD8 T cells in samples from each time point, with colored gates dividing the top, crypt, and muscularis, and (right) the number of P14 CD8 T cells positioned within each regional gate across the time course (two biological replicates for each time point). e, Combined time course samples (n = 8), 4 time points with 2 biological replicates per time point, are pooled to create a swarm plot of Spearman rank correlation coefficients (ρ) between each axis and every gene expressed in at least 5% of P14s, with select correlated genes annotated. Genes are considered positively correlated (red) when ρ > 0.05, negatively correlated (blue) when ρ < −0.05, and not correlated (grey) otherwise. f, Heatmap depicting the percentage of genes in every cell subtype correlated with each axis using all combined time course samples (n=8). Heatmap colors indicate for all genes expressed in a particular cell type, few of them correlate with the corresponding axis (white), or most of them correlate with the corresponding axis (dark red). g, Convolved gene expression of P14 CD8 T cells along the crypt-villus axis (top) and epithelial axis (bottom) of all time course samples (n = 8). h and i, IMAP representations of day 90 P14s (one out of two biological replicates is shown) colored by kernel density estimates weighted by expression counts of select genes (h) and the expression of each gene within IMAP gated regions across time points in P14 CD8 T cells (i) (n=2). j, IMAP representations of day 90 P14 CD8 T cells (one out of two biological replicates is shown) colored by kernel density estimates weighted by UCell signature enrichment of polyfunctional memory TRM (cluster 3) and effector TRM (“terminal state” (cluster 29)). Signatures from Kurd et al. 2020. (LFC>1 and p-adj<0.01).
Figure 3.
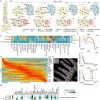
Figure 3.. Cytokine gradients and differential interactions programs maintain TRM diversity.
a and b, Representation of the connectome between cell subtypes at (a) an individual cell resolution in a day 8 villus and (b) an aggregated network format where edges between nodes represent a normalized Squidpy interaction score lying above a 0.1 threshold (10% of the connections). Node (x, y) positions are determined by running a Kamada-Kawai layout algorithm on the Squidpy interaction matrix of the two day 8 replicates and visualized using igraph. For each time point, interaction scores between nodes are averaged across the two biological replicates. c, Squidpy interaction scores between cell subtypes and P14s regional groupings—Top, Crypt, and Muscularis as depicted in Fig. 2d. The color of the heatmap position reflects the strength of contact. Interaction scores are averaged across the eight samples, and values were row-normalized. d and e, Convolved gene expression of cytokines along the crypt-villus axis ordered and displayed with scVelo pooled across all time course samples (n=8). Isoforms of TGFβ are highlighted (d) and depicted spatially at their positions on villi from a day 8 pi SI (e). f, Gene expression trends for TGFβ isoforms separated by timepoint (n = 2 biological replicates pooled). A generalized additive model is used to fit a curve to the expression counts of each ligand along the crypt-villus axis, followed by standard scaling for comparison across trends. g, Heatmap showing the pathways contributing the most to incoming signaling of each P14 regional grouping. Relative strengths of each pathway were calculated using spatial CellChat on (n=8) samples from 4 time points. Heatmap is column-normalized across all subtypes, though only P14 CD8 T cells are displayed in the visualization.
Figure 4.
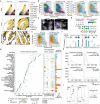
Figure 4.. Sources and mediators of the TGFβ program for CD8 T cells in the SI profiled by MERSCOPE.
a, Female wild type or TGFβR2 KO P14 cells were transferred into male C57BL/6 recipients. MERSCOPE-based spatial transcriptomics of the SI was done on day 8 post-infection. One WT and one TGFβR2 KO SI were profiled from one biological replicate with 3 mice per condition. Plots show the joint MDE embedding colored by cell type (top), in situ spatial positioning of the cells (middle), and close-ups (bottom). b, (left) IMAP positioning and kernel density estimate (weighted by gene expression, bottom) coloring of WT and TGFβR2 KO P14 cells. Cells are gated into top intraepithelial, top lamina propria, crypt intraepithelial, crypt lamina propria, and muscularis.(middle) Quantification of P14 cells localized in the muscularis, crypt or top of villus. (right) IMAP colored by kernel density estimates weighted by expression counts of Itgae. c, Contacting P14s and conventional dendritic cells in zoomed-in regions of the SI. DAPI staining is overlaid with scattered points representing the positions of select transcripts. d, Top differentially expressed genes between WT and TGFβR2 KO P14 cells. The dot plot is colored by the mean expression of each gene, and the dot size reflects the percentage of P14 cells in which the corresponding gene is expressed. e, IMAP representations of WT and KO P14 cells colored by kernel density estimates weighted by expression counts of the proliferation marker Mki67. f and g, TGFβR2 dependent signature enrichment and distance to each cell subtype were calculated for all P14 cells, and Spearman rank correlated against each other (f). (g) For every subtype, (left) the correlation coefficients between signature enrichment and P14 cell proximity to the subtype among both WT and TGFβR2 KO P14 CD8 T cells, (middle) the expression of TGFβ isoforms and genes involved in TGFβ presentation in the WT sample, and (right) a non-parametric Kolmogorov–Smirnov statistic indicating the significance of difference of the distance distributions between P14 CD8 T cells and the corresponding cell type in both WT and TGFβR2 KO. The color of the bars indicates whether P14 CD8 T cells are closer to a given cell type in WT (blue) or TGFβR2 KO (red), and a line indicating effect relevance is positioned at 0.08. h, Comparisons of the distance between WT or TGFβR2 KO P14 cells and selected other cell subtypes. A Kolmogorov–Smirnov statistic indicates the difference between the WT and KO distributions for each subtype. The plotted lines show the positional density using a 1D kernel density estimate. i, Proposed mechanism of effector TRM maturation in the SI, where fibroblasts use TGFβ signaling to prime antigen-specific T-cells into the molecular programs needed for residence at the villus tip.
Figure 5.
Figure 5.. CD8 T cell phenotypic diversity in the human ileum is spatially imprinted.
a and b, Spatial transcriptomics of human small intestine sections from two donors (2 consecutive tissue sections from each) using 10X Xenium. (a) Joint MDE embedding by cell type and (b) the mean relative frequencies of each annotated cell type across all sections pooled. Error bars represent the standard error of the mean across (n = 4) human sections. c, Overview of the Xenium-based spatial transcriptomics data from the submucosal biopsy of human terminal ileum. From left to right, (1) Xenium output of a human terminal ileum, with cell segmentation masks colored by annotated cell type. Zoom in of a villus showing (2) H&E staining, Xenium DAPI staining with cell boundary segmentation masks overlaid and colored by (3) Leiden cluster, (4) Crypt-Villus Axis, and (5) Epithelial distance. A further zoom-in to a subregion of the same villus depicting (6) Xenium DAPI staining overlaid by cell segmentation masks and all detected transcripts and (7) select transcripts overlaid upon DAPI staining. d, IMAP representation of human CD8αβ T cells colored by kernel density estimates weighted by the mouse signature for P14 cells at the top of the villus (left) or in the crypts (right). Human IMAP gates define the top of the villus (blue) and crypt (red) and split down the middle to define intraepithelial (left) and lamina propria (right). Human CD8αβ T cells are pooled across all human samples (n=2 donors, 2 adjacent tissue sections from each), and Peyer’s Patches are excluded. e and f, Pooling all human samples (n=2 donors, 2 adjacent tissue sections from each), and excluding Peyer’s Patches, convolved gene expression of CD8αβ T cells along the (e) crypt-villus axis and (f) epithelial axis. g, Expression of select genes in CD8 T cells are Spearman rank correlated with distances between CD8 T cells and other cell types. A red color indicates that P14-specific expression of a gene is increased when T cells are near a given cell type (expression is negatively correlated with increasing distance). Conversely, a blue color indicates that the expression of a gene is decreased when T cells are near the corresponding cell type. Correlations were calculated for each sample (n=4) individually and the mean correlation coefficient is shown. h, Heatmap showing the most contributing pathways to incoming signaling of different human immune cell groupings. Relative strengths of each pathway were calculated using spatial CellChat on all human samples. Heatmap is column-normalized across all human cell subtypes, though only specific immune subtypes are displayed in the visualization. Human CD8αβ T cells were grouped either effector or stem-like based on their enrichment of the mouse-derived top and crypt UCell signatures. Enrichment of each signature was z-scored across all human CD8αβ T cells before direct comparison to classify the CD8αβ T cells into effector-like or stem-like groupings.

References

    1. Masopust D. & Soerens A. G. Tissue-Resident T Cells and Other Resident Leukocytes. Annu Rev Immunol (2019) doi:10.1146/annurev-immunol-042617-053214. - DOI - PMC - PubMed
    1. Reina-Campos M. et al. Metabolic programs of T cell tissue residency empower tumour immunity. Nature 621, 179–187 (2023). - PMC - PubMed
    1. Crowl J. et al. Tissue-resident memory CD8+ T cells possess unique transcriptional, epigenetic and functional adaptations to different tissue environments. Nat Immunol (2022). - PMC - PubMed
    1. Milner J. J. et al. Runx3 programs CD8 + T cell residency in non-lymphoid tissues and tumours. Nature 552, 253–257 (2017). - PMC - PubMed
    1. Heeg M. & Goldrath A. W. Insights into phenotypic and functional CD8+ TRM heterogeneity. Immunol Rev 316, 8–22 (2023). - PMC - PubMed
Methods References
    1. Steinert E. M. et al. Quantifying Memory CD8 T Cells Reveals Regionalization of Immunosurveillance. Cell 161, 737–749 (2015). - PMC - PubMed
    1. DeLucia B. et al. A 3D-printable device allowing fast and reproducible longitudinal preparation of mouse intestines. Animal Model Exp Med 5, 189–196 (2022). - PMC - PubMed
    1. Stuart T. et al. Comprehensive Integration of Single-Cell Data. Cell 177, 1888–1902.e21 (2019). - PMC - PubMed
    1. Wolf F. A., Angerer P. & Theis F. J. SCANPY: Large-scale single-cell gene expression data analysis. Genome Biol 19, (2018). - PMC - PubMed
    1. Stringer C., Wang T., Michaelos M. & Pachitariu M. Cellpose: a generalist algorithm for cellular segmentation. Nature Methods 2020 18:1 18, 100–106 (2020). - PubMed

Publication types