[Preprint]. 2024 Mar 27:2024.03.27.586885.
doi: 10.1101/2024.03.27.586885.

The inflammatory microenvironment of the lung at the time of infection governs innate control of SARS-CoV-2 replication

Affiliations

The inflammatory microenvironment of the lung at the time of infection governs innate control of SARS-CoV-2 replication

Paul J Baker et al. bioRxiv. .

Update in

Abstract

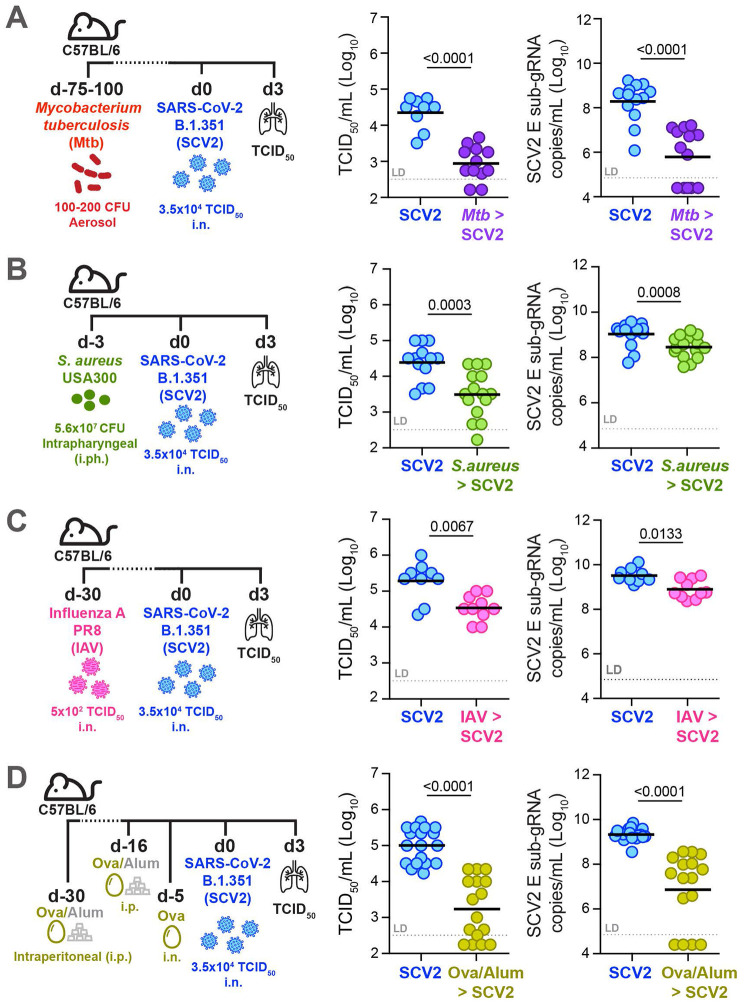
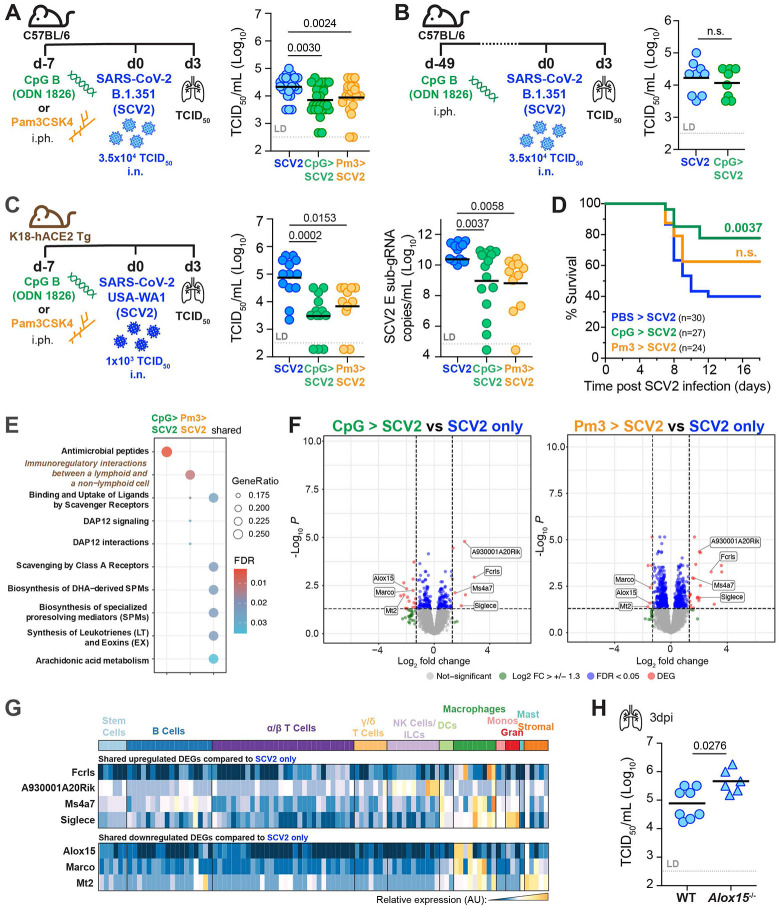
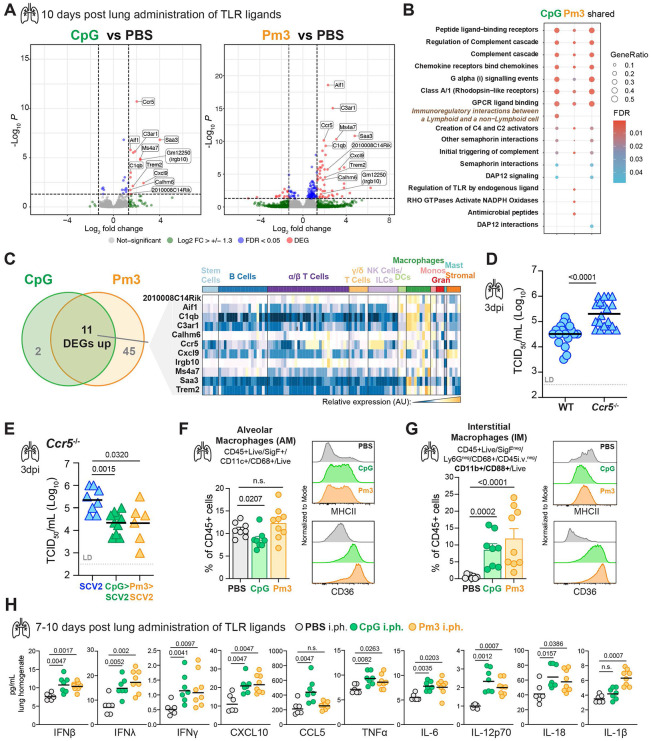
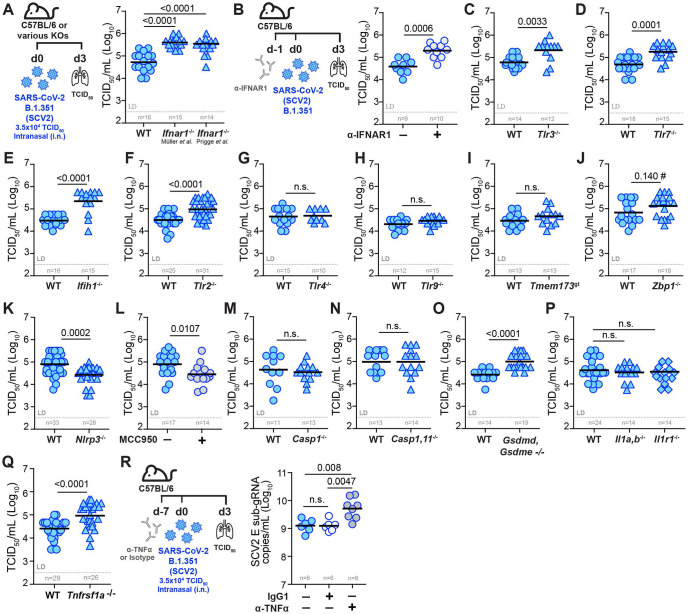
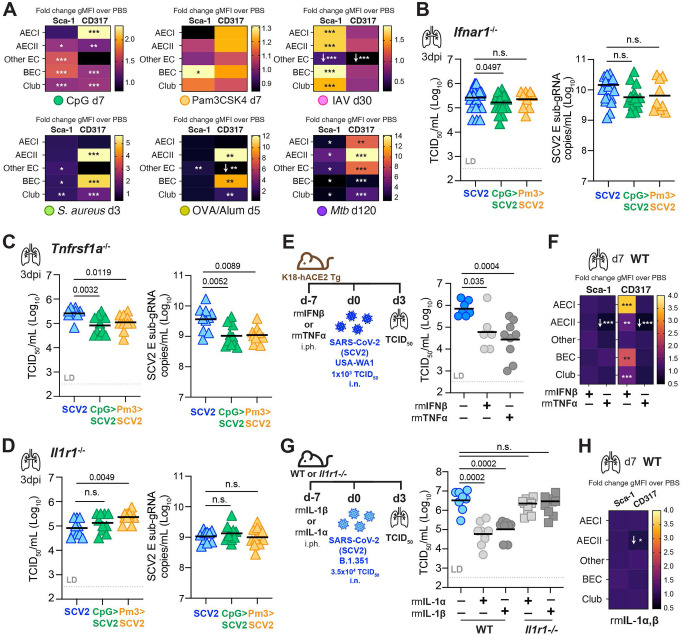
SARS-CoV-2 infection leads to vastly divergent clinical outcomes ranging from asymptomatic infection to fatal disease. Co-morbidities, sex, age, host genetics and vaccine status are known to affect disease severity. Yet, how the inflammatory milieu of the lung at the time of SARS-CoV-2 exposure impacts the control of viral replication remains poorly understood. We demonstrate here that immune events in the mouse lung closely preceding SARS-CoV-2 infection significantly impact viral control and we identify key innate immune pathways required to limit viral replication. A diverse set of pulmonary inflammatory stimuli, including resolved antecedent respiratory infections with S. aureus or influenza, ongoing pulmonary M. tuberculosis infection, ovalbumin/alum-induced asthma or airway administration of defined TLR ligands and recombinant cytokines, all establish an antiviral state in the lung that restricts SARS-CoV-2 replication upon infection. In addition to antiviral type I interferons, the broadly inducible inflammatory cytokines TNFα and IL-1 precondition the lung for enhanced viral control. Collectively, our work shows that SARS-CoV-2 may benefit from an immunologically quiescent lung microenvironment and suggests that heterogeneity in pulmonary inflammation that precedes or accompanies SARS-CoV-2 exposure may be a significant factor contributing to the population-wide variability in COVID-19 disease outcomes.


Figures

Figure 1:
Figure 1:. Recent respiratory infection or underlying pulmonary inflammation at the time of SCV2 exposure limits early viral replication in the lungs of mice
For SCV2 (SCV2) infections, all mice were infected intranasally (i.n.) with 3.5x10⁴ TCID50 SCV2 (B.1.351) and euthanized three days later (d3). Viral loads were measured by TCID50 on Vero E6 cells and by qPCR for the SCV2 E gene in its sub-genomic form (sub-gRNA) (A) Lung viral loads of WT mice infected with Mtb by aerosol exposure 2 – 4 months before infection with SCV2 (B) Lung viral loads of WT mice infected intraphayngeally (i.ph.) with S. aureus USA300 three days before SCV2 infection (C) Lung SCV2 loads of WT mice i.n. infected with Influenza A virus (IAV, PR8) one month before SCV2 infection (D) Lung viral loads of WT mice intraperitoneally (i.p.) injected twice with ovalbumin and aluminum hydroxide (ova-alum) 30 and 16 days before SCV2 infection and i.n. OVAwas given 5 days before SCV2 infection. n= 9 – 18, data combined from 2 – 3 independent experiments, geometric mean, statistical significance calculated by two-tailed Mann Whitney test, LD= limit of detection.
Figure 2:
Figure 2:. Recent one-time pulmonary TLR pre-stimulation is sufficient to suppress early SCV2 replication in the lung
(A) Left: WT mice were administered PBS, 10μg CpG B (ODN1826, CpG) or 50μg Pam3CSK4 (Pm3) i.ph. one week before i.n. infection with 3.5x10⁴ TCID50 SCV2 (SCV2) (B.1.351) and assessed for lung viral loads three days later (3dpi). Right: TCID50 lung viral loads n=20-26, data combined from five independent experiments (B) Left: WT mice were i.ph. administered PBS or 10μg CpG i.ph seven weeks before i.n. infection with 3.5x10⁴ TCID50 SCV2 (B.1.351). Right: TCID50 lung viral loads at 3dpi, n= 8-9, data combined from two independent experiments. (C) Left: K18-hACE2 Tg mice were i.ph. administered PBS, 10μg CpG or 50μg Pm3 one week before i.n. infection with 1x10³ TCID50 SCV2 (USA-WA1/2020) Right: lung viral loads 3dpi measured by TCID50 or qPCR for sub-gRNA SCV2 E gene, n= 11-13, data combined from three independent experiments. (D) K18-hACE2 Tg mice were treated and infected as described in (C) and monitored for time to clinical endpoint (survival) for 18 days post SCV2 infection. Mouse survival is shown as a Kaplan-Meier curve with significance determined by Mantel-Cox test, n= 24-33, data combined from six independent experiments (E – G). K18-hACE2 Tg mice i.ph. administered PBS, CpG or Pm3 and one week later infected i.n. with SCV2 USA-WA1/2020 Lung total RNA sequencing was performed at 3dpi (n = 3-4 mice per group in one experiment). (E) GO analysis of significant DEGs (F) Volcano plots of candidate DEGs comparing SCV2 infected mice pre-treated with CpG (left panel) or Pm3 (right panel) to SCV2-only infected control animals. DEGs significantly upregulated in both treatment groups are labeled. (G) DEGs after SCV2 infection in common to both TLR pretreatment groups were entered into ImmGen MyGeneSet. Expression across cell types as analyzed by ImmGen are visualized in a heatmap, AU (arbitrary units), navy= lowest expression, orange= highest expression; ILCs (innate lymphoid cells), DCs (dendritic cells), Monos (monocytes), Grans (granulocytes), Mast (mast cells) (H) Viral loads in lungs of WT and Alox15−/− mice 3 days post-i.n. infection with 3.5x10⁴ TCID50 SCV2 (B.1.351) as measured by TCID50 on Vero E6 cells, n= 6-8, data combined from 2 independent experiments. (A – C, H) geometric mean, statistical significance determined by two-tailed Mann Whitney test, LD= limit of detection, n.s.= not significant.
Figure 3:
Figure 3:. Recent pulmonary exposure to TLR agonists results in remodeling of the tissue-resident macrophage compartment and sustained inflammatory cytokine responses prior to SCV2 exposure
(A – C) K18-hACE2 Tg mice were i.ph. treated with PBS, 10μg CpG or 50μg Pm3. Ten days later, mice were euthanized, RNA was extracted from lung tissue and total RNA sequencing was performed; data is from 3-4 mice per group from one independent experiment (A) Candidate DEGs visualized by volcano plots comparing CpG- (left panel) or Pm3- (right panel) treated mice to the PBS control animals. DEGs upregulated and common to both treatment groups are labeled. (B) GO analysis of identified significant DEGs in the indicated groups compared to the PBS only controls. (C) Venn diagram showing the DEGs in common between the CpG- and Pm3-treated groups compared to PBS controls. The candidate DEGs were entered into ImmGen’s MyGeneset browser. Expression across cell types as analyzed by ImmGen are visualized in a heatmap, AU (arbitrary units), navy= lowest expression, orange= highest expression; ILCs (innate lymphoid cells), DCs (dendritic cells), Monos (monocytes), Grans (granulocytes), Mast (mast cells) (D & E) For the SCV2 (SCV2) infection, all mice were infected i.n. with SCV2 (B.1.351) and euthanized three days later as measured by TCID50, geometric mean, LD= limit of detection. (D) TCID50 viral loads in lungs of WT and Ccr5−/− mice, n=19, data combined from five independent experiments. (E) Ccr5−/− mice were given PBS, 10μg CpG or 50μg Pm3 one week before SCV2 infection with n=6-8, data combined from 2 independent experiments, geometric mean, LD= limit of detection. (F) Quantification of alveolar macrophages (AM) by flow cytometry as a percentage of CD45+ cells in whole lung from WT mice treated with PBS, 10μg CpG or 50μg Pm3 i.ph. one week prior and histograms depicting relative expression of MHC-II and CD36 (G) Quantification of CD11b+, CD88+ interstitial macrophages (IM) that are recruited into the lung parenchyma (intravascular CD45 negative (i.vneg)) by flow cytometry as a percentage of CD45+ cells in whole lung from WT mice treated with PBS, CpG or Pm3 i.ph. one week prior and histograms depicting relative expression of MHC-II and CD36, n= 8-9, data combined from two representative experiments, geometric mean and standard deviation. (H) Lungs were collected at seven and ten days after PBS, 10μg CpG or 50μg Pm3 i.ph. administration and homogenates were assayed for the indicated cytokines by multiplex bead array, n = 6-8, data combined from two experiments, geometric mean. (D – H) Statistical significances compared to PBS pretreated controls were determined by two-tailed Mann Whitney test.
Figure 4:
Figure 4:. Pulmonary SCV2 replication is constrained by nucleic acid sensing, and signaling by IFNAR1 and TNFR1 but not IL-1R1
All mice were infected i.n. with 3.5x10⁴ TCID50 SCV2 (B.1.351) and euthanized three days later (d3). Viral loads were measured by TCID50 on Vero E6 cells except in (R). (A) Viral loads in lungs of WT and two different strains of Ifnar1−/− mice. (B) Experimental set-up where WT mice were i.p. injected with a neutralizing anti-IFNAR1 monoclonal antibody one day before SCV2 infection and lung viral loads (C – K) Viral loads in lungs of WT and various PRR KO mice: (C) Tlr3−/−, (D) Tlr7−/−, (E) MDA5, Ifih1−/−, (F) Tlr2−/−, (G) Tlr4−/−, (H) Tlr9−/−, (I) Tmem173gt (expresses an inactive variant of STING), (J) Zbp1−/−, (K) Nlrp3−/−. (L) Viral loads in lungs of WT mice that were i.p. injected with either PBS (−) or the NLRP3 inhibitor MCC950 (+) one day before and one day after SCV2 infection (M – Q) TCID50 viral loads in lungs of WT mice and mice deficient in inflammatory caspases or their substrates: (M) Casp1−/− (N) Casp1,11−/− (O) Gsdmd, Gsdme−/− (P) Il1a,b−/− and Il1r1−/−. (Q) Viral loads in lungs of WT mice and mice deficient in TNFR1, Tnfrsf1a−/− (R) Schematic of experimental set-up where WT mice were i.p. injected with a neutralizing anti-TNFα monoclonal antibody seven days before SCV2 infection and viral loads in lung as measured by qPCR for the SCV2 E gene with and without anti-TNFα treatment. n indicated below each group, data combined from 2 – 6 independent experiments, geometric mean, statistical significance calculated by Mann Whitney test, LD= limit of detection, n.s.= not significant, #= indicates result that was not significant by TCID50 but showed a significant difference by qPCR (see Fig S5E).
Figure 5:
Figure 5:. Recent IFN-I dependent and - independent inflammatory conditioning of the lung promotes SCV2 replication control at the tissue level
(A) Heatmap of fold change in the geometric mean fluorescence intensity (gMFI) of IFN-inducible surface marker (ISM) expression of Sca-1 and CD317 measured by flow cytometry on lung epithelial cell (EC) subsets from lungs of mice treated with various inflammatory or infectious stimuli compared to those from PBS control animals at the indicated time points without SCV2 infection, n=5-14, data is pooled from 2 – 4 independent experiments, for all conditions except OVA/Alum which was done once. (B) Ifnar1−/−, (C) Tnfrsf1a−/−, or (D) Il1r1−/− mice were i.ph. treated with PBS, 10μg CpG or 50μg Pm3 one week before SCV2 (B.1.351) infection. Viral loads in lungs were quantified by TCID50 or sub-gRNA SCV2 E qPCR, n=10-26, data are combined from 2 – 3 independent experiments each (E) Schematic of K18-hACE2 Tg mice administered 5μg recombinant mouse TNFα (rmTNFα) or 2.0x10⁴U recombinant mouse IFNβ (rmIFNβ) once, one week before infection with SCV2 (USA-WA1/2020) and lung viral titers, n=7-10, two independent experiments (F) Fold change in gMFI of Sca-1 and CD317 measured by flow cytometry on lung EC subsets of mice treated one week prior with rmTNFα or rmIFNβ, data is pooled from three independent experiments, n= 15-22 , *= p<0.05, **=p<0.01, ***=p<0.001, if not indicated, differences were not significant. (G) WT or Il1r1−/− mice given 200U recombinant mouse IL-1α (rmIL-1α) or IL-1β (rmIL-1β) i.ph. one week before SCV2 (B.1.351) infection and ung viral titers, n=8-10, data are combined from two independent experiments. (H) Fold change in gMFI of Sca-1 and CD317 measured by flow cytometry on EC subsets from lungs of mice treated one week prior with 200U rmIL-1α + rmIL-1β (100U each), n= 9-10, data is pooled from two independent experiments. Geometric mean, statistical significance determined by two-tailed Mann-Whitney test, LD= limit of detection, *= p<0.05, **=p<0.01, ***=p<0.001, n.s.= not significant, if not indicated differences were not significant, white arrows indicate direction of fold change.

References

    1. Barber R.M., Sorensen R.J.D., Pigott D.M., Bisignano C., Carter A., Amlag J.O., Collins J.K., Abbafati C., Adolph C., Allorant A., et al. (2022). Estimating global, regional, and national daily and cumulative infections with SARS-CoV-2 through Nov 14, 2021: a statistical analysis. The Lancet 399, 2351–2380. 10.1016/S0140-6736(22)00484-6. - DOI - PMC - PubMed
    1. Asano T., Boisson B., Onodi F., Matuozzo D., Moncada-Velez M., Maglorius Renkilaraj M.R.L., Zhang P., Meertens L., Bolze A., Materna M., et al. (2021). X-linked recessive TLR7 deficiency in ~1% of men under 60 years old with life-threatening COVID-19. Sci Immunol 6. 10.1126/sciimmunol.abl4348. - DOI - PMC - PubMed
    1. Su H.C., Jing H., Zhang Y., and Casanova J.L. (2023). Interfering with Interferons: A Critical Mechanism for Critical COVID-19 Pneumonia. Annu Rev Immunol 41, 561–585. 10.1146/annurev-immunol-101921-050835. - DOI - PubMed
    1. Zhang Q., Bastard P., Liu Z., Le Pen J., Moncada-Velez M., Chen J., Ogishi M., Sabli I.K.D., Hodeib S., Korol C., et al. (2020). Inborn errors of type I IFN immunity in patients with life-threatening COVID-19. Science 370. 10.1126/science.abd4570. - DOI - PMC - PubMed
    1. Cevik M., Tate M., Lloyd O., Maraolo A.E., Schafers J., and Ho A. (2021). SARS-CoV-2, SARS-CoV, and MERS-CoV viral load dynamics, duration of viral shedding, and infectiousness: a systematic review and meta-analysis. Lancet Microbe 2, e13–e22. 10.1016/S2666-5247(20)30172-5. - DOI - PMC - PubMed

Publication types