[Preprint]. 2024 Mar 28:rs.3.rs-4145750.
doi: 10.21203/rs.3.rs-4145750/v1.

Comprehensive genomic analysis reveals molecular heterogeneity in pediatric ALK-positive anaplastic large cell lymphoma

Affiliations

Comprehensive genomic analysis reveals molecular heterogeneity in pediatric ALK-positive anaplastic large cell lymphoma

Timothy I Shaw et al. Res Sq. .

Update in

Abstract

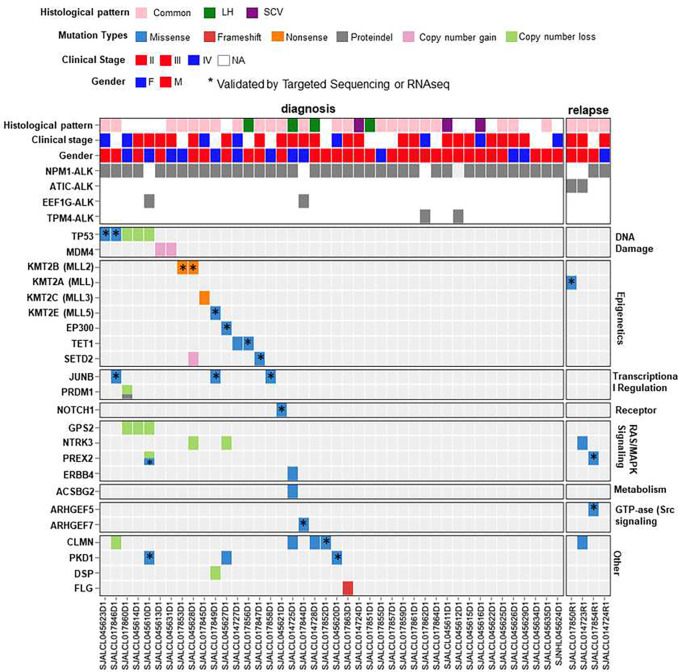
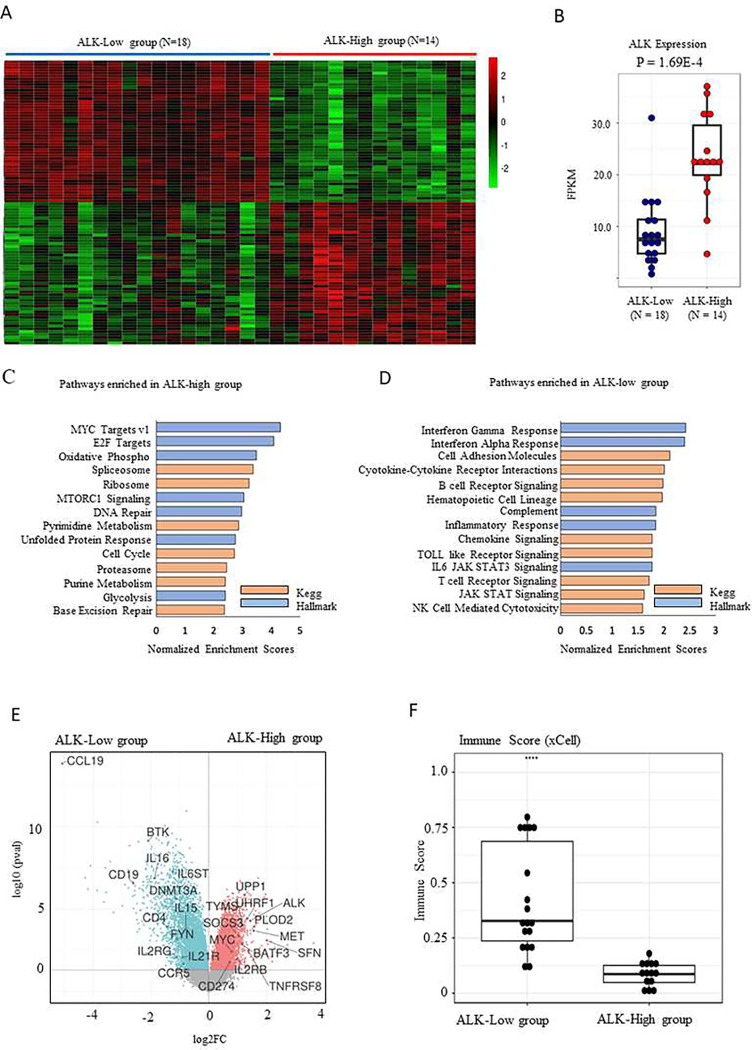
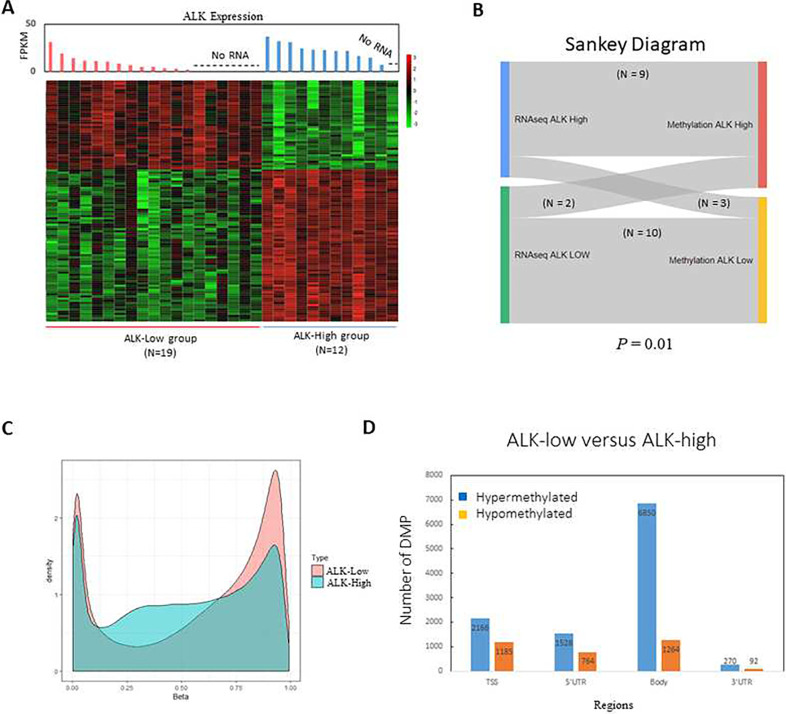
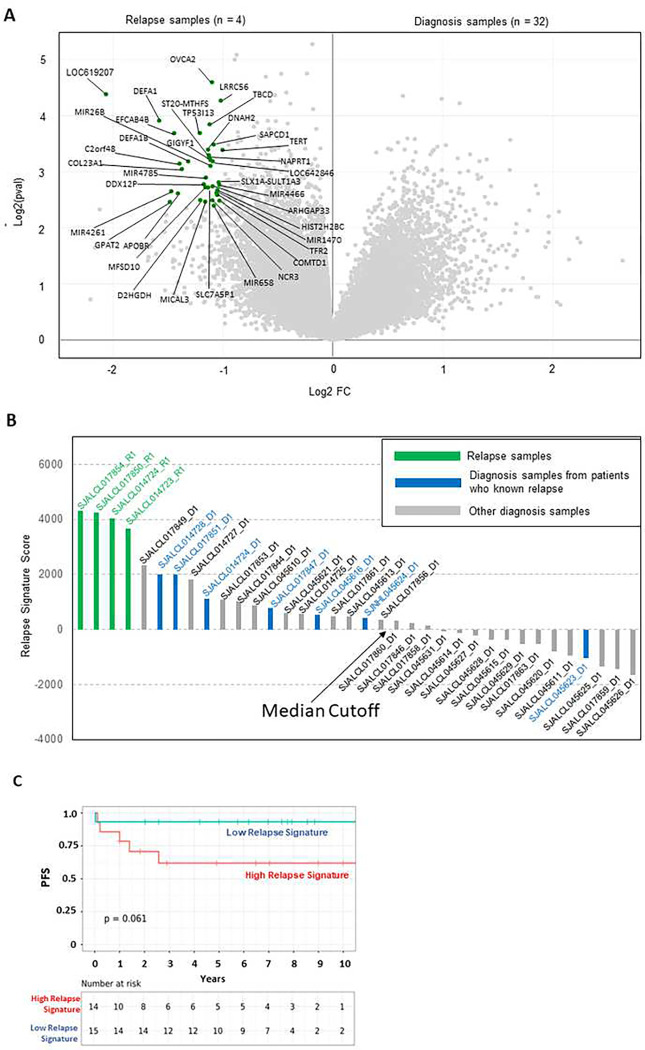
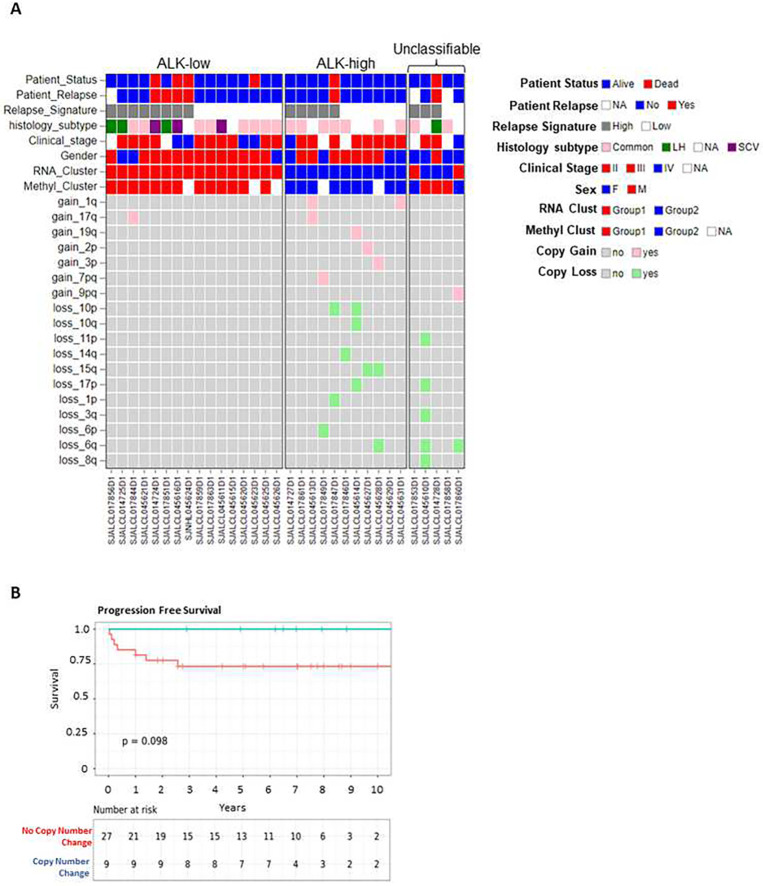
Anaplastic large cell lymphoma (ALCL) is a mature T-cell lymphoma that accounts for for 10-15% of childhood lymphomas. Despite the observation that more than 90% of pediatric cases harbor the anaplastic lymphoma kinase (ALK) rearrangement resulting in aberrant ALK kinase expression, there is significant clinical, morphologic, and biological heterogeneity. To gain insights into the genomic aberrations and molecular heterogeneity within ALK-positive ALCL(ALK+ ALCL), we analyzed 46 pediatric ALK+ ALCLs by whole-exome sequencing, RNA-sequencing, and DNA methylation profiling. Whole-exome sequencing found on average 25 SNV/Indel events per sample with recurring genetic events in regulators of DNA damage (TP53, MDM4), transcription (JUNB), and epigenetic regulators (TET1, KMT2B, KMT2A, KMT2C, KMT2E). Gene expression and methylation profiling consistently subclassified ALK+ ALCLs into two groups characterized by diferential ALK expression levels. The ALK-low group showed enrichment of pathways associated with immune response, cytokine signaling, and a hypermethylated predominant pattern compared to the ALK- high group, which had more frequent copy number changes, and was enriched with pathways associated with cell growth, proliferation, metabolic pathways, and. Taken together, these findings suggest that there is molecular heterogeneity within pediatric ALK+ALCL, predicting distinct biological mechanisms that may provide novel insights into disease pathogenesis and represent prognostic markers.


Conflict of interest statement

Conflict of Interest T.I. Shaw reports a patent for EBD CAR pending. C.G. Mullighan reports personal fees from Illumina during the conduct of the study, as well as grants from Pfizer and AbbVie, and other support from Amgen outside the submitted work. No disclosures were reported by the other authors.

Figures

Figure 1.
Figure 1.. Genomic alterations in pediatric ALCL.
Heatmap demonstrates the somatic mutation profile and copy number (CN) alterations identified in the cohort of pediatric ALK+ALCL samples by WES, separated by gene functional groups. Only genetic alterations with presumed functional consequences are shown. Split cell for the PRDM1 gene indicates more than one mutation. (*) indicates mutations validated by targeted sequencing or RNAseq.
Figure 2.
Figure 2.. Gene expression profile classifies pediatric ALCL into two groups.
(A) Unsupervised hierarchical clustering reveals two distinct groups. The top 100 differentially expressed genes are shown as a heatmap. (B) Boxplot of differential ALK expression levels in ALCL samples detected by RNA seq analysis (P=0.026). FPKM, fragments per kilobase of exon per million mapped fragments. (C and D) Pathway analysis in ALK-low and ALK-high groups (KEGG and MSigDB), p-value <0.05 and FDR < 0.05. (E) Differential expression represented as a volcano plot. ALK-low group shows up-regulation of cytokine and immune related markers. ALK-high group shows up-regulation of ALK, MYC, and other proliferative markers. (F) xCell analysis shows differential Immune Scores in ALCL samples.
Figure 3.
Figure 3.. Genome-wide DNA methylation classifies pediatric ALCL in two groups.
(A) Unsupervised clustering with bootstrapping identified two separate clusters. Each probe was then summarized to a single value for each associated genomic region. Each methylation value was annotated as Hyper-methylation or Hypo-methylation. Differential methylation was performed using Wilcoxon rank-sum test. FPKM, fragments per kilobase of exon per million mapped fragments. (B) Sankey diagram representation of the unsupervised hierarchical clustering result. The diagram depicts the group clustering based on RNA expression and methylation profiling. (C) Histogram of the methylation probe intensity (Beta value) in the ALK-high and ALK-low group (D) Bar plot representation of the differentially methylated gene regions. Hyper-methylated regions were more frequently differentially methylated than hypo-methylated regions. DMP, differentially methylated positions; TSS, transcription start site.
Figure 4.
Figure 4.. Genes that show correlation between probe methylation status and ALK expression
Correlation analysis is based on Spearman Rank with positive correlation shown in (A) and negative correlation shown in (B). Both are filtered based on an absolute rho value cutoff of 0.75. Bar plots show enriched pathways from EnrichR’s ChEA_2016 sorted by their log transformed p-value score.
Figure 5.
Figure 5.. Relapsed signature score in pediatric ALK+ALCL patients.
(A) Differential gene expression analysis between relapse and diagnosis samples from ALCL patients. Genes differentially up-regulated in relapsed samples are highlighted in green. (B) The relapse signature score is calculated based on single-sample GSEA. Samples were ordered based on the calculated relapse signature score. Relapse samples are colored in red. Diagnosis samples of patients who eventually relapse are colored in blue. The remaining diagnosis samples are colored in gray. The median cutoff for the diagnosis samples is indicated by the arrow. (C) Kaplan-Meier graph showing progression free survival (PFS) according to the relapse signature score. The relapse signature score was categorized into HIGH and LOW based on the median level. A statistically significant difference of the Kaplan–Meier survival curves between the high and low malignancy-risk groups was determined by the two-sided log-rank test. The number of patients at risk is listed below the survival curves.
Figure 6.
Figure 6.. Overview of clinical findings and copy number changes associated with the two ALCL groups and impact on outcome.
(A) Heatmap with the distribution of clinical findings and copy number alterations in the diagnostic ALCL samples; cases are assigned to ALK-low and ALK-high group based on the expression and methylation profile. Five cases were classified differently based on RNA expression and DNA methylation analysis (designated as unclassifiable) (B) Kaplan-Meier curve showing progression free survival (PFS) in ALCL according to the presence of copy number changes.

References

    1. Cairo MS, Pinkerton R. Childhood, adolescent and young adult non-Hodgkin lymphoma: state of the science. Br J Haematol 2016. May 2. - PubMed
    1. Stein H, Mason DY, Gerdes J, O’Connor N, Wainscoat J, Pallesen G, et al. The expression of the Hodgkin’s disease associated antigen Ki-1 in reactive and neoplastic lymphoid tissue: evidence that Reed-Sternberg cells and histiocytic malignancies are derived from activated lymphoid cells. Blood 1985. Oct; 66(4): 848–858. - PubMed
    1. Stein H, Foss HD, Durkop H, Marafioti T, Delsol G, Pulford K, et al. CD30(+) anaplastic large cell lymphoma: a review of its histopathologic, genetic, and clinical features. Blood 2000. Dec 1; 96(12): 3681–3695. - PubMed
    1. Jaffe ES. The 2008. WHO classification of lymphomas: implications for clinical practice and translational research. Hematology Am Soc Hematol Educ Program 2009: 523–531. - PMC - PubMed
    1. Jiang M, Bennani NN, Feldman AL. Lymphoma classification update: T-cell lymphomas, Hodgkin lymphomas, and histiocytic/dendritic cell neoplasms. Expert Rev Hematol 2017. Mar; 10(3): 239–249. - PMC - PubMed

Publication types