[Preprint]. 2024 Apr 3:2024.03.29.587339.
doi: 10.1101/2024.03.29.587339.

Synaptic-dependent developmental dysconnectivity in 22q11.2 deletion syndrome

Affiliations

Synaptic-dependent developmental dysconnectivity in 22q11.2 deletion syndrome

F G Alvino et al. bioRxiv. .

Update in

  • Synaptic-dependent developmental dysconnectivity in 22q11.2 deletion syndrome.
    Alvino FG, Gini S, Minetti A, Pagani M, Sastre-Yagüe D, Barsotti N, De Guzman E, Schleifer C, Stuefer A, Kushan L, Montani C, Galbusera A, Papaleo F, Kates WR, Murphy D, Lombardo MV, Pasqualetti M, Bearden CE, Gozzi A. Alvino FG, et al. Sci Adv. 2025 Mar 14;11(11):eadq2807. doi: 10.1126/sciadv.adq2807. Epub 2025 Mar 12. Sci Adv. 2025. PMID: 40073125 Free PMC article.

Abstract

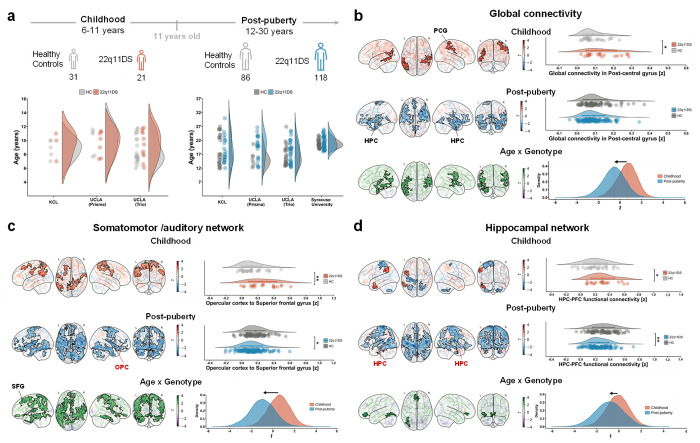
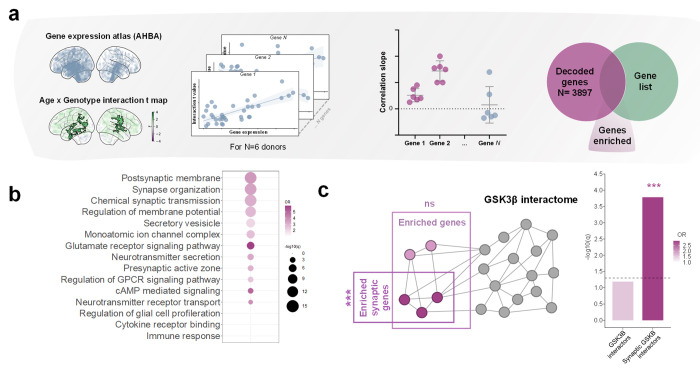
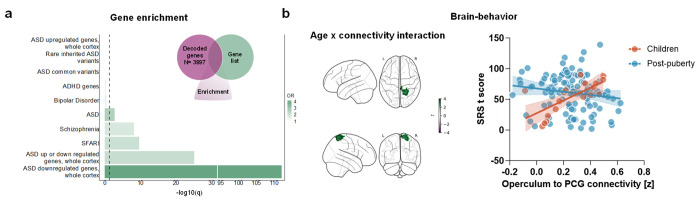
Chromosome 22q11.2 deletion is among the strongest known genetic risk factors for neuropsychiatric disorders, including autism and schizophrenia. Brain imaging studies have reported disrupted large-scale functional connectivity in people with 22q11 deletion syndrome (22q11DS). However, the significance and biological determinants of these functional alterations remain unclear. Here, we use a cross-species design to investigate the developmental trajectory and neural underpinnings of brain dysconnectivity in 22q11DS. We find that LgDel mice, an established mouse model of 22q11DS, exhibit age-specific patterns of functional MRI (fMRI) dysconnectivity, with widespread fMRI hyper-connectivity in juvenile mice reverting to focal hippocampal hypoconnectivity over puberty. These fMRI connectivity alterations are mirrored by co-occurring developmental alterations in dendritic spine density, and are both transiently normalized by developmental GSK3β inhibition, suggesting a synaptic origin for this phenomenon. Notably, analogous hyper- to hypoconnectivity reconfiguration occurs also in human 22q11DS, where it affects hippocampal and cortical regions spatially enriched for synaptic genes that interact with GSK3β, and autism-relevant transcripts. Functional dysconnectivity in somatomotor components of this network is predictive of age-dependent social alterations in 22q11.2 deletion carriers. Taken together, these findings suggest that synaptic-related mechanisms underlie developmentally mediated functional dysconnectivity in 22q11DS.


Figures

Figure 1.
Figure 1.. Developmental fMRI dysconnectivity in LgDel mice.
(a) Experimental timeline of fMRI mapping in WT and LgDel mice. (b) Whole-brain voxelwise mapping of global fMRI connectivity revealed widespread hyperconnectivity in LgDel juvenile mice, reverting to focal hippocampal hypoconnectivity in the same animals after puberty. Maps are thresholded at |t| > 2.0, followed by FWER correction at p<0.05. Semi-transparent right hippocampal blob indicates a cluster not surviving FWER correction. Corresponding age x genotype maps and quantifications of fMRI global connectivity in dorsal hippocampal areas are reported for reference. (c) and (d) illustrate seed-based mapping of the DMN (c) and Hippocampus (d), respectively. Maps on the left show extension of reference DMN (c) and hippocampal (d) networks in juvenile WT mice. Corresponding between-group difference maps are reported for each of the probed developmental ages in the center panels. Red indicates increased fMRI connectivity, and blue indicates reduced fMRI connectivity compared to control WT littermates (|t| > 2.0, FWER corrected, p < 0.05). (e, f) Regional quantification of pairwise fMRI connectivity between regions of the DMN (e) and hippocampal networks (f) exhibiting significant age x genotype interaction as per maps in (c) and (d). *p<0.05, **p < 0.01, ***p < 0.001. [BF, basal forebrain, CG, Cingulate cortex, HY, hypothalamus, HPC, hippocampus, LS, lateral septum, MO, motor cortex, PFC, prefrontal cortex].
Figure 2
Figure 2. Developmental fMRI dysconnectivity in human 22q11DS.
(a) Schematic representation of human cohort divided into the Childhood cohort (HC n=31; 22q11DS n=21) and Post-pubertal cohort (HC n= 86; 22q11DS n=118). Distribution of age for each diagnosis (HC and 22q11DS) across sites and scanners. (b) Voxel-wise (left panels) mapping of global fMRI connectivity revealed increased functional connectivity in 22q11DS carriers during childhood, and reduced fMRI connectivity in the post-pubertal cohort. Semi-transparent maps in the background represent unthresholded t-values. Clusters surviving FWER correction are outlined in black. Areas exhibiting a significant age x genotype interaction were identified using a linear model. Whole-brain distribution of t values resulting from group differences at each age revealed a robust shift (arrow) from prevalent hyperconnectivity in childhood to prevalent hypoconnectivity after puberty (bottom right of panel). (c) and (d) Seed-based analysis using clusters exhibiting significant age x genotype interaction in our global fMRI connectivity analysis as seeds: OPC (c) and hippocampus (d). Distribution of t values resulting from between-group connectivity differences over development are also reported for reference. Note shift from hyper- to hypoconnectivity (arrow) occurring over puberty. [HPC, Hippocampus, OPC, Opercular cortex]. * p < 0.05, ** p < 0.01, *** p < 0.001.
Figure 3
Figure 3. Developmental fMRI dysconnectivity is paralleled by GSK3β-dependent alterations in dendritic spine density.
(a) Dendritic spine density measurements across development in the prefrontal cortex (PFC) and the hippocampus (HPC) revealed a significant age x genotype interaction. (b) Voxel-wise global fMRI connectivity in these two areas exhibited a similar developmental trajectory, with a significant age x genotype interaction both in PFC and HPC. (c) Intergroup differences in synaptic density and fMRI global connectivity show a quasi-linear relationship (R2 = 0.8). (d) Experimental timeline of the GSK3β inhibition treatment protocol (from p7 to p27), followed by fMRI and spine density measurements. (e) Developmental GSK3β inhibition rescued spine density increase in PFC of juvenile mice. Similarly, the same treatment restored global fMRI connectivity alterations in juvenile LgDel mice. Rescue map represents the comparison between LgDel SB-treated mice (LgDel SB) with LgDel vehicle-treated mice (LgDel) (|t| > 2.0, FWER cluster-corrected). Regional quantification of global fMRI connectivity across 4 groups (WT, WT SB, LgDel, LgDel SB) confirmed this result. Errors bars represents SEM. *p<0.05, **p < 0.01, ***p < 0.001. [HPC, hippocampus, PFC, prefrontal cortex].
Figure 4.
Figure 4.. Gene decoding supports involvement of synaptic mechanism in 22q11DS developmental dysconnectivity.
(a) Illustration of gene decoding and gene enrichment analyses used to investigate molecular mechanisms underlying developmental reconfiguration. The term “decoded genes” refers to genes that were spatially enriched (i.e. genes that displayed significantly higher expression) in areas that undergo hyper-to-hypoconnectivity reconfiguration in 22q11DS. (b) Decoded genes are specifically and significantly enriched for synaptic-related GO gene lists, corroborating the involvement of synaptic mechanisms in 22q11DS dysconnectivity. Color scale indicates odds ratio, while size of the dots represents −log10(q-value). Only visible dots were statistically significant at q < 0.05. (c) Schematic representation of gene enrichment analyses (left) and results (right) showing significant enrichment for synaptic interactors of GSK3β. Bar color indicates odds ratio, length represents −log10(q-value). Horizontal dashed line (in grey) represents significance at q < 0.05. * p < 0.05, ** p < 0.01, *** p < 0.001.
Figure 5.
Figure 5.. Developmental fMRI dysconnectivity within somatomotor areas predicts reciprocal social behavior in 22q11DS.
(a) Gene enrichment analyses showing highly significant enrichment between decoded genes and schizophrenia- and ASD-related genes. Bar color indicates odds ratio, length represents −log10(q-value). Vertical dashed line (in grey) represents significance at q < 0.05. (b) Voxelwise (left of panel) and ROI-based quantifications of relationship between opercular cortex connectivity and SRS score in 22q11 deletion carriers. Map represents areas of significant age x connectivity interaction in predicting SRS score (|t| > 2.0, FWER cluster-corrected). Quantification of relationship between opercular cortex to postcentral gyrus (PCG) connectivity and SRS within the two age groups separately (right).

References

    1. Vasa RA, Mostofsky SH, Ewen JB. The Disrupted Connectivity Hypothesis of Autism Spectrum Disorders: Time for the Next Phase in Research. Biological Psychiatry: Cognitive Neuroscience and Neuroimaging 1, 245–252 (2016). - PMC - PubMed
    1. Harikumar A, et al. Revisiting Functional Dysconnectivity: A Review of Three Model Frameworks in Schizophrenia. Current Neurology and Neuroscience Reports 23, 937–946 (2023). - PMC - PubMed
    1. Bullmore ET, Fornito A. Making connections: biological mechanisms of human brain (Dys) connectivity. Biological Psychiatry 93, 384–385 (2023). - PubMed
    1. van den Heuvel MP, Sporns O. A cross-disorder connectome landscape of brain dysconnectivity. Nature Reviews Neuroscience 20, 435–446 (2019). - PMC - PubMed
    1. Zerbi V, et al. Brain mapping across 16 autism mouse models reveals a spectrum of functional connectivity subtypes. Molecular Psychiatry 26, 7610–7620 (2021). - PMC - PubMed

Publication types