[Preprint]. 2024 Mar 25:2024.03.21.586110.
doi: 10.1101/2024.03.21.586110.

Deep learning to decode sites of RNA translation in normal and cancerous tissues

Affiliations

Deep learning to decode sites of RNA translation in normal and cancerous tissues

Jim Clauwaert et al. bioRxiv. .

Update in

Abstract

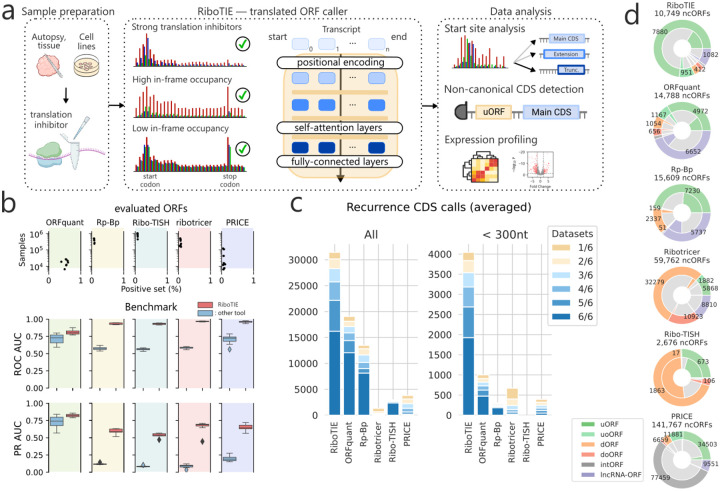
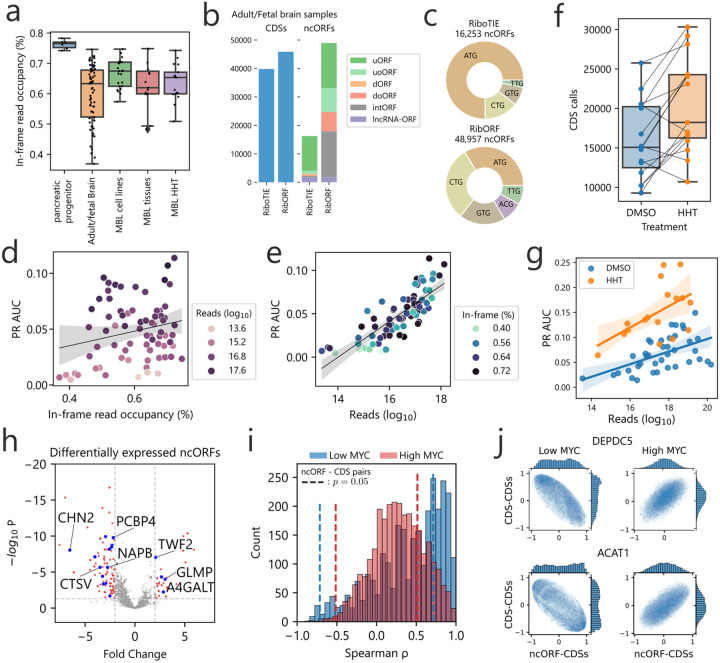
The biological process of RNA translation is fundamental to cellular life and has wide-ranging implications for human disease. Yet, accurately delineating the variation in RNA translation represents a significant challenge. Here, we develop RiboTIE, a transformer model-based approach to map global RNA translation. We find that RiboTIE offers unparalleled precision and sensitivity for ribosome profiling data. Application of RiboTIE to normal brain and medulloblastoma cancer samples enables high-resolution insights into disease regulation of RNA translation.

Keywords: RNA translation; Ribo-seq; cancer; medulloblastoma; non-canonical open reading frames.


Conflict of interest statement

Declaraon of Interests G.M. is an employee of OHMX Bio. Z.M. and R.G. are employees of Novo Nordisk Ltd. J.R.P. reports receiving honoraria from Novartis Biosciences.

Figures

Extended Data Figure 1:
Extended Data Figure 1:. Benchmark datasets characteristics.
a, Read length distributions for the benchmark datasets for reads mapped to the genome. The most abundant read length is generally around 29 nucleotides. b, 2D histogram of transcript-based coverage (y-axis) and reads mapped (x-axis). The number of mapped reads are normalized by transcript length (reads/nucleotide). The coverage is calculated based on the percentage of the transcript positions that have at least one read mapped by their 5’ position. The color map follows a logarithmic scale and is identical for all datasets. For each of the benchmark datasets, the percentage of transcripts in the transcriptome with no reads mapped is given (top-right corner).
Extended Data Figure 2:
Read length counts binned by reading frame offset for all benchmark datasets. Reads are mapped by their 5’ positions. The figure highlights the skewed abundance of reads as influenced by the reading frame of the neighboring translation initiation site. Similar plots have been used to filter or offset the mapping position of reads in relation to their length. Read counts are taken by only evaluating translation initiation sites of coding sequences within the consensus coding sequence (CCDS) library. A window of 20 nucleotides upstream and 40 nucleotides downstream is taken to calculate the total read counts.
Extended Data Figure 3:
Extended Data Figure 3:. RiboTIE performances for different input token strategies and datasets.
a, Illustration of two different strategies for constructing the RiboTIE input vector. Strategy A: the normalized read count is fed into short feed-forward neural network, where the output is used for an element-wise multiplication with a single vector embedding. Strategy B: vector embeddings are optimized for each read length. For a given input, read length embeddings are multiplied by the fractional representation of that read length at that position. Strategy B takes the sum of input vectors derived from the read count and read lengths. (b, c, d), Scores are calculated on the test set after selection of the model with the minimum validation loss. For each dataset and strategy, the cross-entropy loss, area under the receiver operating characteristic curve (ROC AUC), and area under the precision-recall curve (PR AUC) are given. Results indicate the relevance of read length information for the prediction of translation initiation sites using ribosome profiling data, especially for datasets featuring a higher read depth. All strategies are evaluated using the same model architecture and training/validation data. Strategy A has been evaluated for reads mapped by their 5’-end and reads offset based on read length information utilizing two different tools (Plastid, RiboWaltz).
Extended Data Figure 4:
Stacked bar plot denoting the number of ORFs for each type within the positive set of various tools on the pancreatic progenitor cells and adult/fetal brain samples. Tools tagged with “*” (ribotricer/Ribo-TISH) give output predictions on all ORFs within their ORF libraries. As such, a positive set with an identical size to that of RiboTIE was selected for comparison by taking the top scoring predictions.
Extended Data Figure 5:
Characteristics of nominated lncRNA-ORFs by RiboTIE, ORFquant, and Rp-Bp on pancreatic progenitor cells. Overlap with protein coding exons and CDSs is evaluated using the TISs of nominated lncRNA-ORF.
Extended Data Figure 7:
Clustering of Medulloblastoma cell line samples on non-canonical ORFs as called by RiboTIE. Clustering is performed on the normalized number of mapped reads (Transcripts Per Million (TPM)) using both PCA and T-SNE (Extended Data Table 4).
Figure 1:
Figure 1:. Machine learning to delineate RNA translation from Ribo-Seq data with RiboTIE.
a, Schematic that outlines the flexibility and function of RiboTIE as a machine learning model (transformers) for ribosome profiling data. b, Benchmarking analyses featuring eight datasets. RiboTIE is compared with five other tools for translated ORF delineation from ribosome profiling. Precision recall (PR) or Receiver Operator Characteristic (ROC) Area Under the Curve (AUC) scores are compared on ORF libraries that are unique to each tool. c, A stacked barplot that reflects the number of called annotated CDSs (le, all; right, <300nt) by each tool for six replicate samples of pancreatic progenitor cells, the fraction of CDSs that are found in a certain number of replicates is represented as well. d, The total number of non-canonical ORFs (ncORFs) and each type of ncORFs called by each tool combining all predictions on the six replicate samples of pancreatic progenitor cells. The inner fractions represent ncORFs present in >4 datasets.
Figure 2:
Figure 2:. Application of RiboTIE to human normal tissues and brain cancer for improved analysis of RNA translation.
a, Box plot showing the in-frame read occupancy (reads mapped to reading-frame vs. total reads within CDSs) for all data applied in this study (MBL: medulloblastoma). b, Bar plot displaying the combined number of unique calls for annotated CDSs and ncORFs on 73 adult/fetal brain samples as reported by the original paper (RibORF) and RiboTIE. c, A pie chart on the start codon distribution of all called ncORFs. d, Scatter plot displaying the PR AUC performance of RiboTIE on adult/fetal brain samples as a function of mapped reads on the transcriptome and e, in-frame read occupancy. f, Number of CDSs called by RiboTIE outlined by both a scatter plot and box plot for medulloblastoma cell lines treated with DMSO control or homoharringtonine (HHT). Identical cell lines are linked. g, Scatter and fited linear regression plot on 30 DMSO (blue) and 15 HHT (orange) medulloblastoma samples. h, Volcano plot showing differential expression of called ncORFs of low MYC (n=8) as compared to high MYC (n=15) expressing medulloblastoma cell lines. Threshold lines denote p = 0.05 (y-axis) and |fold change| > 2 (x-axis). Blue dots accompanied by listed gene names are ncORFs confirmed by TIS Transformer. i, Histogram showing correlation existent between ncORFs and their matching CDSs for both low MYC (blue) and high MYC (red) cell lines. Threshold lines denote p = 0.05. j, Scatter plots of Spearman rank correlations between the ncORF or downstream CDS and all other CDSs on the genome for both low and high MYC expression (SNAPC5/ACAT1).

References

    1. Brito Querido J., Diaz-Lopez I. & Ramakrishnan V. The molecular basis of translation initiation and its regulation in eukaryotes. Nat Rev Mol Cell Biol (2023). 10.1038/s41580-023-00624-9 - DOI - PubMed
    1. Kang J. et al. Ribosomal proteins and human diseases: molecular mechanisms and targeted therapy. Signal Transduct Target Ther 6, 323 (2021). 10.1038/s41392-021-00728-8 - DOI - PMC - PubMed
    1. Mudge J. M. et al. Standardized annotation of translated open reading frames. Nat Biotechnol 40, 994–999 (2022). 10.1038/s41587-022-01369-0 - DOI - PMC - PubMed
    1. Fedorova A. D., Kiniry S. J., Andreev D. E., Mudge J. M. & Baranov P. V. Thousands of human non-AUG extended proteoforms lack evidence of evolutionary selection among mammals. Nat Commun 13, 7910 (2022). 10.1038/s41467-022-35595-6 - DOI - PMC - PubMed
    1. Prensner J. R., Abelin J.G., Kok L.W., Clauser K.R., Mudge J.M., Ruiz-Orera J., Bassini-Sternberg M., Deutsch E.W., Moritz R.L., van Heesch S. What can Ribo-seq, immunopeptidomics, and proteomics tell us about the non-canonical proteome? Mol Cell Proteomics 22 (2023). 10.1016/j.mcpro.2023.100631. - DOI - PMC - PubMed

Publication types