[Preprint]. 2024 Mar 26:2024.03.21.586073.
doi: 10.1101/2024.03.21.586073.

Traumatic injury causes selective degeneration and TDP-43 mislocalization in human iPSC-derived C9orf72-associated ALS/FTD motor neurons

Affiliations

Traumatic injury causes selective degeneration and TDP-43 mislocalization in human iPSC-derived C9orf72-associated ALS/FTD motor neurons

Eric J Martin et al. bioRxiv. .

Abstract

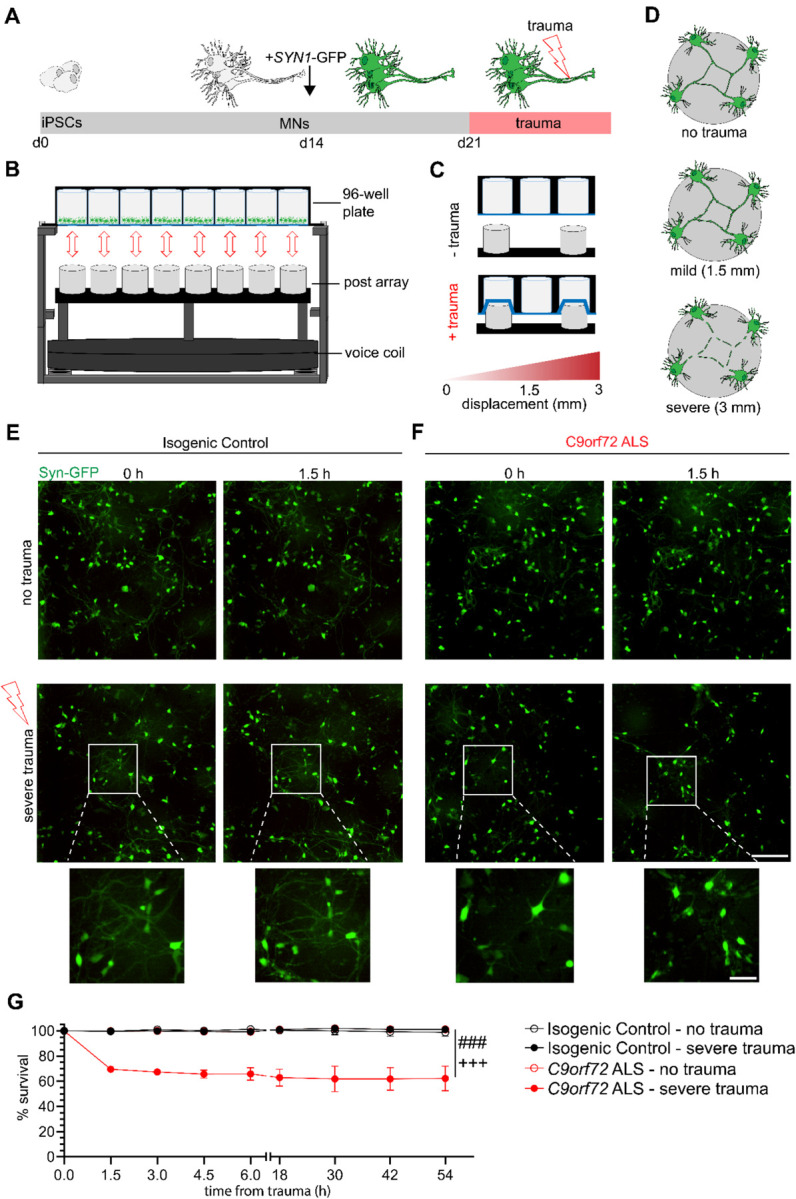
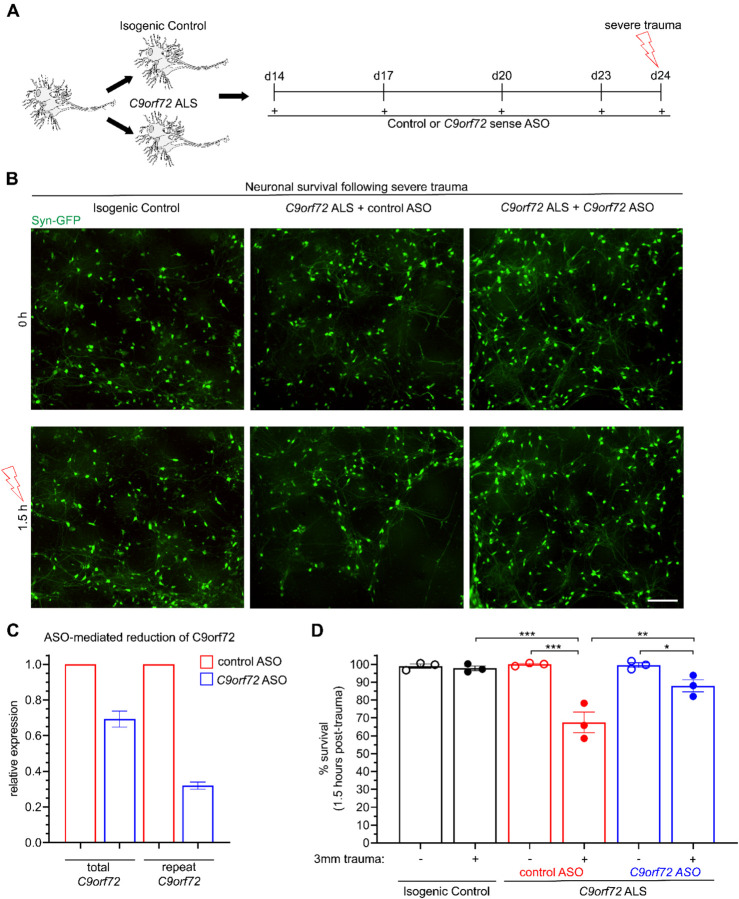
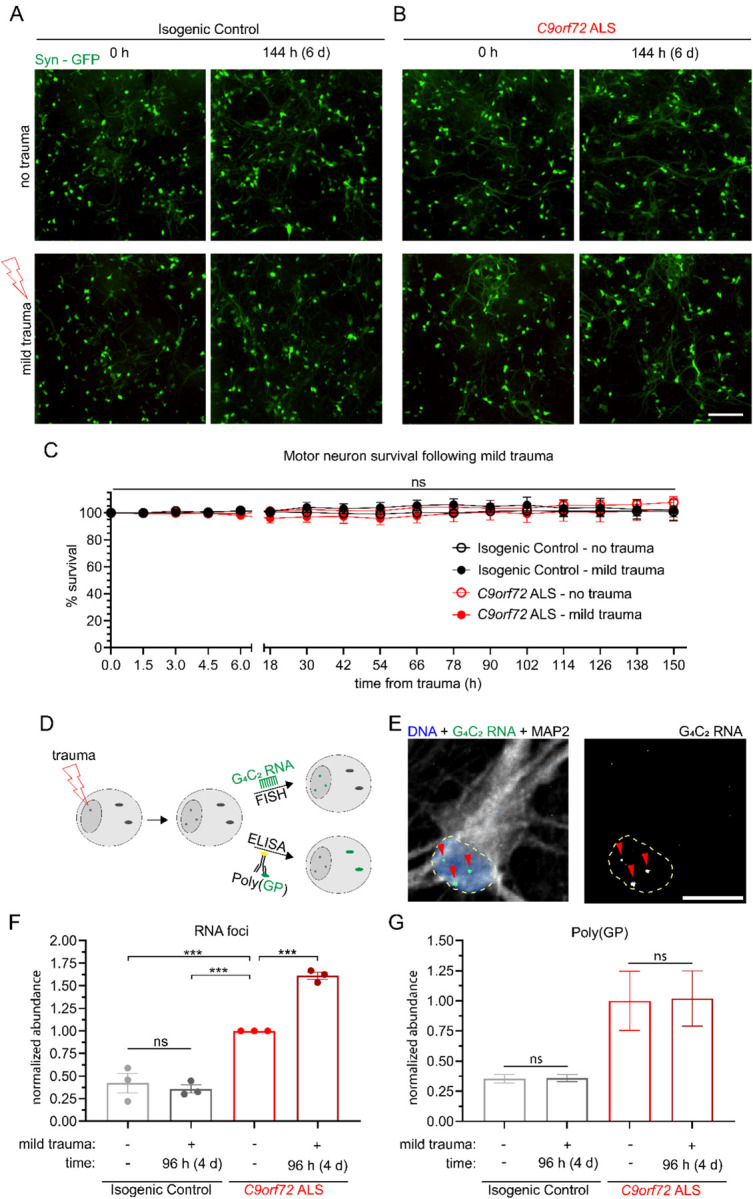
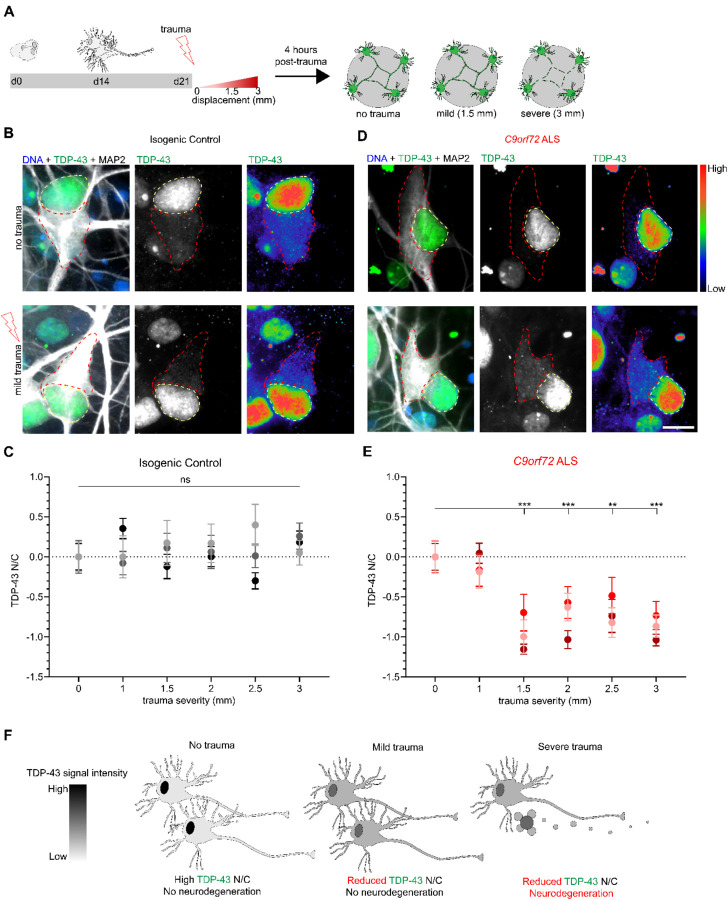
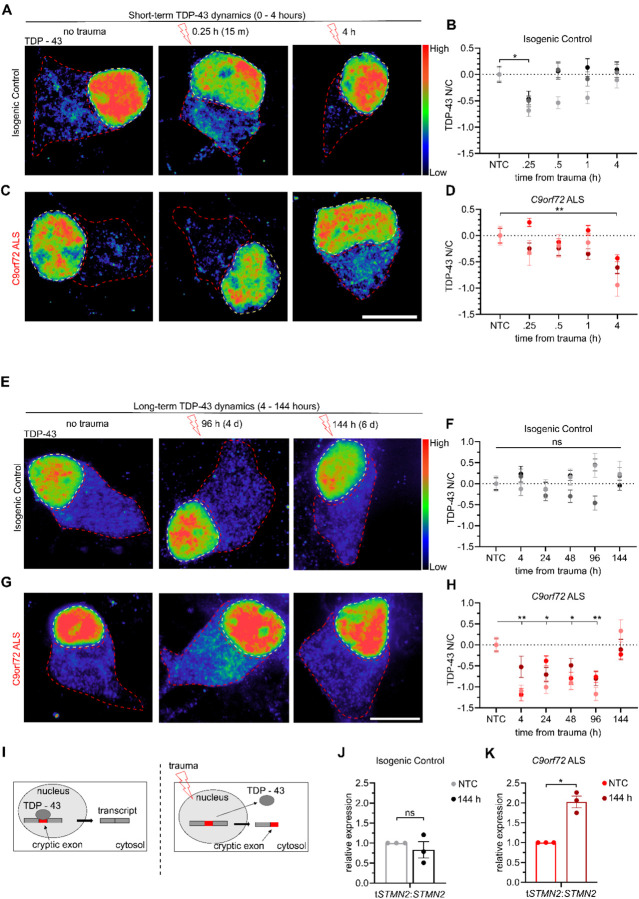
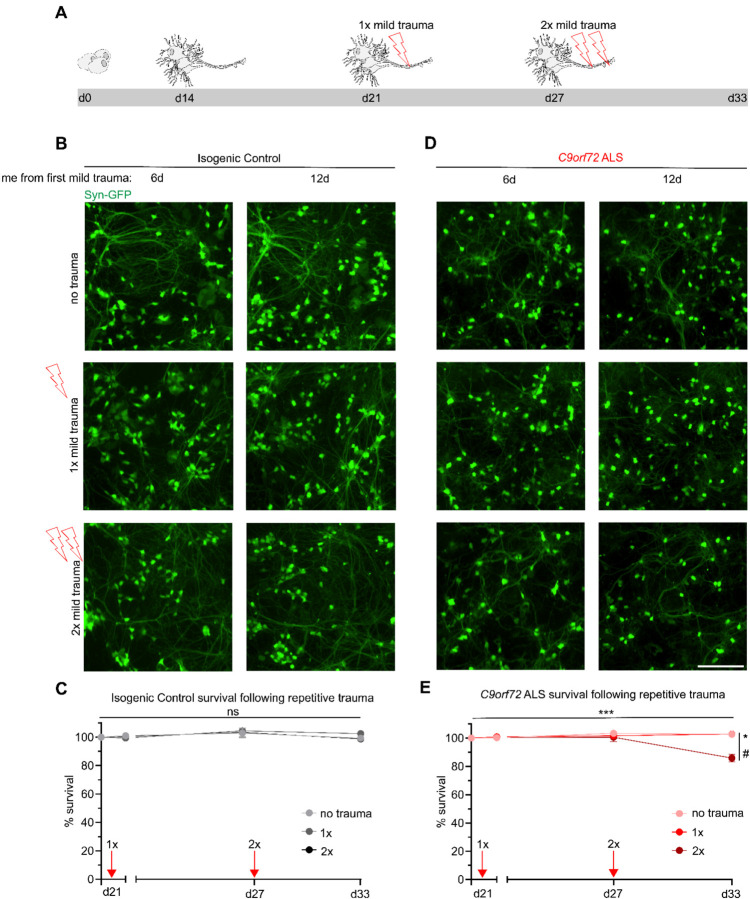
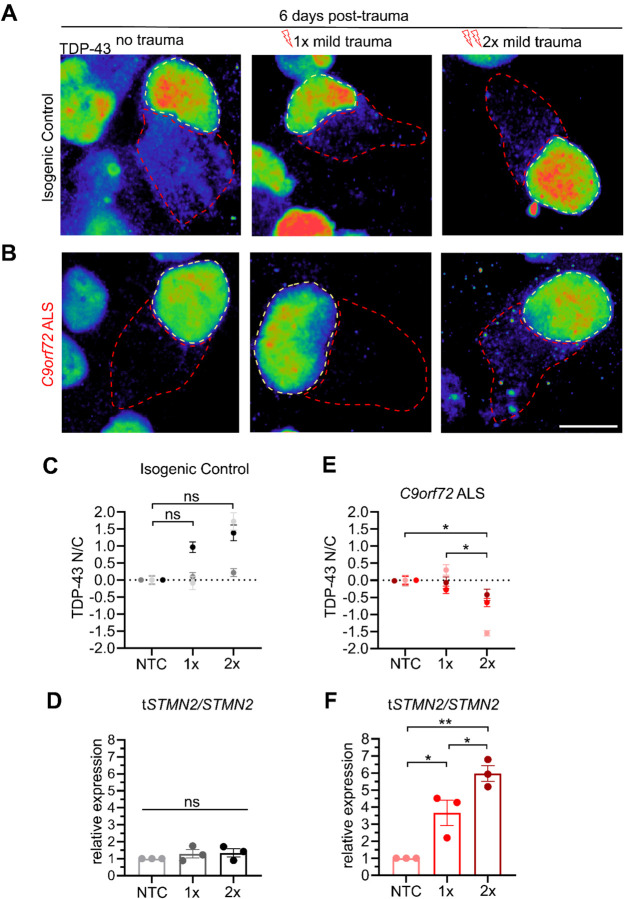
A hexanucleotide repeat expansion (HRE) in C9orf72 is the most common genetic cause of amyotrophic lateral sclerosis (ALS) and frontotemporal dementia (FTD). However, patients with the HRE exhibit a wide disparity in clinical presentation and age of symptom onset suggesting an interplay between genetic background and environmental stressors. Neurotrauma as a result of traumatic brain or spinal cord injury has been shown to increase the risk of ALS/FTD in epidemiological studies. Here, we combine patient-specific induced pluripotent stem cells (iPSCs) with a custom-built device to deliver biofidelic stretch trauma to C9orf72 patient and isogenic control motor neurons (MNs) in vitro. We find that mutant but not control MNs exhibit selective degeneration after a single incident of severe trauma, which can be partially rescued by pretreatment with a C9orf72 antisense oligonucleotide. A single incident of mild trauma does not cause degeneration but leads to cytoplasmic accumulation of TDP-43 in C9orf72 MNs. This mislocalization, which only occurs briefly in isogenic controls, is eventually restored in C9orf72 MNs after 6 days. Lastly, repeated mild trauma ablates the ability of patient MNs to recover. These findings highlight alterations in TDP-43 dynamics in C9orf72 ALS/FTD patient MNs following traumatic injury and demonstrate that neurotrauma compounds neuropathology in C9orf72 ALS/FTD. More broadly, our work establishes an in vitro platform that can be used to interrogate the mechanistic interactions between ALS/FTD and neurotrauma.

Keywords: C9orf72; Neurotrauma; TDP-43; amyotrophic lateral sclerosis (ALS); frontotemporal dementia (FTD); iPSC models; motor neurons; traumatic brain injury (TBI).


Conflict of interest statement

DECLARATION OF INTERESTS E.K is a cofounder of NeuronGrow, SAB member of Axion Biosystems, ResQ Biotech and Synapticure and a consultant for Confluence Therapeutics; named companies were not involved in this project. The authors declare no other competing interests.

Figures

Figure 1.
Figure 1.. C9orf72 ALS motor neurons show selective degeneration following severe stretch trauma.
(A) Differentiation schematic. Motor neurons are generated from iPSCs across 14 days, then transduced with SYN1-GFP. One week after transduction, trauma was performed. (B) Experimental apparatus for induction of stretch trauma. A voice coil drives the post array into a PDMS-bottom plate. (C) Visual schematic of stretch trauma. PDMS stretches as posts push up before returning to original conformation. (D) Visual schematic of varying degrees of trauma. (E-F) Live imaging of SYN1-GFP motor neurons immediately prior (0 h) and 1.5 hours after either no trauma (NTC) or severe trauma (3 mm) for either isogenic control (E) or C9orf72 (F) motor neurons. Cutout shows neuralization after severe trauma. Scale bar = 200 μm; inset scale bar = 50 μm (G) Quantification of percent survival of neurons within the frame of imaging across intervals of 1.5 hours for the first 6 hours and every 12 hours thereafter for a total of 54 hours. Experimental averages of 3 independent differentiations with 8 total fields of view. *** = p < .0005 for two-way ANOVA. Tukey’s multiple comparison tests for C9orf72 ALS – 3mm: p < .005 compared to Isogenic Control – no trauma (###) and Isogenic Control – 3mm (+++).
Figure 2.
Figure 2.. Neurodegeneration following severe trauma is partially rescued by pretreatment with an ASO targeting the C9orf72 repeat expansion.
(A) Experimental schematic for ASO treatment prior to severe trauma. (B) Live imaging of SYN1-GFP MNs 1.5 hours following severe trauma or no trauma. Scale bar = 200 μm. (C) Relative expression of total C9orf72 and repeat-associated C9orf72 in C9orf72 ALS MNs following treatment from a C9orf72 ASO specifically targeting the repeat expansion compared to a scramble ASO from 2 biological replicates (1 differentiation). (D) Quantification of percent survival 1.5 hours following trauma, showing differences between C9orf72 ALS pretreated with a scramble ASO (red) and a repeat-targeting ASO (blue). Experimental averages of 3 independent differentiations from 16 fields of view. Two-way ANOVA p < .0005. For Tukey’s multiple comparisons test, * = p < .05 ** = p < .01 *** = p < .005.
Figure 3.
Figure 3.. Mild trauma increases incidence of RNA foci but not DPR production in C9orf72 ALS motor neurons.
(A-B) Live imaging of synapsin-GFP isogenic control motor neurons across a period beyond 6 days (150 hours) following either no trauma or mild trauma (1.5 mm) in either isogenic control (A) or C9orf72 ALS (B) motor neurons. Scale bar = 200 μm. (C) Quantification of percent survival for over 6 days (150h) following mild trauma. Two-way ANOVA NS. (D) Experimental schematic for quantification of toxic gain of function C9orf72 pathologies. (E) Representative image of FISH probe analyzed for RNA foci. (F) Quantification of percent of neurons with RNA foci 4 days following mild trauma relative to C9orf72 ALS NTC. Experimental averages for 3 independent differentiations. Two-way ANOVA p < 0.0005. Tukey’s multiple comparisons test *** = p < 0.005 relative to C9orf72 ALS NTC. (G) ELISA quantification of poly(GP) DPR 4 days following mild trauma.
Figure 4.
Figure 4.. Traumatic injury induces TDP-43 mislocalization across a range of severities in C9orf72 ALS but not isogenic control motor neurons.
(A) Schematic depicting paradigm for stretch trauma across a range of severities. (B and D) Immunocytochemistry shows TDP-43 distribution in either isogenic control (B) or C9orf72 ALS (D) motor neurons prior to and 4 hours post-trauma. No trauma compared to 1.5mm displacement. Scale bar = 10 μm. (C and E) Z-score quantification of TDP-43 N/C at each displacement value relative to no trauma in either isogenic control (C) or C9orf72 ALS (E) motor neurons. Data represent experimental averages from 3 independent differentiations for a total of 84 – 91 (C) or 58 – 87 (E) cells. (C) One-way ANOVA NS (E) One-way ANOVA p < 0.0005. Tukey’s multiple comparisons test *** p < 0.005, ** p < 0.01. (F) Schematic representation of mild and severe trauma compared to no trauma with respect to TDP-43 N/C and viability.
Figure 5.
Figure 5.. Mild trauma induces extended TDP-43 mislocalization and increased mis-splicing of STMN2 in C9orf72 ALS motor neurons.
(A and C) Immunocytochemistry showing TDP-43 in either isogenic control (A) or C9orf72 ALS (C) motor neurons at 0 hours, 15 minutes (0.25 h), and 4 hours following mild trauma. Scale bar = 10 μm (B and D) Z-score quantification of TDP-43 N/C relative to no trauma in either isogenic control (B) or C9orf72 ALS (D) motor neurons. Data represent experimental averages from 3 independent differentiations for a total of 133 – 162 (B) or 132 – 139 (D) cells. (B) One-way ANOVA p < 0.05. Tukey’s multiple comparisons test * = p < 0.05. (D) One-way ANOVA p < 0.05. Tukey’s multiple comparisons test ** = p < 0.01. (E and G) Immunocytochemistry showing TDP-43 in either isogenic control (E) or C9orf72 ALS (G) motor neurons at 0 hours, 96 hours, and 144 hours following mild trauma. Scale bar = 10 μm (F and H) Z-score quantification of TDP-43 N/C relative to NTC in either isogenic control (F) or C9orf72 ALS (H) motor neurons. Data represent experimental averages from 3 independent differentiations for a total of 118 – 133 (F) or 123 – 138 (H) cells. (F) One-way ANOVA NS. (H) One-way ANOVA p < .0005. Tukey’s multiple comparisons test * = p < 0.05, ** = p < 0.01. (I) Visual schematic of mis-splicing caused by mild trauma. (J and K) Quantification of relative expression of truncated STMN2 (tSTMN2) relative to total expression (tSTMN2/STMN2) by qPCR for Isogenic Control (J) or C9orf72 ALS (K). Data for each line are normalized relative to no trauma. Data represent 3 independent differentiations analyzed by Welch’s t-test. * = p < 0.05.
Figure 6.
Figure 6.. Repetitive mild trauma facilitates neurodegeneration in C9orf72 ALS motor neurons.
(A) Schematic depicting trauma paradigm for repetitive injury. (B and D) Live imaging of synapsin-GFP motor neurons following either no trauma, 1x mild trauma or 2x mild trauma across an extended period of time (12 days from 1st trauma) in isogenic control (B) or C9orf72 ALS (D). Scale bar = 200 μm. (C and E) Quantification of synapsin-GFP motor neurons in isogenic control (C) or C9orf72 ALS (E) following trauma. Induction of mild trauma is indicated as a red arrow on the graph. Data represent 9 fields of view from 3 independent differentiations. (E) Two-way ANOVA; p < 0.0005. Tukey’s multiple comparisons test 2x vs NTC; * p <0.05 and 2x vs 1x # p < 0.05.
Figure 7.
Figure 7.. Repetitive mild trauma prevents TDP-43 recovery in C9orf72 ALS motor neurons.
(A-B) TDP-43 staining in cells 6 days post-trauma following either no trauma, 1x mild trauma, or 2x mild trauma in isogenic control (A) or C9orf72 ALS (B) motor neurons. Scale bar = 10 μm. (C and E) Quantification of TDP-43 N:C 6 days following mild traumas for either isogenic control (C) or C9orf72 ALS (E) motor neurons. (C) One-way ANOVA; NS. (E) One-way ANOVA; p < 0.05. Tukey’s multiple comparisons test relative to NTC indicated with * = p < 0.05; *** = p < 0.0005. 169–184 neurons from 3 independent differentiations. (D and F) Quantification of relative expression of truncated STMN2 (tSTMN2) relative to STMN2 6 days post-trauma following either no trauma, 1x mild trauma, or 2x mild trauma for isogenic control (D) or C9orf72 ALS (F) motor neurons. 3 biological replicates per conditions. (D) One-way ANOVA; NS. (F) One-way ANOVA; p < 0.005. Tukey’s multiple comparisons indicated * = p < 0.05 and ** = p < 0.01.

References

    1. Brown R.H. and Al-Chalabi A., Amyotrophic Lateral Sclerosis. New England Journal of Medicine, 2017. 377(2): p. 162–172. - PubMed
    1. Hardiman O., et al., Amyotrophic lateral sclerosis. Nature Reviews Disease Primers, 2017. 3: p. 17071–17071. - PubMed
    1. Shaw P.J., Molecular and cellular pathways of neurodegeneration in motor neurone disease, in Journal of Neurology, Neurosurgery and Psychiatry. 2005, BMJ Publishing Group. p. 1046–1057. - PMC - PubMed
    1. Grad L.I., et al., Clinical Spectrum of Amyotrophic Lateral Sclerosis (ALS), in Cold Spring Harbor perspectives in medicine. 2017. - PMC - PubMed
    1. Masrori P. and Van Damme P., Amyotrophic lateral sclerosis: a clinical review, in European Journal of Neurology. 2020, Blackwell Publishing Ltd. p. 1918–1929. - PMC - PubMed

Publication types