[Preprint]. 2025 Feb 10:2024.03.26.586815.
doi: 10.1101/2024.03.26.586815.

Repetitive head impacts induce neuronal loss and neuroinflammation in young athletes

Affiliations

Repetitive head impacts induce neuronal loss and neuroinflammation in young athletes

Morgane L M D Butler et al. bioRxiv. .

Abstract

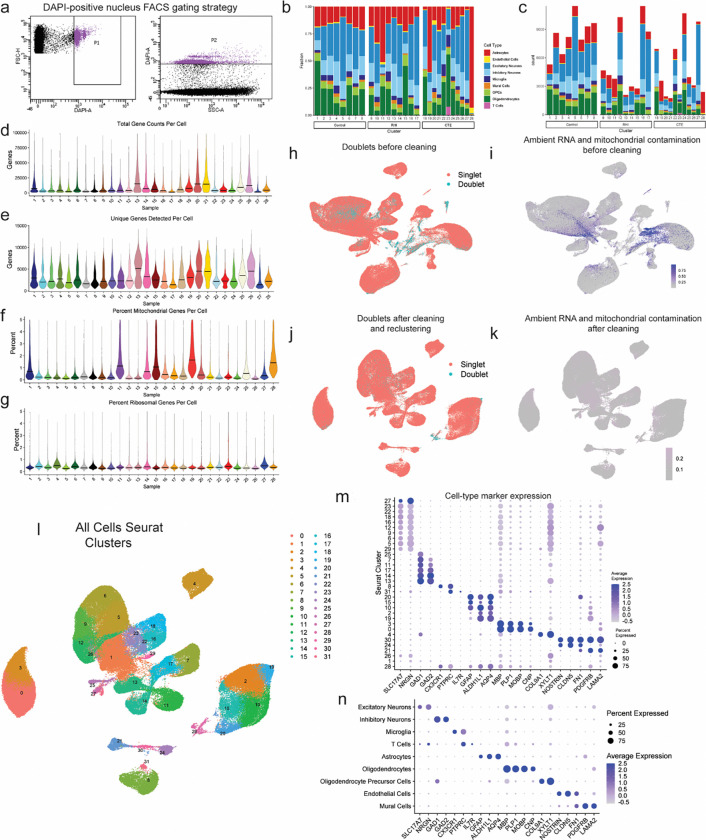
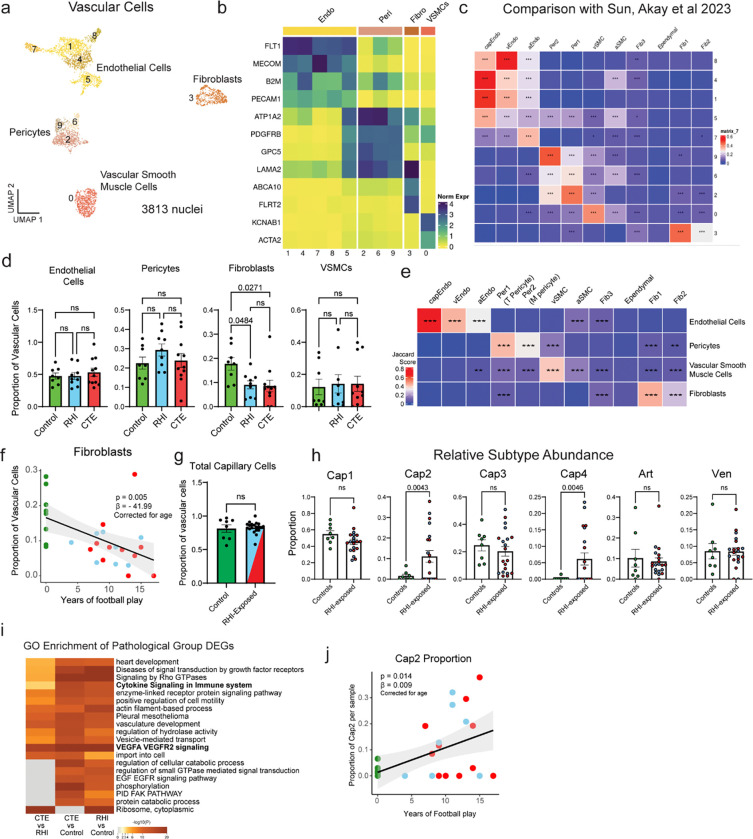
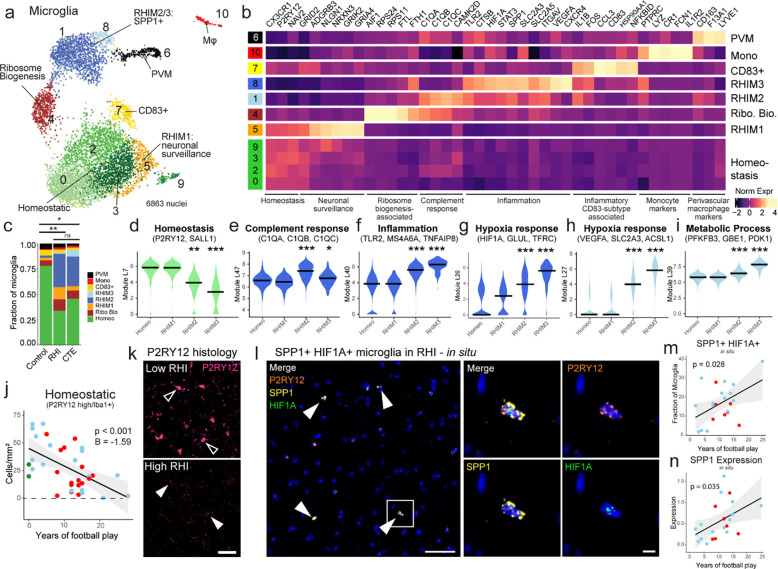
Repetitive head impacts (RHI) sustained from contact sports are the largest risk factor for chronic traumatic encephalopathy (CTE). Currently, CTE can only be diagnosed after death and the multicellular cascade of events that trigger initial hyperphosphorylated tau (p-tau) deposition remain unclear. Further, the symptoms endorsed by young individuals with early disease are not fully explained by the extent of p-tau deposition, severely hampering development of therapeutic interventions. Here, we show that RHI exposure associates with a multicellular response in young individuals (<51 years old) prior to the onset of CTE p-tau pathology that correlates with number of years of RHI exposure. Leveraging single nucleus RNA sequencing of tissue from 8 control, 9 RHI-exposed, and 11 low stage CTE individuals, we identify SPP1+ inflammatory microglia, angiogenic and inflamed endothelial cell profiles, reactive astrocytes, and altered synaptic gene expression in excitatory and inhibitory neurons in all individuals with exposure to RHI. Surprisingly, we also observe a significant loss of cortical sulcus layer 2/3 neurons in contact sport athletes compared to controls independent of p-tau pathology. Finally, we identify TGFB1 as a potential signal mediating microglia-endothelial cell cross talk through ligand-receptor analysis. These results provide robust evidence that multiple years of RHI exposure is sufficient to induce lasting cellular alterations that may underlie p-tau deposition and help explain the early pathogenesis in young former contact sport athletes. Furthermore, these data identify specific cellular responses to repetitive head impacts that may direct future identification of diagnostic and therapeutic strategies for CTE.


Conflict of interest statement

Competing Interests The authors report no conflicts of interest.

Figures

Extended Data Figure 1.
Extended Data Figure 1.. Dataset quality control and cell type marker validation.
a. Fluorescence activated cell sorting gating strategy of DAPI-positive nuclei. b. Stacked bar plot representing the proportion of cell type per donor. c. Stacked bar plot representing the cell type counts per donor. d-e. Violin plots for each donor of (d) total gene counts per cell, (e) unique genes detected per cell, (f) percent of mitochondrial genes detected per cell, and (g) percent ribosomal genes detected per cell. Line represents median. h, i UMAP of full dataset before cleaning colored by (h) doublet or singlets or (i) mitochondrial contamination. j, k. UMAP of full dataset after cleaning colored by (j) doublets or singlets or (k) mitochondrial contamination. l. UMAP of full dataset colored by Seurat clusters. m. Dot plot of cell type marker expression across Seurat clusters depicted in (l). n. Dot plot of cell type marker expression in annotated cell type clusters.
Extended Data Figure 2.
Extended Data Figure 2.. Microglial cluster GO analysis, histology, and validation.
a. Bar plots showing fraction of homeostatic and RHI microglia across pathological groups. Statistics performed by ANOVA with Bonferroni correction. *, p < 0.05, **, p <0.01. b. UMAPs showing microglia from each pathological group. Dashed line highlighting RHIM2/3. c. Bar plots showing microglial subtypes across control and RHI-exposed individuals (RHI and CTE). Statistical analysis performed by two-tailed t-test or Mann Whitney U test with Welch correction. d. UMAPs showing microglial expression of SPP1 and HIF1A. Dashed lines indicate RHIM2/3. e, f. Volcano plots showing DEGs between RHIM2/3 and homeostatic microglia (e) and RHIM2 and RHIM3 (f). g. Heatmap of GO analysis of RHI microglia. h. Heatmap of transcriptional regulatory network analysis of microglial subtype DEGs. i. UMAPs depicting microglia colored for module scores of microglial subtypes from Sun et al. j. Heatmap depicting Jaccard score similarity analysis between Sun et al. and current study microglial DEGs. **, p<0.01, ***, p<0.001. Statistical analysis performed using GeneOverlap package and Jaccard analysis settings. k. Representative images of P2RY12(pink/black), Iba1 (green) immunofluorescent labelling in a low RHI, high RHI, and CTE individual. P2RY12 was also provided in an inverted pseudo black/white scale to better visualize expression since it can be present, but weakly expressed and sometimes difficult to observe. Scale bar, 50μm. l, m, n. Scatter plots depicting SPP1+/HIF1A+ microglial fraction in the grey matter (l) crest, (m) L2/3 Sulcus (n) layers 4–6 sulcus colored by pathological group status compared to years of football play. Statistical analysis performed by linear regression. o. Scatter plot depicting P2RY12 low/Iba1+ microglial densities in the grey matter sulcus compared to years of football play. Statistical analysis performed by linear regression with age included as a covariate. p. Scatter plot comparing homeostatic microglial densities to Nissl+ neuronal densities in layers 2/3 (left) and layers 4–6 (right). Statistical analysis performed by linear regression with age as a covariate.
Extended Data Figure 3.
Extended Data Figure 3.. Vascular cell subtype identification and proportion analysis.
a. UMAP showing all vascular cells colored by Seurat clustering. b. Heatmap depicting vascular cell marker expression. c. Heatmap depicting Jaccard scoring of vascular cell Seurat cluster DEGs compared to Sun and Akay et al. vascular subtype DEGs **, p<0.01, ***, p<0.001. d. Bar plots depicting pathological group proportions of vascular subtypes, bar represents mean, error bar represents standard error of the mean, dots represent individual samples. Statistical analysis performed by ANOVA with Bonferroni correction. e. Heatmap depicting Jaccard scoring of vascular cell subtype DEGs compared to Sun and Akay et al. vascular subtype DEGs **, p<0.01, ***, p<0.001. f. Scatter plot of fibroblast proportion or Cap2 proportion compared to years of football play from snRNAseq dataset, colored by pathological group status. Statistical analysis performed by linear regression with age as a covariate. g, h. Bar plots of total capillary and relative endothelial cell subtype distribution across control and RHI-exposed samples, dots represent individual donors and are colored by pathological group identity. Bar indicates mean, error bars indicate standard error of the mean. Statistical analysis was performed by two sided Mann-Whitney U test. i. GO enrichment analysis of DEGs from depicted comparisons.
Extended Data Fig. 4.
Extended Data Fig. 4.. Layer 2/3 neurons are selectively lost in the grey matter sulcus and do not associate with tau pathology.
a. Scatter plot of CUX2/LAMP5 proportion from snRNAseq against total years of football play colored by pathological group. Statistical analysis performed by linear regression, depicted as line. b. Scatter plot showing CUX2/LAMP5 density from in situ hybridization compared to highest level of football played. Statistical analysis performed by simple linear regression. Dots represent individual samples; line shows linear regression. c. Scatter plot of CUX2/LAMP5 cells identified by in situ experiment compared to proportion of CUX2/LAMP5 neurons from snRNAseq experiment. Statistical analysis performed by simple linear regression, depicted as line with 95% confidence intervals in grey. d. Representative image showing the annotation of sulcus (yellow line) and crest (red line) layer 2/3. e. (left)Bar plot depicting layer 2/3 CUX2+/LAMP5+ neuronal density in the sulcus and crest. Statistical analysis performed by paired t-test. (right) Scatter plot showing layer 2/3 CUX2+/LAMP5+ neuronal density in the crest compared to years of football play, colored by pathological group status. Statistical analysis performed by simple linear regression. f. Scatter plot depicting all total CUX2 populations and subpopulations in snRNAseq and in situ hybridization experiments compared to years of football play. Statistical analysis performed by linear regression. g, h, i, j. Scatter plots depicting (g) Sulcus layers 4–6 Nissl+ density compared to binned years of football play, (h) Crest layer 2/3 Nissl+ density compared to binned years of football play, (i) L2/3 Nissl+ density compared to log tau+ density, (j) CUX2+/LAMP5+ density in situ compared to log tau+ density, Colored by pathological group status. Statistical analysis performed by simple linear regression, (g, h) corrected for age and staining batch. k, l. Representative images of Nissl staining across cortical layers depicting neuronal loss in superficial layers in RHI and CTE individuals. Scale bars, 100μm.
Figure 1.
Figure 1.. Cell type identification and cell proportion analysis across pathological groups.
a. Diagram depicting experimental workflow. b. AT8 immunohistochemistry of dorsolateral frontal cortex depth of sulci, dashed line represents the grey-white matter interface. Scale bar, 100μm. c. UMAP of nuclei from all donors labelled for cell type based on cell-type marker expression. d. Expression of cell type markers across cell type clusters in (c). e. Stacked bar plot of pathological group fractions within cell type clusters. f. Stacked bar plot of cell type counts colored by pathological group.
Figure 2.
Figure 2.. RHI Exposure induces distinct microglial phenotypes.
a. UMAP of microglia colored by 11 Seurat clusters determined by unsupervised clustering. b. Heatmap of selected cluster DEGs annotated by function. c. Proportion of microglial subtypes per pathological group. Statistical analysis was performed using a chi-squared test. d-i. Violin plots representing the expression of Celda gene modules. Color represents the cellular subtype most associated with the module. Black line represents median statistic from ggsignif. Statistical analysis performed by linear mixed modeling correcting for patient-specific effects. *, p <0.05, **, p <0.01, ***, p.<0.001. j. Scatter plot depicting the density of immunohistochemically labeled homeostatic microglia (P2RY12 high /Iba1+) in the grey matter sulcus compared to years of football play, colored by pathological group identity. Statistical analysis performed by linear regression with age as a covariate. k. Representative image of P2RY12 immunofluorescent labeling (pink) in a low RHI and high RHI individual. Open arrows depict high P2RY12-expressing cells. Solid arrows depict low P2RY12-expressing cells. Scale bar 50μm. l. Representative image depicting in situ hybridization of SPP1+ (yellow)/HIF1A+ (green)/P2RY12+ (orange) microglia in an RHI-exposed individual. Solid arrows indicate triple-positive cells. White box indicates inset displayed on the right. Left scale bar 50μm, right scale bar 5μm. m, n. Scatter plot depicting SPP1+ HIF1A+ microglial fraction and microglial SPP1 expression in the grey matter sulcus compared to years of football play. Colored by pathological group status. Statistical analysis performed by linear regression.
Figure 3.
Figure 3.. Endothelial angiogenic responses to RHI.
a. UMAP of endothelial cells colored by endothelial cell subcluster. Solid arrows indicate RHI/CTE enriched clusters. b. Stacked bar plots of capillary subtype abundance across pathological groups. Statistical analysis performed using a chi squared test. c. Dot plot of selected upregulated RHI/CTE DEGs across endothelial subtypes annotated for function. d. Violin plots of Celda module expression across capillary subtypes. Black bars indicate median statistic from ggsignif. Statistical analysis performed with linear mixed effects model accounting for sample variability and comparing Cap2–4 to Cap1. e. Violin plot of ITGAV expression across pathological groups. Each dot representing a cell. Statistical analysis performed by Wilcoxon test from ggsignif. *, p <0.05, ***, p<0.001. f. Scatter plot of ITGAV+ vessel fraction in the grey matter sulcus compared to years of football play colored by pathological group status. Statistical analysis performed by linear regression. g. Representative image of ITGAV+ vessel. Solid arrows indicate ITGAV+ vessel. White box indicates inset. Left scale bar, 5μm, right scale bar 50μm.
Figure 4.
Figure 4.. Synaptic transcriptomic changes and loss of sulcal excitatory layer 2/3 neurons.
a. UMAP of excitatory neurons colored and labelled by layer subtype determined by expression of layer-specific markers. b. Venn Diagram depicting the overlap between DEGs from RHI vs Control, CTE vs Control, and RHI vs CTE comparisons. c. Heatmap of GO terms identified in comparisons listed in (b). d. Bar plot representing cell counts per pathological group for each excitatory neuron layer subtype. Statistical analysis performed by ordinary one-way ANOVA with Bonferroni correction. *, p<0.05. e. Representative density heatmap of CUX2/LAMP5 positive cells, solid arrows indicated depth of the cortical sulcus. Red indicates high cellular density; blue indicates low cellular density. Scale bar, 1 mm. f. Scatter plot showing the fraction of CUX2/LAMP5 neurons within total excitatory neurons in snRNAseq data against total years of football play colored by pathological group identity. Dots depict individual samples, line represents general linear model regression, grey shows 95% confidence interval g. Scatter plot showing cell density of CUX2/LAMP5 neurons in sulcal Layer 2/3 from in situ hybridization colored by pathological group identity compared to years of football play. Dots depict individual samples, line represents general linear model regression, grey shows 95% confidence interval. Statistics performed by general linear regression. h. Representative images of Nissl-stained neurons in superficial cortical layer 2/3, scale bar indicates 50μm. i. Scatter plot showing Nissl-stained neuronal densities across football exposure groups. Dots depict individual samples, line represents general linear model regression, grey shows 95% confidence interval.
Figure 5.
Figure 5.. Ligand-receptor pair analysis in RHI exposure and CTE.
a. Circos plots from multinichenet analysis depicting microglia as sender cells. RHI indicating RHI vs. Control contrast, CTE indicating CTE vs. RHI contrast. b. RNAScope in situ hybridization depicting a TGFB1+ (yellow) microglia (P2RY12+, orange, solid arrows) contacting a TGFBR2+/ITGAV+ (green, light blue) vessel (GLUT1, red, open arrows). Scale bars, 10μm. c, d. Scatter plots showing TGFB1+ microglia and ITGAV+/TGFBR2+ vessels in the grey matter sulcus compared to years of football play, color coded by pathological group. Statistical analysis performed by simple linear regression. e. Bar plot representing TGFBR2+/ITGAV+ vessels compared to CTE status, statistical analysis performed using a two-tailed t-test. f. Bar plot representing the proportion of TGFB1+ microglia within 25μm of a TGFBR2+/ITGAV+ vessel compared to CTE status, statistical analysis performed using a two-tailed t-test. g. Scatter plots depicting ITGAV+/TGFBR2+ vessels in the grey matter sulcus compared to the fraction of CUX2+/LAMP5+ neurons color coded by pathological group. Statistical analysis performed by simple linear regression.

References

    1. Nowinski C. J. et al. Applying the Bradford Hill Criteria for Causation to Repetitive Head Impacts and Chronic Traumatic Encephalopathy. Frontiers in Neurology 13, (2022). - PMC - PubMed
    1. McKee A. C. et al. Neuropathologic and Clinical Findings in Young Contact Sport Athletes Exposed to Repetitive Head Impacts. JAMA Neurology (2023) doi:10.1001/jamaneurol.2023.2907. - DOI - PMC - PubMed
    1. Mez J. et al. Duration of American Football Play and Chronic Traumatic Encephalopathy. Annals of Neurology 87, 116–131 (2020). - PMC - PubMed
    1. Daneshvar D. H. et al. Leveraging football accelerometer data to quantify associations between repetitive head impacts and chronic traumatic encephalopathy in males. Nat Commun 14, 3470 (2023). - PMC - PubMed
    1. Cherry J. D. et al. Microglial neuroinflammation contributes to tau accumulation in chronic traumatic encephalopathy. Acta neuropathologica communications 4, 112 (2016). - PMC - PubMed

Publication types