[Preprint]. 2025 May 9:2024.03.28.587261.
doi: 10.1101/2024.03.28.587261.

Identification of non-canonical peptides with moPepGen

Affiliations

Identification of non-canonical peptides with moPepGen

Chenghao Zhu et al. bioRxiv. .

Update in

  • Identification of non-canonical peptides with moPepGen.
    Zhu C, Liu LY, Ha A, Yamaguchi TN, Zhu H, Hugh-White R, Livingstone J, Patel Y, Kislinger T, Boutros PC. Zhu C, et al. Nat Biotechnol. 2025 Jun 16. doi: 10.1038/s41587-025-02701-0. Online ahead of print. Nat Biotechnol. 2025. PMID: 40523945

Abstract

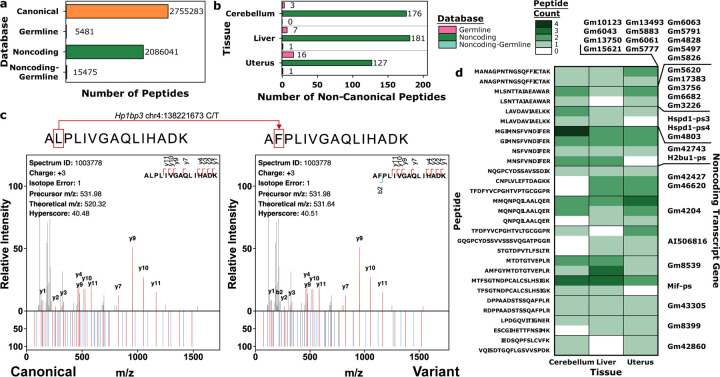
Proteogenomics is limited by challenges of modeling the complexities of gene expression. We create moPepGen, a graph-based algorithm that comprehensively generates non-canonical peptides in linear time. moPepGen works with multiple technologies, in multiple species and on all types of genetic and transcriptomic data. In human cancer proteomes, it enumerates previously unobservable noncanonical peptides arising from germline and somatic genomic variants, noncoding open reading frames, RNA fusions and RNA circularization.


Conflict of interest statement

Conflicts of Interest PCB sits on the Scientific Advisory Boards of Intersect Diagnostics Inc., and previously sat on those of Sage Bionetworks and BioSymetrics Inc. All other authors declare no conflicts of interest.

Figures

Extended Data Figure 1:
Extended Data Figure 1:. Core graph algorithm of moPepGen
The graph algorithm of moPepGen implements the following key steps: a) A transcript variant graph (TVG) is generated from the transcript sequence with all associated variants. All three reading frames are explicitly generated to efficiently handle frameshift variants. b) Variant bubbles of the TVG are aligned and expanded to ensure the sequence length of each node is a multiple of three. c) Peptide variant graph (PVG) is generated by translating the sequence of each node of the TVG. d) Peptide cleavage graph is generated from the PVG in such a way that each node is an enzymatically cleaved peptide.
Extended Data Figure 2:
Extended Data Figure 2:. Differential handling of noncoding transcripts, subgraphs and circular RNAs
a) For coding transcripts, variants are only incorporated into the effective reading frames. For transcripts that are canonically annotated as noncoding, variants are added to all three reading frames to perform comprehensive three-frame translation. b) Subgraphs are created for variant types that involve the insertion of large segments of the genome, which can carry additional variants. c) The graph of a circular RNA is extended four times to capture all possible peptides that span the back-splicing junction site in all three reading frames. In the bottom panel, the nodes in magenta harbour the variant 130-A/T and the nodes in yellow harbour 165-A/AC. d) Illustration of a circRNA molecule with a novel open reading frame. Each translation across the back-splicing site may shift the reading frame. If no stop codon is encountered, the original reading frame is restored after the fourth crossing.
Extended Data Figure 3:
Extended Data Figure 3:. moPepGen demonstrates comprehensive results and deliberate biological assumptions
a) and b) Non-canonical peptide generation results from benchmarking of moPepGen, pyQUILTS and customProDBJ using only point mutations (SNVs) and small insertions and deletions (indels; a), and with inputs from point mutations, indels, RNA editing, transcript fusion, alternative splicing and circular RNAs (circRNAs). b). Top boxplot shows the number of peptides in each set intersection and right barplot shows the total number of non-canonical peptides generated by each algorithm in five primary prostate tumour samples (n = 5). c) Assumptions made by moPepGen for handling edge cases that differ from other algorithms. Start-codon-altering and splice-site-altering variants are omitted due to the uncertainty of the resulting translation and splicing outcomes. Transcripts with unknown stop codons do not have trailing peptide outputs because of the uncertainty of the trailing enzymatic cleavage site. Stop-codon-altering variants do not result in translation beyond the transcript end, adhering to central dogma. UTR: untranslated region. d) Non-canonical database search results from benchmarking of moPepGen, pyQUILTS and customProDBJ using point mutations, indels, RNA editing, transcript fusion, alternative splicing and circRNAs (n = 5). All boxplots show the first quartile, median, to the third quartile, with whiskers extending to furthest points within 1.5× the interquartile range.
Extended Data Figure 4:
Extended Data Figure 4:. Detection of novel open reading frame peptides across proteases
a) Peptide length distributions after in silico digestion with seven enzymes, as indicated by color, of the canonical human proteome and three-frame translated noncoding transcript open reading frames (ORFs). The dotted lines indicate the 7–35 amino acids peptide length range commonly used for database search. b) Noncoding peptide detection across ten enzyme-fragmentation methods in one deeply fractionated human tonsil sample. The top barplot shows the number of peptides in each set intersection and the right barplot shows the total number of non-canonical peptides from noncoding ORFs detected in each enzyme-fragmentation method, as indicated by covariate color. c) Optimal combinations of one to ten enzyme-fragmentation methods for maximizing the number of transcripts detected from the canonical proteome, or the number of ORFs detected from noncoding transcripts. The bottom covariate indicates the optimal combinations of enzyme-fragmentation methods from combinations of one to ten, with color indicating enzyme-fragmentation method. d) Noncoding transcript ORFs with peptides detected across four or more enzyme-fragmentation methods, with recurrence count shown in the right barplot. The color of the heatmap indicates the number of peptides detected per ORF per enzyme-fragmentation method. e) Example ORFs with coverage by multiple proteases are shown, with peptides tiled according to detection in each enzyme-fragmentation method, as indicated by covariate color. Representative fragment ion mass spectra of peptide-spectrum matches are shown, with theoretical spectra at the bottom and fragment ion matches colored (blue: b-ions, red: y-ions in). HCD: higher-energy collisional dissociation; CID: collision-induced dissociation; ETD: electron-transfer dissociation; m/z: mass-to-charge ratio.
Extended Data Figure 5:
Extended Data Figure 5:. Germline non-canonical peptide detection in mouse strain C57BL/6N
a) Comparison of canonical and custom database sizes for the C57NL/6N mouse. Germline database includes single nucleotide polymorphisms (SNPs) and small insertions and deletions. b) Number of non-canonical peptides detected from each database in each tissue (one sample per tissue), with database indicated by color. c) Comparison of a variant peptide-spectrum match (PSM) spectra (top, both) with the theoretical spectra of the canonical peptide counterpart (left, bottom) as well as the theoretical spectra of the variant peptide harbouring a SNP (right, bottom). Fragment ion matches are colored, with b-ions in blue and y-ions in red. m/z: mass-to-charge ratio. d) Noncoding transcripts with open reading frames yielding two or more non-canonical peptides recurrently detected across tissues, with color indicating the number of peptides detected in each tissue.
Extended Data Figure 6:
Extended Data Figure 6:. Proteogenomic investigation of the Cancer Cell Line Encyclopedia
a) Number of non-canonical peptides generated per cell line, with color indicating peptide source. Bottom covariate indicates tissue of origin. b) and c) Number of variant peptides per cell line (n = 376) grouped by variant count in coding (b) and noncoding (c) transcripts. Lines indicate group median. d) Number of non-canonical peptides detected per cell line, colored by peptide source. Bottom covariate indicates tissue of origin. e) Per cell line, number of intragenic coding mutations (by VEP), mutations predicted to produce detectable non-canonical peptides and mutations detected through proteomics. f) Per cell line, number of transcript fusions, those predicted to produce detectable non-canonical peptides and fusions with detected peptide products. Color indicates tissue of origin. g) Fusion transcripts (upstream-downstream gene symbol) with detected peptides, with number of peptides shown across cell lines. Bar color indicates whether the upstream fusion transcript was coding or noncoding. Right covariate indicates tissue of origin. h) Fragment ion mass spectrum from peptide-spectrum match (PSM) of the non-canonical peptide at the junction of the FLNB-SLMAP fusion transcript. The peptide theoretical spectrum is shown at the bottom and fragment ion matches are colored (blue: b-ions, red: y-ions). i) Comparison of mass spectrum (top, both) from PSM of a non-canonical peptide with a single nucleotide variant against Prosit-predicted MS2 mass spectra based on the canonical counterpart peptide sequence (left, bottom) and the detected variant peptide sequence (right, bottom). Fragment ion matches are colored, with b-ions in blue and y-ions in red. j) Cross-correlation (Xcorr) distribution of coding variant peptides PSMs against Prosit-predicted fragment mass spectra (solid lines, color indicate charge), in comparison with Xcorr of control canonical PSMs against Prosit-predicted mass spectra (dotted lines). m/z: mass-to-charge ratio.
Extended Data Figure 7:
Extended Data Figure 7:. Functional investigation of non-canonical peptide detection in Cancer Cell Line Encyclopedia
a) Gene dependency CERES scores for genes with detected non-canonical peptides (orange), detected canonical peptides only (pink) and no detected peptides (gray). A lower CERES score indicates higher gene dependency. Cell lines were selected based on the detection of non-canonical peptides in more than 10 genes. P-values were calculated using a two-sided Mann-Whitney U-test. The red vertical line indicates α = 0.05. The bottom panel represents data pooled across all genes and cell lines. The number of genes per group per cell line and Mann-Whitney U-test results are provided in Supplementary Table 9. b) Gene dependency CERES score and c) mRNA abundance of KRAS in cell lines with only canonical peptides detected compared to those with detected non-canonical peptides (n = 290 and 12, respectively). P-values were calculated using a two-sided Mann-Whitney U-test. TPM: Transcript per million. d) Number of putative neoantigens predicted based on detected non-canonical peptides in cell lines with more than two neoantigens. The color indicates cell line tissue of origin. e) Recurrent neoantigens observed across multiple cell lines, along with their associated gene, variant, HLA genotype and the full peptide sequence as detected by trypsin-digested whole cell lysate mass spectrometry. The color in the left heatmap represents neoantigen binding affinity. Right covariate indicates tissue of origin. All boxplots show the first quartile, median, to the third quartile, with whiskers extending to furthest points within 1.5× the interquartile range.
Extended Data Figure 8:
Extended Data Figure 8:. Detection of non-canonical peptides from DIA proteomics
a) Number of variant peptides from different variant combinations generated using genomic and transcriptomic data from eight clear cell renal cell carcinoma (ccRCC) tumours (n = 8), grouped by the number of variant sources in combination. gVariant: germline single nucleotide polymorphism and insertion/deletions (indels); sVariant: somatic single nucleotide variant and indels; AltSplice: alternative splicing. b) Number of detected variant peptides in the data-independent acquisition (DIA) proteome of eight ccRCC tumours. c-e) Detection of non-canonical peptides harbouring germline single nucleotide polymorphisms (c), alternative splicing (d) and RNA editing sites (e) across genes. Heatmap colors indicate the number of peptides detected per gene per sample. The barplot indicates recurrence across samples. f) Illustration of non-canonical peptides derived from the canonical sequence FSGSNSGNTATLTISR in gene IGLV3-21 caused by RNA editing events. g-i) Extracted ion chromatograms of the canonical peptide (g) and non-canonical peptides derived from IGLV3-21 caused by RNA editing events: chr22:22713097 G-to-C (h) and chr22:22713111 A-to-G (i). All boxplots show the first quartile, median, to the third quartile, with whiskers extending to furthest points within 1.5× the interquartile range.
Extended Data Figure 9:
Extended Data Figure 9:. Detection of non-canonical peptides from genomic variants, alternative splicing and circular RNAs
a) Number of detected non-canonical peptides in five primary prostate tumour samples per database tier (colored by database). b) Peptides as the result of a combination of two variants, with variant type indicated in left covariate and gene on the right. The heatmap shows presence of peptide across samples. c-f) Non-canonical peptide detection results across genes, with color of heatmap representing the number of peptides detected per gene per sample. The barplot indicates recurrence across samples, and when colored indicates variant type associated with the gene entry. The Variant database includes non-canonical peptides from coding transcripts with single nucleotide polymorphisms (SMPs), single nucleotide variants (SNVs), small insertion and deletion (indels), RNA editing, alternative splicing (Alt Splice) or transcript fusion (c). Noncoding database includes all peptides from noncoding transcript three-frame translation open reading frames (d) and noncoding peptides with any variants are included in the Noncoding Variant database (e). The Circular RNA database includes all peptides representing circular RNA open reading frames (ORFs) with or without other variants (f). The bottom covariate indicates prostate cancer sample. g) Mass spectrum from peptide-spectrum match of a non-canonical peptide spanning the back-splicing junction between exon 29 and exon 24 of MYH10, reflective of circular RNA translation. The peptide theoretical spectrum is shown at the bottom and fragment ion matches are colored (blue: b-ions, red: y-ions in). m/z: mass-to-charge ratio.
Figure 1:
Figure 1:. moPepGen is a graph-based algorithm that uncovers non-canonical peptides with variant combinations
a) moPepGen algorithm schematic. moPepGen is a graph-based algorithm that generates databases of non-canonical peptides that harbour genomic and transcriptomic variants (e.g., single nucleotide variant (SNV), small insertion and deletion (INDEL), RNA editing, alternative splicing, gene fusion and circular RNA (circRNA)) from coding transcripts, as well as from novel open reading frames of noncoding transcripts. b) and c) moPepGen achieves linear runtime complexity when fuzz testing with SNVs only (b) and with SNVs and indels (c), based on 1,000 simulated test cases in each panel. d) A variant peptide from SYNPO2 that harbours a small deletion and an SNV. Fragment ion mass spectrum from peptide-spectrum match (PSM) of the non-canonical peptide harbouring two variants (top, both) is compared against the canonical peptide theoretical spectra (left, theoretical spectra at the bottom) and against the variant peptide theoretical spectra (right, bottom). Fragment ion matches are colored, with b-ions in blue and y-ions in red. e-g) A somatic SNV D1249N in AHNAK was detected in DNA sequencing of a prostate tumour (CPCG0183) at chr11:62530672 (e), in RNA-sequencing (f) and as the non-canonical peptide MDIDAPDVEVQGPNWHLK (g). h-i): Fragment ion mass spectrum from PSM of the canonical peptide MDIDAPDVEVQGPDWHLK (h) and the non-canonical peptide (i). m/z: mass-to-charge ratio.
Figure 2:
Figure 2:. moPepGen generates comprehensive non-canonical databases that support proteogenomic analysis
a) Sizes of variant peptide databases generated by moPepGen using somatic single nucleotide variants, small insertions and deletions and transcript fusions for 376 cell lines from the Cancer Cell Line Encyclopedia project. Color indicates cell line tissue of origin. The number of cell lines per tissue of origin is provided in Supplementary Table 8. b) Genes with variant peptides detected in cell lines across three or more tissues of origin (bottom covariate). The barplot shows number of recurrences across tissues and color of heatmap indicates number of cell lines. c) Number of non-canonical peptides from different variant combinations (bottom heatmap) generated using genomic and transcriptomic data from five primary prostate tumours (n = 5), shown across four tiers of custom databases and grouped by the number of variant sources in combination. Alternative translation (Alt Translation) sources with ⩾ 10 peptides are visualized. gSNP: germline single nucleotide polymorphism; gIndel: germline small insertion and deletion (indel); sSNV: somatic single nucleotide variant; sIndel: somatic indel; circRNA: circular RNA; W>F: tryptophan-to-phenylalanine. d) Five variant peptides detected in one prostate tumour (CPCG0183) from the protein plectin (PLEC). Fragment ion matches are colored, with b-ions in blue and y-ions in red. m/z: mass-to-charge ratio. All boxplots show the first quartile, median, to the third quartile, with whiskers extending to furthest points within 1.5× the interquartile range.

References

    1. Zhang B. et al. Proteogenomic characterization of human colon and rectal cancer. Nature 513, 382–387 (2014). - PMC - PubMed
    1. Sinitcyn P. et al. Global detection of human variants and isoforms by deep proteome sequencing. Nat Biotechnol (2023) doi: 10.1038/S41587-023-01714-X. - DOI - PMC - PubMed
    1. Nilsen T. W. & Graveley B. R. Expansion of the eukaryotic proteome by alternative splicing. Nature 463, 457–463 (2010). - PMC - PubMed
    1. Peng X. et al. A-to-I RNA Editing Contributes to Proteomic Diversity in Cancer. Cancer Cell 33, 817–828.e7 (2018). - PMC - PubMed
    1. Creighton C. J. Clinical proteomics towards multiomics in cancer. Mass Spectrom Rev (2022) doi: 10.1002/MAS.21827. - DOI - PubMed

Online Methods References

    1. Zhu C., Liu L. Y., Kislinger T. & Boutros P. C. call-NonCanonicalPeptide: nextflow pipeline to generate custom databases of non-canonical peptides for proteogenomic analysis, Source code. https://github.com/uclahs-cds/pipeline-call-NonCanonicalPeptide (2025).
    1. Di Tommaso P. et al. Nextflow enables reproducible computational workflows. Nat Biotechnol 35, 316–319 (2017). - PubMed
    1. Patel Y. et al. NFTest: automated testing of Nextflow pipelines. Bioinformatics 40, (2024). - PMC - PubMed
    1. Patel Y. et al. Metapipeline-DNA: A Comprehensive Germline & Somatic Genomics Nextflow Pipeline. bioRxiv 2024.09.04.611267 (2024) doi: 10.1101/2024.09.04.611267. - DOI
    1. Nusinow D. P. et al. Quantitative Proteomics of the Cancer Cell Line Encyclopedia. Cell 180, 387–402.e16 (2020). - PMC - PubMed

Publication types