[Preprint]. 2024 Mar 27:rs.3.rs-4095949.
doi: 10.21203/rs.3.rs-4095949/v1.

Plexin D1 emerges as a novel target in the development of neural lineage plasticity in treatment-resistant prostate cancer

Affiliations

Plexin D1 emerges as a novel target in the development of neural lineage plasticity in treatment-resistant prostate cancer

Chengfei Liu et al. Res Sq. .

Update in

Abstract

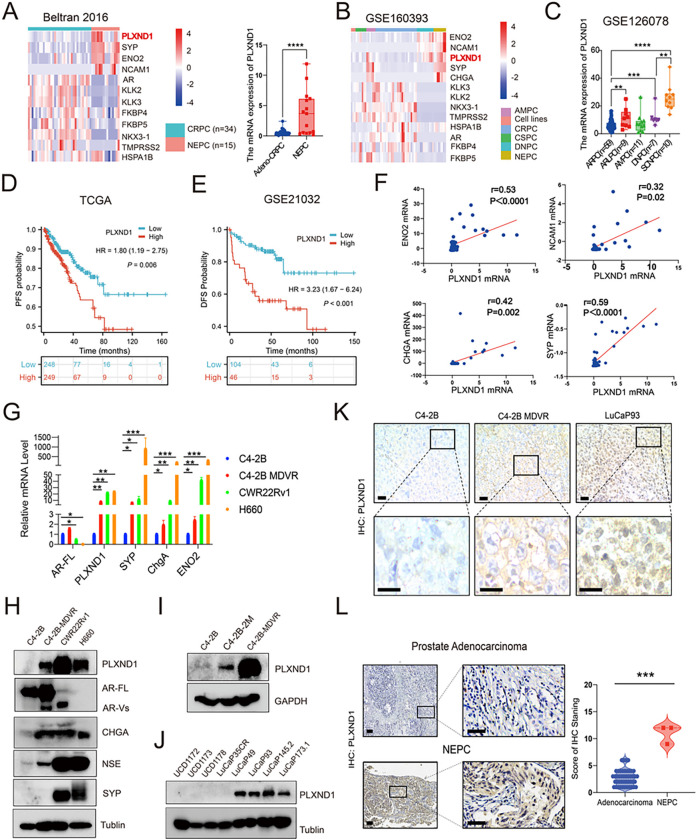
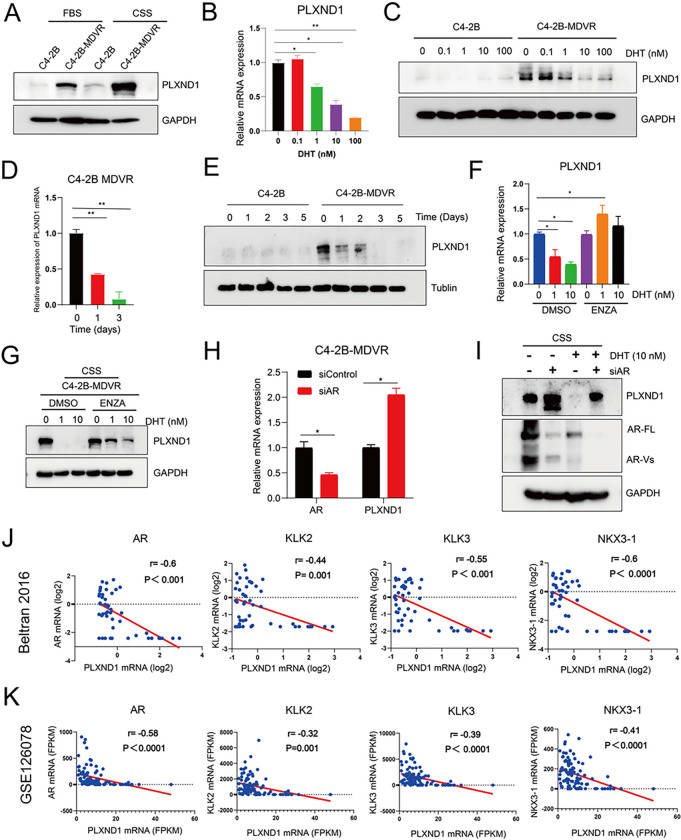
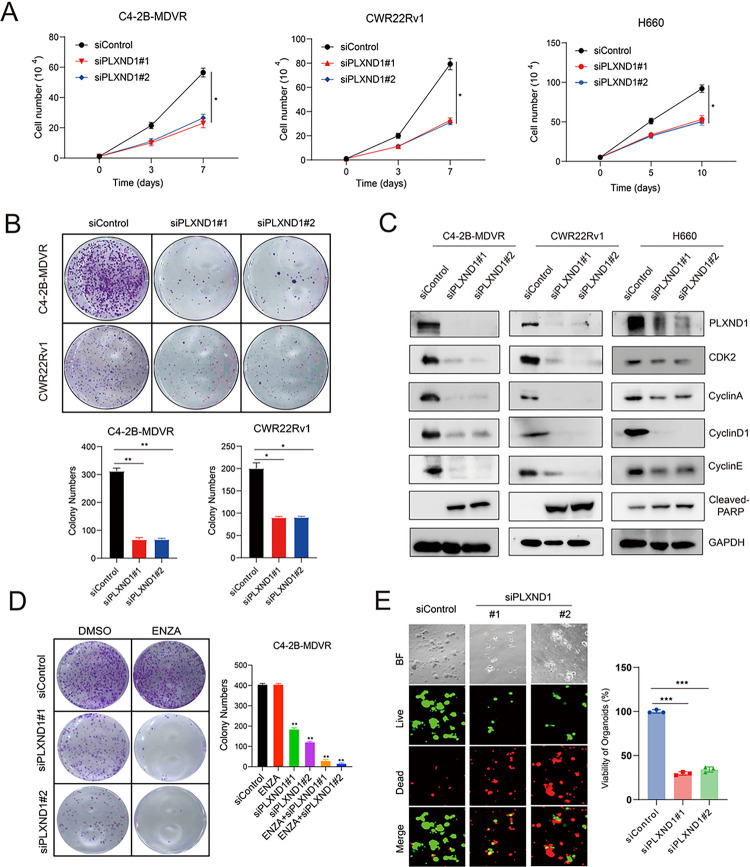
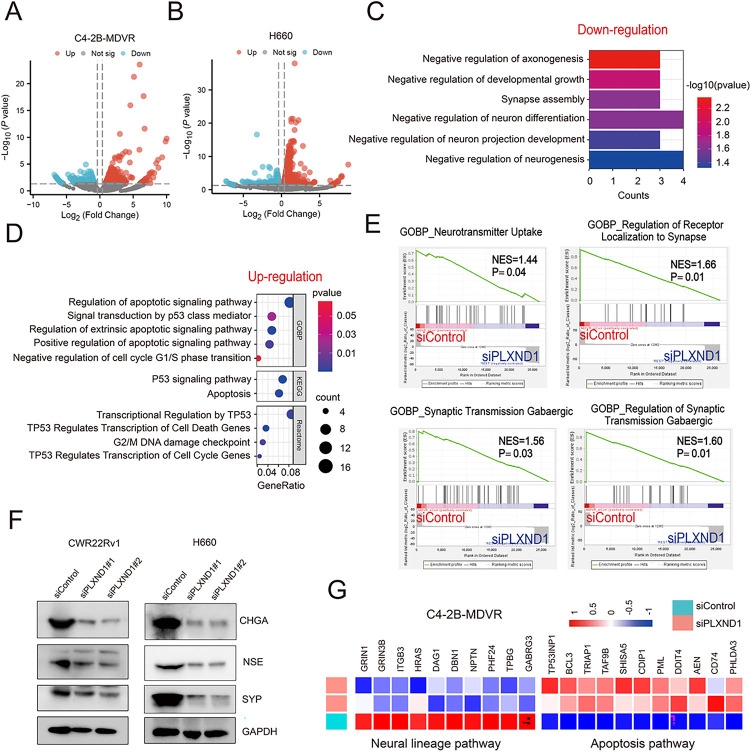
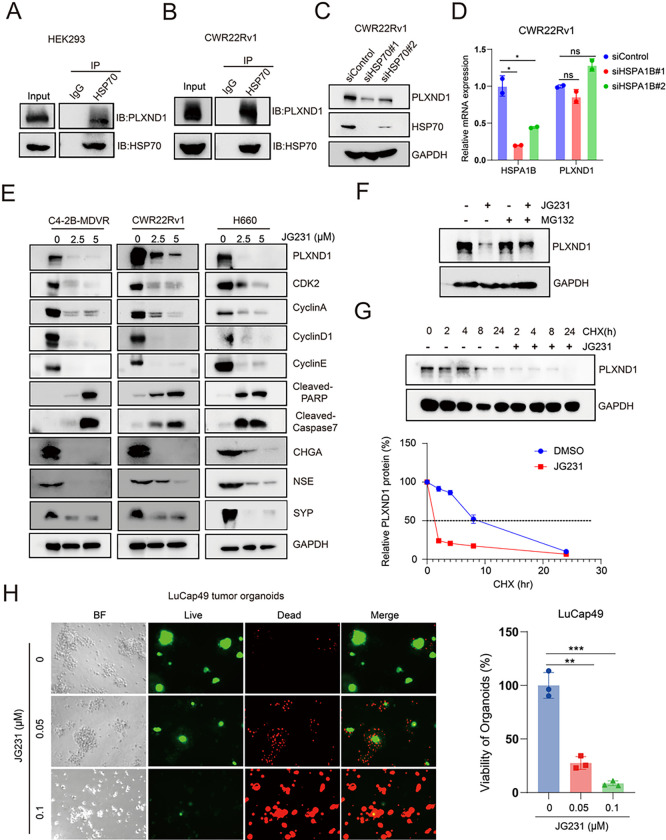
Treatment-induced neuroendocrine prostate cancer (t-NEPC) often arises from adenocarcinoma via lineage plasticity in response to androgen receptor signaling inhibitors, such as enzalutamide. However, the specific regulators and targets involved in the transition to NEPC are not well understood. Plexin D1 (PLXND1) is a cellular receptor of the semaphorin (SEMA) family that plays important roles in modulating the cytoskeleton and cell adhesion. Here, we found that PLXND1 is highly expressed and positively correlated with neuroendocrine markers in patients with NEPC. High PLXND1 expression is associated with poorer prognosis in prostate cancer patients. Additionally, PLXND1 was upregulated and negatively regulated by androgen receptor signaling in enzalutamide-resistant cells. Knockdown or knockout of PLXND1 inhibit neural lineage pathways, suppressing NEPC cell proliferation, PDX tumor organoid viability, and xenograft tumor growth. Mechanistically, the chaperone protein HSP70 regulates PLXND1 protein stability through degradation, and inhibition of HSP70 decreases PLXND1 expression and NEPC organoid growth. In summary, our findings suggest that PLXND1 could be a new therapeutic target and molecular indicator for NEPC.

Keywords: PlexinD1; Prostate cancer; enzalutamide resistance; neural lineage plasticity.


Figures

Figure 1
Figure 1. PLXND1 is upregulated in NEPC and prostate cancer cells showing neural lineage plasticity.
A-B.Heatmap to show the expression levels of PLXND1 and other genes in cell lines, CRPC, CSPC, DNPC, AMPC, and NEPC from the Beltran 2016 and GSE160393 datasets respectively. C. Comparisons of PLXND1 mRNA levels in ARPC, ARLPC, AMPC, DNPC, and SCNPC. D-E. Kaplan Meier curve to show the correlation between PLXND1 expression levels and patients’ prognosis form the TCGA and GSE21032 datasets respectively. F. Pearson correlation analysis of PLXND1 versus ENO2, NCAM1, CHGA, and SYP mRNA in Beltran 2016 cohort from cBioPortal database. G. mRNA expression of AR-FL, PLXND1, SYP, ChgA, and ENO2 in C4–2B, C4–2B-MDVR, CWR22Rv1, and H660 cells. H.Western blot of PLXND1 and other indicated proteins in C4–2B, C4–2B-MDVR, CWR22Rv1, and H660 cells. I. Western blot of PLXND1 proteins in C4–2B, C4–2B-ENZA 2 months, and C4–2B-MDVR cells. J. Western blot of PLXND1 proteins in CRPC PDX tumors (UCD1172, UCD1173, UCD1178 and LuCaP35CR) and NEPC PDX tumors (LuCaP49, LuCaP93, LuCaP145.2 and LuCaP173.1). K. Representative PLXND1 IHC staining in prostate tumors (C4–2B, C4–2B-MDVR, and LuCaP93). Scale bar represents 20 microns (upper) and 10 microns (lower), respectively. L. Representative PLXND1 IHC staining and quantification in patients’ samples (prostate adenocarcinoma versus NEPC). Scale bar represents 100 microns (left) and 50 microns (right), respectively. **P < 0.01, ***P < 0.001, ****P < 0.0001.
Figure 2
Figure 2. AR signaling negatively regulates the expression of PLXND1 in enzalutamide-resistant prostate cancer.
A. Western blot showing PLXND1 in parental C4–2B and C4–2B-MDVR cells cultured in FBS or CSS media for 5 days respectively. B. RT-PCR was used to test the mRNA levels of PLXND1 in C4–2B and C4–2B-MDVR cells treated with different doses of DHT (0, 0.1, 1, 10, and 100 nM) for 3 days in CSS media. C. Western blot was used to test the protein levels of PLXND1 in C4–2B and C4–2B-MDVR cells treated with different doses of DHT (0, 0.1, 1, 10, and 100 nM) for 3 days in CSS media. D.RT-PCR was used to test the mRNA levels of PLXND1 in C4–2B-MDVR cells treated with 10 nM DHT for different timepoints (0, 1, and 3 days) in CSS media. E. Western blot was used to test the protein levels of PLXND1 in C4–2B-MDVR cells treated with 10 nM DHT for different timepoints (0, 1, 2, 3, and 5 days) in CSS media. F-G. C4–2B-MDVR cells were treated with DHT (0, 1, and 10 nM) in the absence or presence of enzalutamide (20 μM) for 3 days. RT-PCR was used to test the mRNA levels of PLXND1, and Western blot was used to test the protein levels of PLXND1, respectively. H. C4–2B-MDVR cells were transfected with siControl and siAR siRNAs for 3 days in CSS media. Then, the mRNA expression levels of AR and PLXND1 were determined by RT-PCR. I. Total lysates from C4–2B-MDVR cells transfected with or without siAR for 3 days and treated with or without 10 nM DHT for 2 days in CSS media were tested for AR-FL and PLXND1 expression by Western blot. J-K.Pearson correlation analysis of PLXND1 versus AR, KLK2, KLK3, and NKX3–1 mRNA in Beltran 2016 cohort and GSE126078 from dataset, respectively. * p<0.05, **P < 0.01.
Figure 3
Figure 3. Knockdown of PLXND1 represses the cell proliferation and improves enzalutamide treatment.
A. C4–2B-MDVR (1*10^4 cells/well), CWR22Rv1 (1*10^4 cells/well), and H660 (5*10^4 cells/well) cells were plated in 12-well plates and transfected with siControl or siPLXND1 siRNAs, respectively. Cell proliferation viability was determined by cell counting. B. C4–2B-MDVR and CWR22Rv1 cells were plated in 6-well plates, 1000 cells/well, and colony formation viability was determined by counting after transfected with siControl or siPLXND1 siRNAs for 10 days. C.C4–2B-MDVR, CWR22Rv1, and H660 cells after transfected with siControl or siPLXND1 siRNAs for 5 days. Then, whole cell lysates of C4–2B-MDVR, CWR22Rv1, and H660 cells were harvested for testing PLXND1 and other proteins expression levels. D. C4–2B-MDVR cells were plated in 6-well plates, 1000 cells/well, and colony formation was determined by counting after transfected with siControl or siPLXND1 siRNAs with or without 20 μM enzalutamide for 10 days. E. Cells from H660 PDX tumors were plated in 96-well plates, 1*10^4 cells/well, and transfected with siControl or siPLXND1 siRNAs for 10 days. Organoids viability was assayed by CellTiter-Glo Luminescent assay and the live-and-dead cells were visualized by immunofluorescence. * p<0.05, **P<0.01, ***P < 0.001.
Figure 4
Figure 4. Knockdown of PLXND1 decreases the neuroendocrine traits.
A. Volcano plot showing the differentiated expressed genes in C4–2B-MDVR cells with PLXND1 knockdown. B.Volcano plot showing the differentiated expressed genes in H660 cells with PLXND1 knockdown. C. Pathways down-regulated in PLXND1 knockdown C4–2B-MDVR. D. GO analysis showing pathways up-regulated in PLXND1 knockdown C4–2B-MDVR cells . E. Enrichment plots of GSEA analyses for the neural lineage pathways in siPLXND1 group compared with siControl group in C4–2B-MDVR cells. F. Western blot showing CHGA, NSE, and SYP proteins in CWR22Rv1 and H660 cells transfected with siControl or siPLXND1 siRNAs for 5 days. G. Heatmap clustering the down-regulated genes and up-regulated genes in C4–2B-MDVR cells, respectively.
Figure 5
Figure 5. Knockout of PLXND1 by CRISPR/Cas9 inhibits the NEPC cells in vitro,organoids viability, and tumor growth in vivo.
A. Western blot was used to confirm the PLXND1 knockout effect in C4–2B-MDVR, CWR22Rv1, and H660 cells transfected with sgControl or sgPLXND1 plasmids for 5 days, respectively. B. C4–2B-MDVR (1*10^4 cells/well) cells were plated in 12-well plates and transfected with sgControl or sgPLXND1 plasmids for 0, 3, and 7 days, respectively. Cell proliferation was determined by cell counting. C.C4–2B-MDVR cells were plated in 6-well plates, 1000 cells/well, and colony formation was determined by counting after transfected with sgControl or sgPLXND1 plasmids for 10 days, respectively. D. H660 (5*10^4 cells/well) cells were plated in 12-well plates and transfected with sgControl or sgPLXND1 plasmids for 0, 5, and 10 days, respectively. Cell viability was determined by cell counting. E. Cells from LuCaP49 PDX tumors were plated in 96-well plates, 1*10^4 cells/well, and transfected with sgControl or sgPLXND1 plasmids for 10 days. Organoids viability was assayed by CellTiter-Glo Luminescent assay and the live-and-dead cells were visualized by immunofluorescence. F. CWR22Rv1 tumors picture in sgControl, sgPLXND1#1, and sgPLXND1#2 group, respectively. G-H.CWR22Rv1 tumors growth curves and tumors weight in sgControl, sgPLXND1#1, and sgPLXND1#2 group, respectively. I. HE and IHC staining of Ki67 in sgControl and sgPLXND1 group were performed for CWR22Rv1 tumors. Scale bar represents 20 microns. J. Protein levels of PLXND1, NSE, CHGA, SYP, CDK2, CDK4, CyclinA, CyclinD1, and CyclinE in CWR22Rv1 tumors after PLXND1 knockout, using GAPDH as internal control, as determined by Western Blot. **P < 0.01, ***P < 0.001.
Figure 6
Figure 6. HSP70 inhibition affects the protein stability of PLXND1.
A-B. Co-IP assays testing the correlation between PLXND1 and HSP70 in HEK293 and CWR22Rv1 cells, respectively. C. Western blot testing the proteins of PLXND1 and HSP70 in CWR22Rv1 cells transfected with siControl or siHSP70 siRNAs for 5 days. D. RT-PCR testing the mRNA of PLXND1 and HSPA1B in CWR22Rv1 cells transfected with siControl or siHSP70 siRNAs for 5 days. E. Western blot testing the proteins of PLXND1 and other proteins in C4–2B-MDVR, CWR22Rv1, and H660 cells treated with JG231 (0, 2.5, 5μM) for 24 hours. F. CWR22Rv1 cells were treated with or without JG231 (2.5 μM) for 24 hours in the absence or presence of the proteosome inhibitor, MG132 (50 μM) for 8 hours, and the protein expression of PLXND1 were analyzed by western blotting. G.CWR22Rv1 cells were treated with 50 μg/mL cycloheximide in the absence or presence of 5 μM of JG231. Total cell lysates were collected 0, 2, 4, 8, and 24 hours after treatment. The levels of PLXND1 were analyzed by western blotting to calculate the half-life of PLXND1. H. Organoids from LuCaP49 PDX tumors were treated with JG231(0.05 and 0.1 μM) for 9 days. Organoids viability was assayed by CellTiter-Glo Luminescent assay and the live-and-dead cells were visualized by immunofluorescence. (*P < 0.05, **P < 0.01, ***P < 0.001, ns = non-significant.

Similar articles

References

    1. Siegel RL, Miller KD, Fuchs HE, Jemal A. Cancer statistics, 2022. CA Cancer J Clin 2022; 72: 7–33. - PubMed
    1. Saha A, Kolonin MG, DiGiovanni J. Obesity and prostate cancer - microenvironmental roles of adipose tissue. Nat Rev Urol 2023; 20: 579–596. - PubMed
    1. Siegel DA, O’Neil ME, Richards TB, Dowling NF, Weir HK. Prostate Cancer Incidence and Survival, by Stage and Race/Ethnicity - United States, 2001–2017. MMWR Morb Mortal Wkly Rep 2020; 69: 1473–1480. - PMC - PubMed
    1. Aparicio A, Logothetis CJ, Maity SN. Understanding the lethal variant of prostate cancer: power of examining extremes. Cancer Discov 2011; 1: 466–468. - PMC - PubMed
    1. Sternberg CN, Fizazi K, Saad F, Shore ND, De Giorgi U, Penson DF et al. Enzalutamide and Survival in Nonmetastatic, Castration-Resistant Prostate Cancer. N Engl J Med 2020; 382: 2197–2206. - PubMed

Publication types

LinkOut - more resources