[Preprint]. 2024 Mar 29:rs.3.rs-4131724.
doi: 10.21203/rs.3.rs-4131724/v1.

An Optimized Langendorff-free Method for Isolation and Characterization of Primary Adult Cardiomyocytes

Affiliations

An Optimized Langendorff-free Method for Isolation and Characterization of Primary Adult Cardiomyocytes

Azadeh Nikouee et al. Res Sq. .

Update in

Abstract

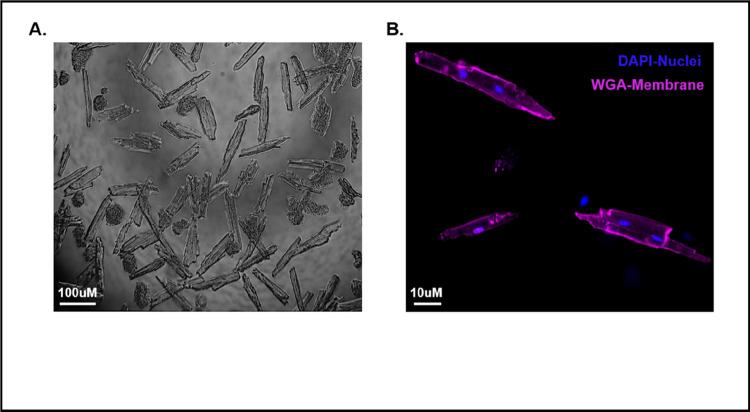
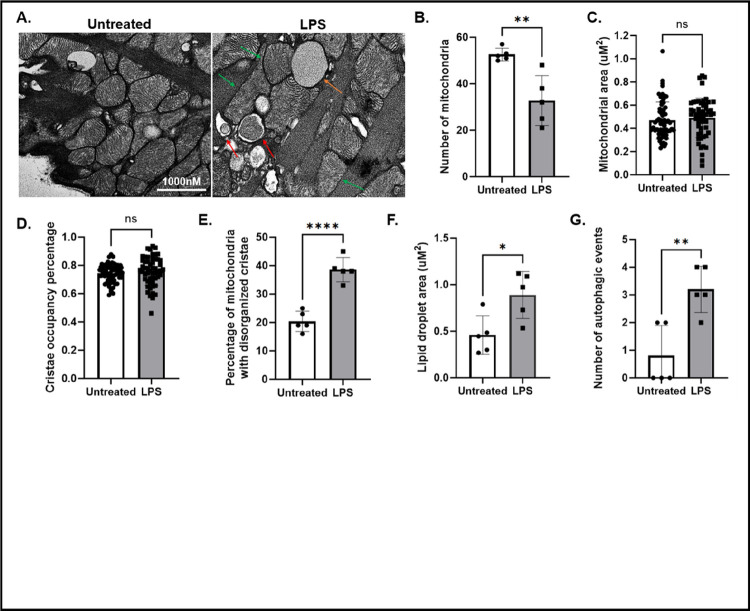
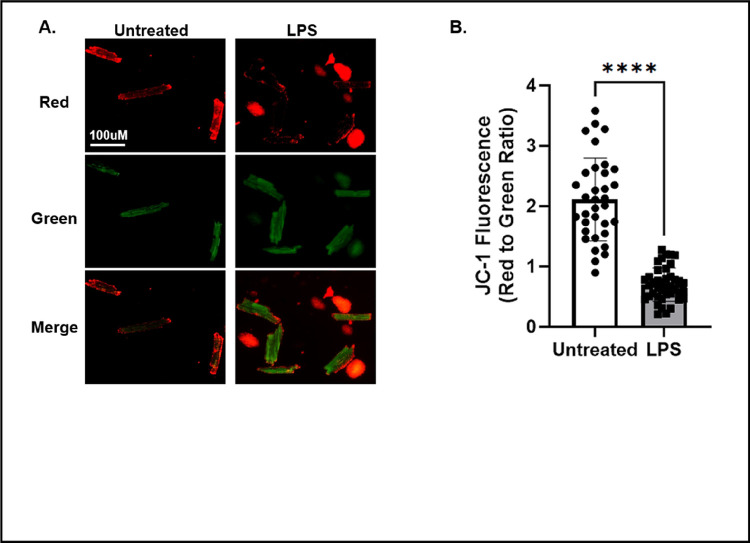
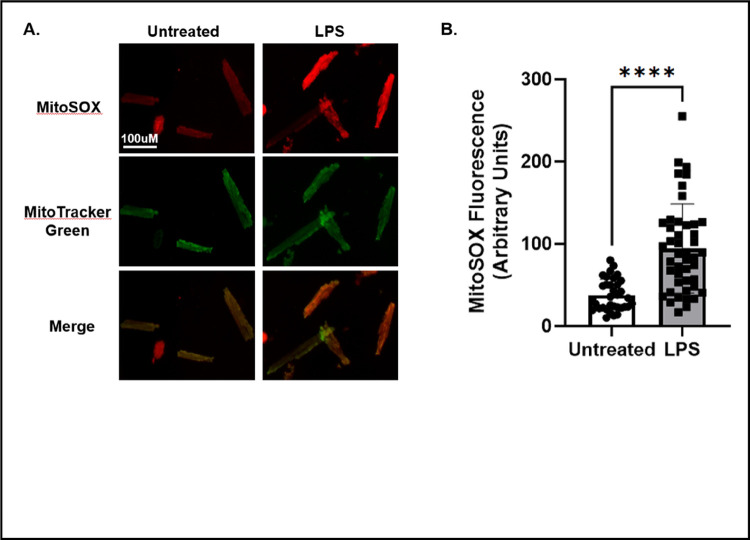
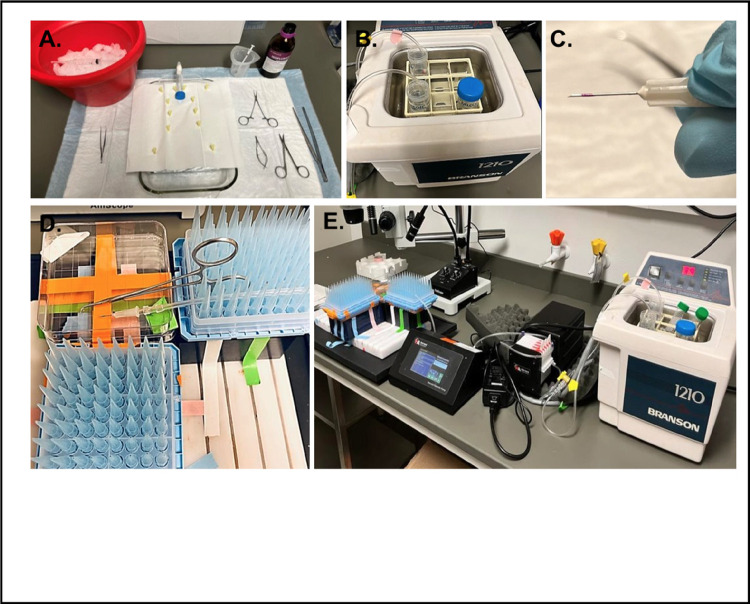
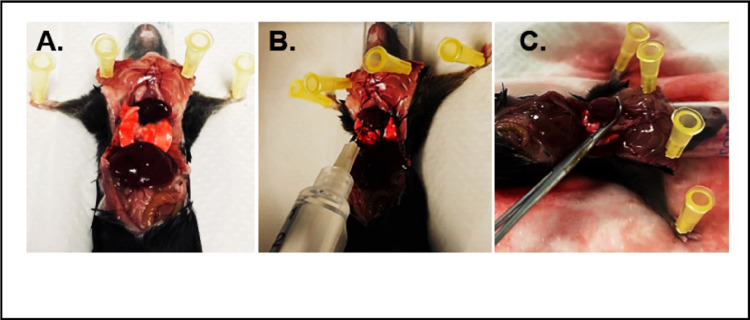
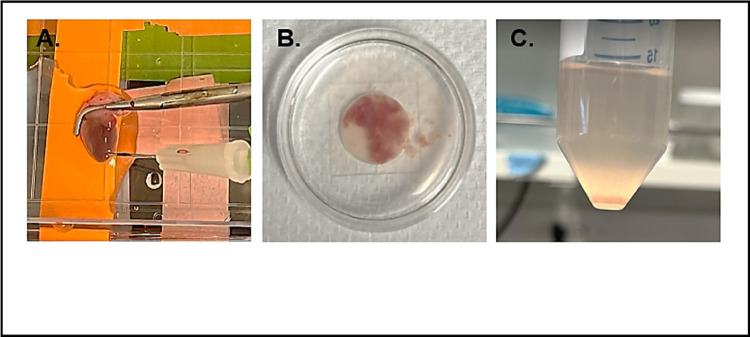
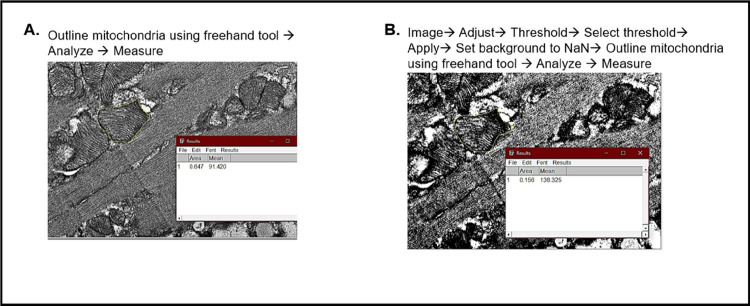
Isolation of adult mouse cardiomyocytes is an essential technique for advancing our understanding of cardiac physiology and pathology, and for developing therapeutic strategies to improve cardiac health. Traditionally, cardiomyocytes are isolated from adult mouse hearts using the Langendorff perfusion method in which the heart is excised, cannulated, and retrogradely perfused through the aorta. While this method is highly effective for isolating cardiomyocytes, it requires specialized equipment and technical expertise. To address the challenges of the Langendorff perfusion method, researchers have developed a Langendorff-free technique for isolating cardiomyocytes. This Langendorff-free technique involves anterograde perfusion through the coronary vasculature by clamping the aorta and intraventricular injection. This method simplifies the experimental setup by eliminating the need for specialized equipment and cannulation of the heart. Here, we introduce an updated Langendorff-free method for isolating adult mice cardiomyocytes that builds on the Langendorff-free protocols developed previously. In this method, the aorta is clamped in situ, and the heart is perfused using a peristaltic pump, water bath, and an injection needle. This simplicity makes cardiomyocyte isolation more accessible for researchers who are new to cardiomyocyte isolation or are working with limited resources. In this report, we provide a step-by-step description of our optimized protocol. In addition, we present example studies of analyzing mitochondrial structural and functional characteristics in isolated cardiomyocytes treated with and without the acute inflammatory stimuli lipopolysaccharide (LPS).


Conflict of interest statement

Declarations Competing interests: The authors declare no conflict of interest.

Figures

Figure 1
Figure 1. Cardiomyocytes post-isolation.
A) Brightfield image of isolated cardiomyocytes after plating. B) Confocal imaging of isolated cardiomyocytes stained with the cell membrane marker wheat germ agglutinin (WGA) (colored purple) and the nuclei marker DAPI (colored blue).
Figure 2
Figure 2. Analysis of mitochondria morphology, lipid droplet accumulation and autophagy in isolated cardiomyocytes using TEM.
Cardiomyocytes were isolated from male adult mice that were treated with or without LPS (5mg/kg) for 18 hours post injection. A) TEM images of cardiomyocytes untreated and treated with LPS. Red arrows show autophagic events, orange arrow shows a lipid droplet, and green arrows show mitochondria with disorganized cristae. Images are prepresentative for n = 2 mice/group. B) Number of mitochondria per 50uM area C) Mitochondrial area per 50uM area. D) Percentage of cristae occupancy relative to total mitochondria area E) Percentage of mitochondria with disorganized cristae relative to the number of mitochondria per 50uM area. F) Lipid droplet area per 50uM area G) number of autophagic events per per 50uM area. In B-G, values were expressed as mean ± SD and analyzed by a one-way t-test. Significance was determined by a p value <.05 and is shown by astericks.
Figure 3
Figure 3. Assessment of mitochondrial membrane potential in isolated cardiomyocytes.
A)confocal imaging of JC-1 in in untreated and LPS treated cardiomyocytes. The scale bar in the upper left panel equals 100 μm and is valid for all panels. Images are representative of 30–50 cardiomyocytes analyzed from n=2 mice/group. B) Quantification of JC-1 fluorescence in untreated and LPS treated cardiomyocytes. Values were expressed as mean ± SD and analyzed by a one-way t-test. Significance was determined by a p value <.05 and is shown by astericks.
Figure 4
Figure 4. Analysis of ROS production in isolated cardiomyocytes.
A)Confocal imaging of MitoSOX Red and MitoTracker Green in untreated and LPS treated cardiomyocytes. The scale bar in the upper left panel equals 100 μm and is valid for all panels. Images are representative of 30–50 cardiomyocytes analyzed from n=2 mice/group. B) Quantification of MitoSOX Red fluorescence in untreated and LPS treated cardiomyocytes. Images are representative of 30–50 cardiomyocytes analyzed from n=2 mice/group. Values were expressed as mean ± SD and analyzed by a one-way t-test. Significance was determined by a p value <.05 and is shown by astericks.
Figure 5
Figure 5. Setup for cardiomyocyte isolation.
A)Surgical tools needed for heart excision, including a surgical table, a 5 ml syringe containing ice-cold EDTA buffer, tweezers, sharp-tipped scissors, Vannas scissors, and curved-ended Reynolds hemostatic forceps. B) EDTA and digestion buffers in a 37°C water bath for preparation. C)Injection needles marked with nail polish to ensure penetration depth of only 3mm into the heart. D) A custom-made holder securely positions the injection needle and tubing. E)An overview of the complete perfusion system.
Figure 6
Figure 6. Animal surgical procedure.
A) Chest cavity opened, exposing the heart; B) Injection of EDTA buffer into the right ventricle; C) Clamping the aorta
Figure 7
Figure 7. Isolation of cardiomyocytes from the excised heart.
A) Excised heart connected to the perfusion system via intraventricular injection. B) Heart tissue disassociation. C)Pellet of healthy cardiomyocytes.
Figure 8
Figure 8. Analysis of mitochondria area and cristae surface area from TEM images.
A) Calculating mitochondria area. B) Calculating area unoccupied by mitochondrial cristae.

References

    1. Zimmer HG. The Isolated Perfused Heart and Its Pioneers. News Physiol Sci. 1998;13:203–10. Epub 2001/06/08. doi: 10.1152/physiologyonline.1998.13.4.203. - DOI - PubMed
    1. Li H, Liu C, Bao M, Liu W, Nie Y, Lian H, Hu S. Optimized Langendorff perfusion system for cardiomyocyte isolation in adult mouse heart. J Cell Mol Med. 2020;24(24):14619–25. Epub 2020/11/05. doi: 10.1111/jcmm.15773. - DOI - PMC - PubMed
    1. Omatsu-Kanbe M, Fukunaga R, Mi X, Matsuura H. An Antegrade Perfusion Method for Cardiomyocyte Isolation from Mice. J Vis Exp. 2021(171). Epub 2021/06/08. doi: 10.3791/61866. - DOI - PubMed
    1. Tian X, Gao M, Li A, Liu B, Jiang W, Qin Y, Gong G. Protocol for Isolation of Viable Adult Rat Cardiomyocytes with High Yield. STAR Protoc. 2020;1(2):100045. Epub 2020/10/29. doi: 10.1016/j.xpro.2020.100045. - DOI - PMC - PubMed
    1. Ackers-Johnson M, Li PY, Holmes AP, O’Brien SM, Pavlovic D, Foo RS. A Simplified, Langendorff-Free Method for Concomitant Isolation of Viable Cardiac Myocytes and Nonmyocytes From the Adult Mouse Heart. Circ Res. 2016;119(8):909–20. Epub 2016/08/10. doi: 10.1161/CIRCRESAHA.116.309202. - DOI - PMC - PubMed

Publication types

LinkOut - more resources