

A computational model of Alzheimer's disease at the nano, micro, and macroscales
- PMID: 38586183
- PMCID: PMC10995318
- DOI: 10.3389/fninf.2024.1348113
A computational model of Alzheimer's disease at the nano, micro, and macroscales
Abstract
Introduction: Mathematical models play a crucial role in investigating complex biological systems, enabling a comprehensive understanding of interactions among various components and facilitating in silico testing of intervention strategies. Alzheimer's disease (AD) is characterized by multifactorial causes and intricate interactions among biological entities, necessitating a personalized approach due to the lack of effective treatments. Therefore, mathematical models offer promise as indispensable tools in combating AD. However, existing models in this emerging field often suffer from limitations such as inadequate validation or a narrow focus on single proteins or pathways.
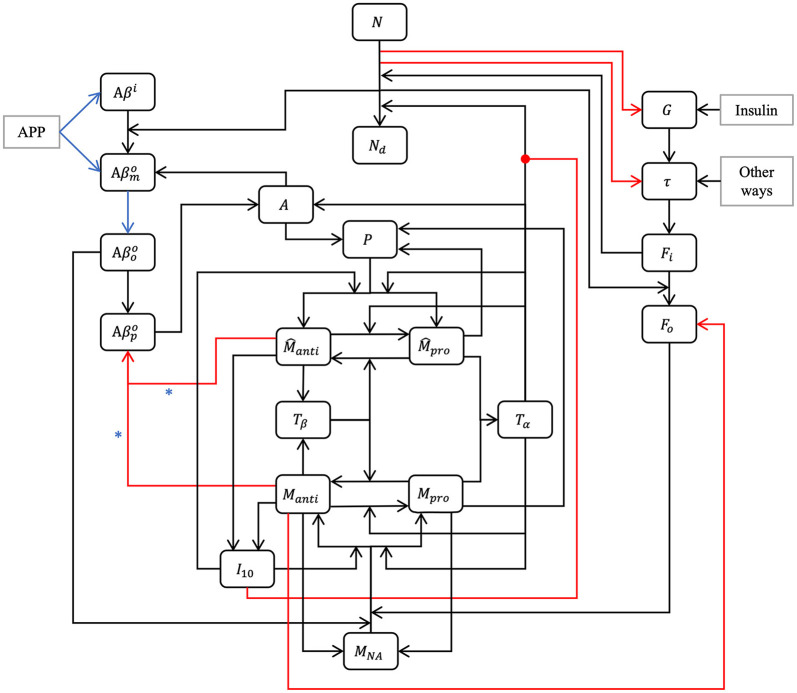
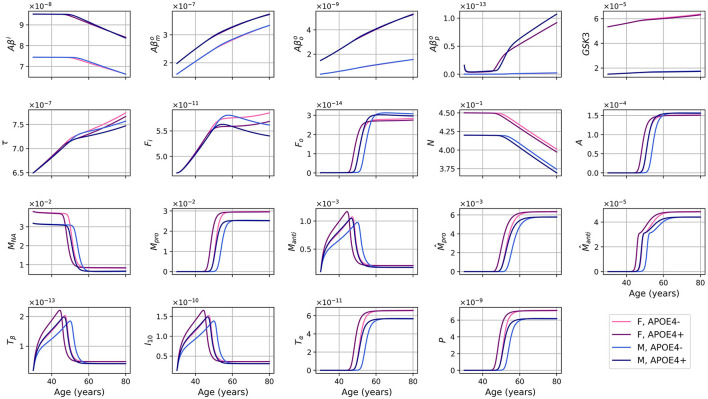
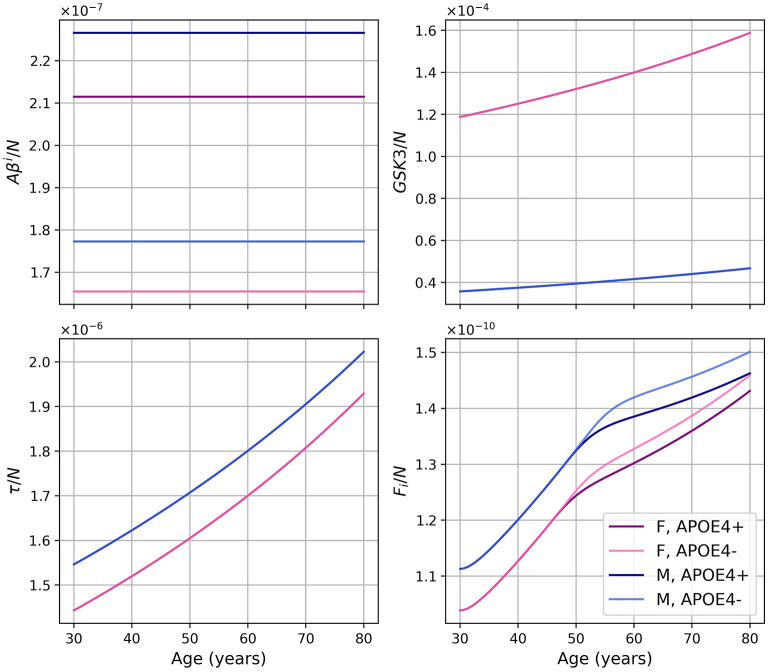
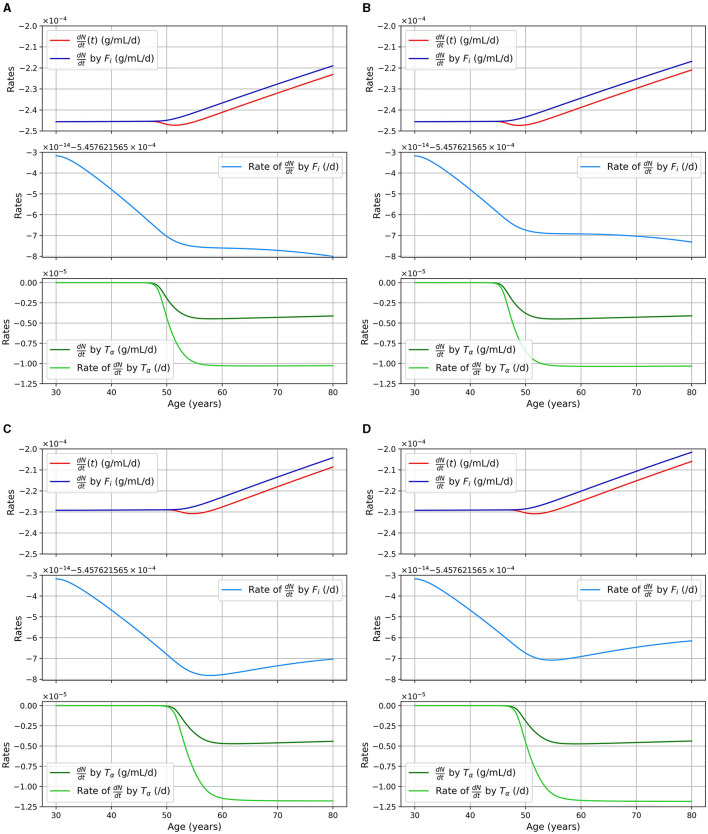
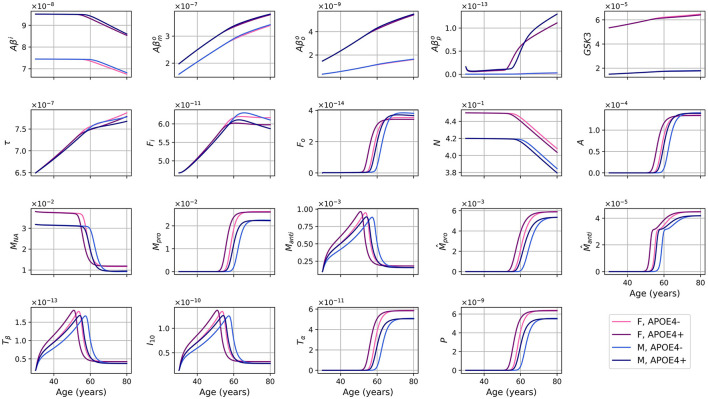
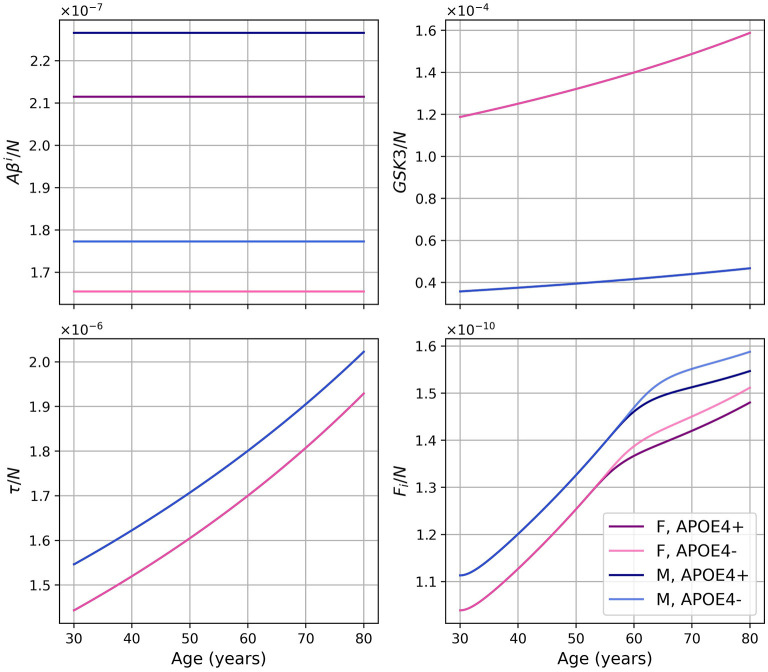
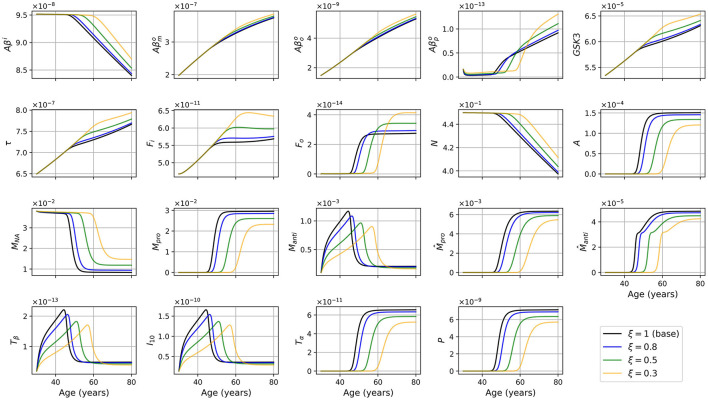
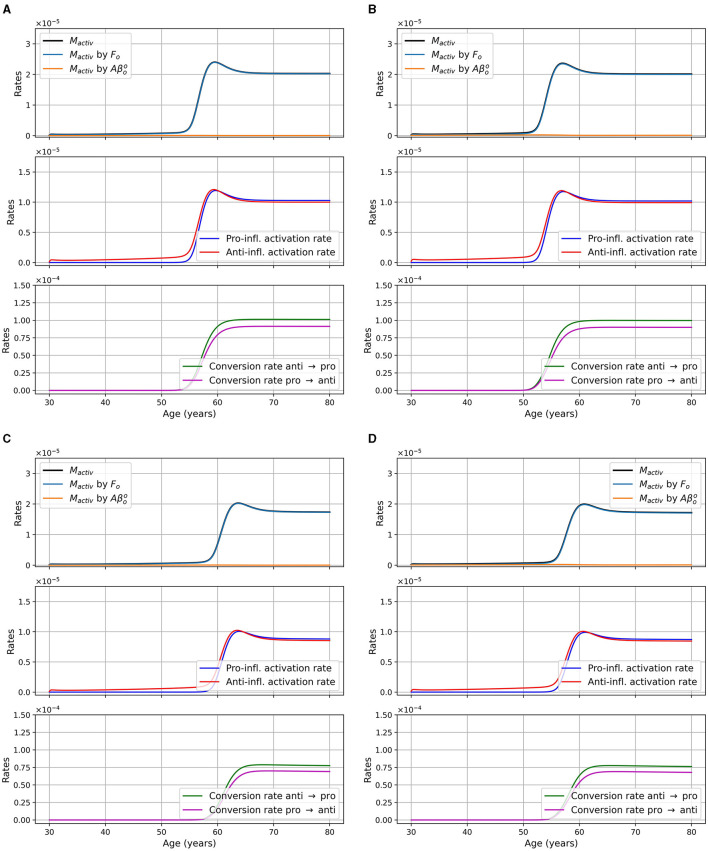
Methods: In this paper, we present a multiscale mathematical model that describes the progression of AD through a system of 19 ordinary differential equations. The equations describe the evolution of proteins (nanoscale), cell populations (microscale), and organ-level structures (macroscale) over a 50-year lifespan, as they relate to amyloid and tau accumulation, inflammation, and neuronal death.
Results: Distinguishing our model is a robust foundation in biological principles, ensuring improved justification for the included equations, and rigorous parameter justification derived from published experimental literature.
Conclusion: This model represents an essential initial step toward constructing a predictive framework, which holds significant potential for identifying effective therapeutic targets in the fight against AD.
Keywords: APOE; Alzheimer's disease; amyloid beta; complex biological systems; mathematical models; ordinary differential equations; personalized approach; tau proteins.
Copyright © 2024 Chamberland, Moravveji, Doyon and Duchesne.
Conflict of interest statement
The authors declare that the research was conducted in the absence of any commercial or financial relationships that could be construed as a potential conflict of interest.
Figures
Similar articles
-
A scoping review of mathematical models covering Alzheimer's disease progression.Front Neuroinform. 2024 Mar 14;18:1281656. doi: 10.3389/fninf.2024.1281656. eCollection 2024. Front Neuroinform. 2024. PMID: 38550514 Free PMC article.
-
Computational Causal Modeling of the Dynamic Biomarker Cascade in Alzheimer's Disease.Comput Math Methods Med. 2019 Feb 3;2019:6216530. doi: 10.1155/2019/6216530. eCollection 2019. Comput Math Methods Med. 2019. PMID: 30863455 Free PMC article.
-
Personalized brain models identify neurotransmitter receptor changes in Alzheimer's disease.Brain. 2022 Jun 3;145(5):1785-1804. doi: 10.1093/brain/awab375. Brain. 2022. PMID: 34605898 Free PMC article.
-
Mathematical Models to Shed Light on Amyloid-Beta and Tau Protein Dependent Pathologies in Alzheimer's Disease.Neuroscience. 2020 Jan 1;424:45-57. doi: 10.1016/j.neuroscience.2019.09.017. Epub 2019 Nov 1. Neuroscience. 2020. PMID: 31682825 Review.
-
Alzheimer's Disease is Driven by Intraneuronally Retained Beta-Amyloid Produced in the AD-Specific, βAPP-Independent Pathway: Current Perspective and Experimental Models for Tomorrow.Ann Integr Mol Med. 2020;2(1):90-114. doi: 10.33597/aimm.02-1007. Ann Integr Mol Med. 2020. PMID: 32617536 Free PMC article.
Cited by
-
Research models to study lewy body dementia.Mol Neurodegener. 2025 Apr 23;20(1):46. doi: 10.1186/s13024-025-00837-w. Mol Neurodegener. 2025. PMID: 40269912 Free PMC article. Review.
-
Challenges and Future Perspectives in Modeling Neurodegenerative Diseases Using Organ-on-a-Chip Technology.Adv Sci (Weinh). 2024 Aug;11(32):e2403892. doi: 10.1002/advs.202403892. Epub 2024 Jun 23. Adv Sci (Weinh). 2024. PMID: 38922799 Free PMC article. Review.
-
Advancing Alzheimer's Therapy: Computational strategies and treatment innovations.IBRO Neurosci Rep. 2025 Feb 4;18:270-282. doi: 10.1016/j.ibneur.2025.02.002. eCollection 2025 Jun. IBRO Neurosci Rep. 2025. PMID: 39995567 Free PMC article. Review.
-
The role of IP3 receptors and SERCA pumps in restoring working memory under amyloid β induced Alzheimer's disease: a modeling study.Front Comput Neurosci. 2025 Jul 22;19:1643547. doi: 10.3389/fncom.2025.1643547. eCollection 2025. Front Comput Neurosci. 2025. PMID: 40765919 Free PMC article.
-
Sensitivity analysis of a mathematical model of Alzheimer's disease progression unveils important causal pathways.Front Neuroinform. 2025 Jul 23;19:1590968. doi: 10.3389/fninf.2025.1590968. eCollection 2025. Front Neuroinform. 2025. PMID: 40771353 Free PMC article.
References
LinkOut - more resources
Full Text Sources
Miscellaneous