. 2024 Apr 8;9(7):e175479.
doi: 10.1172/jci.insight.175479.

Alkali injury-induced pathological lymphangiogenesis in the iris facilitates the infiltration of T cells and ocular inflammation

Affiliations

Alkali injury-induced pathological lymphangiogenesis in the iris facilitates the infiltration of T cells and ocular inflammation

Zheng Liu et al. JCI Insight. .

Abstract

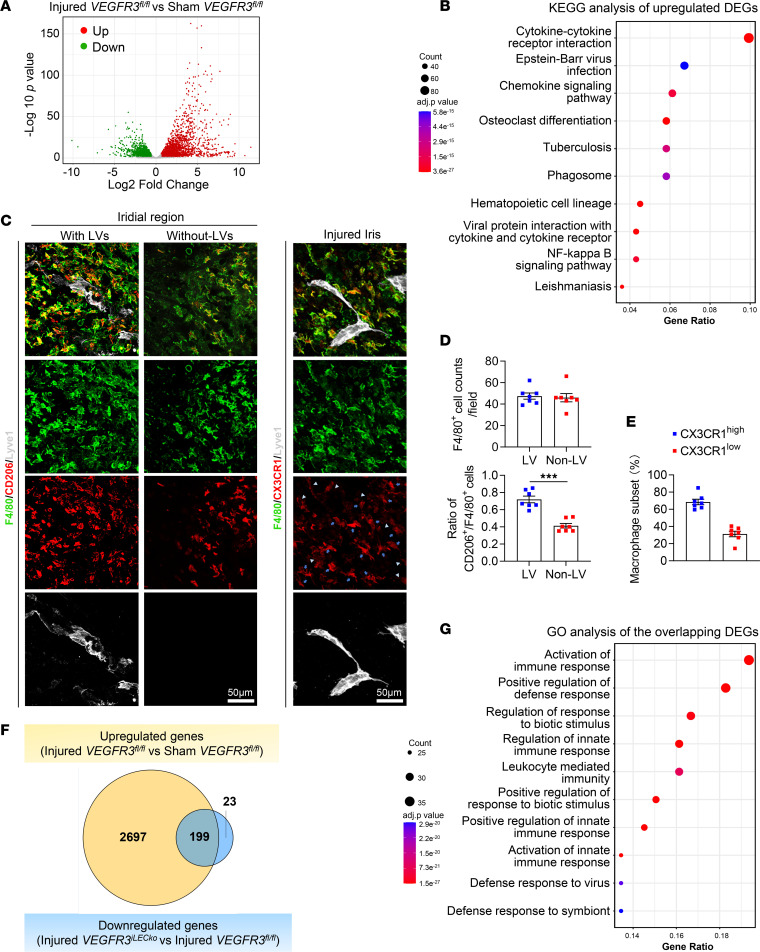
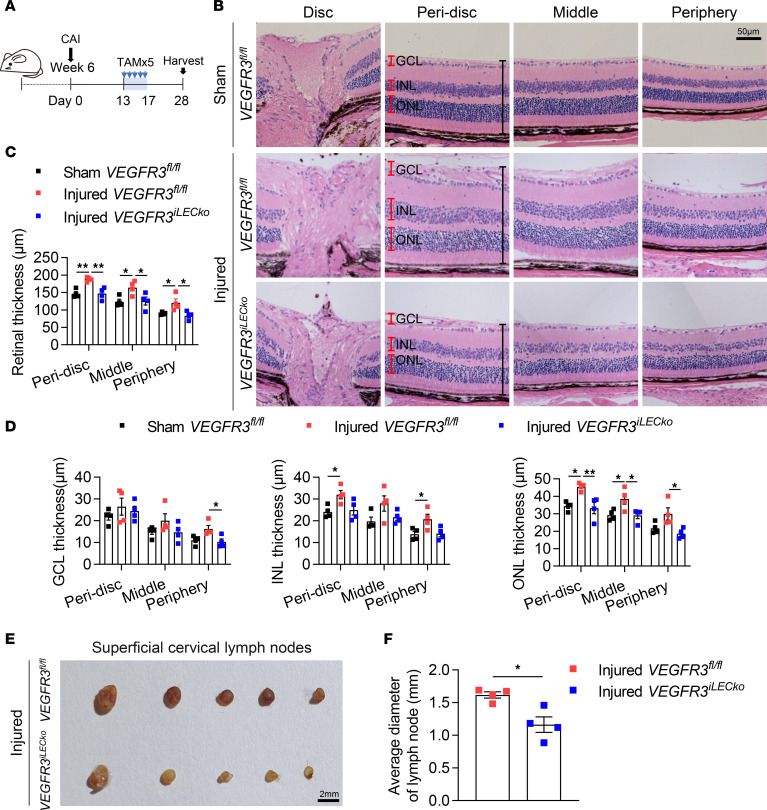
Inflammatory lymphangiogenesis is intimately linked to immune regulation and tissue homeostasis. However, current evidence has suggested that classic lymphatic vessels are physiologically absent in intraocular structures. Here, we show that neolymphatic vessels were induced in the iris after corneal alkali injury (CAI) in a VEGFR3-dependent manner. Cre-loxP-based lineage tracing revealed that these lymphatic endothelial cells (LECs) originate from existing Prox1+ lymphatic vessels. Notably, the ablation of iridial lymphangiogenesis via conditional deletion of VEGFR3 alleviated the ocular inflammatory response and pathological T cell infiltration. Our findings demonstrate that iridial neolymphatics actively participate in pathological immune responses following injury and suggest intraocular lymphangiogenesis as a valuable therapeutic target for the treatment of ocular inflammation.

Keywords: Immunology; Lymph; Ophthalmology; Retinopathy; T cells.


Figures

Figure 1
Figure 1. Corneal alkali injury (CAI) induces iridial lymphangiogenesis.
(A) Schematic showing experimental timeline of CAI and analysis of lymphangiogenesis in the cornea and iris on days 0, 14, 16, 21, and 28. (B) Immunofluorescence staining of LYVE1+ lymphatic vessels in cornea and iris tissue whole mounts from mice at the indicated days after CAI or sham treatment. The CAI or sham treatment was done by placing a 2 mm round filter paper infiltrated with 0.5 μL of 1 M sodium hydroxide solution (CAI) or PBS (sham) on the cornea for 60 seconds. Note that sparse LYVE1+ neolymphatics initially formed in the iris whole mounts on day 16 after CAI and underwent expansion thereafter (see arrows). Scale bar: 1 mm. (C) Quantitation of Lyve1+ lymphatic covered area in the cornea and iris from mice received CAI or sham treatment at the indicated time points following CAI. All data are mean ± SEM. n = 10 mice per group. Each dot represents 1 mouse. *P < 0.05, **P < 0.01, ***P < 0.001. Mann-Whitney U test. (D) Characterization of expression of common lymphatic endothelial cell (LEC) markers (LYVE1, Prox1, VEGFR3, and CD31) in CAI-induced iridial neolymphatics in mice, compared with sham control mice, on day 28 after the treatment. Scale bars: 1 mm and 100 μm. (E) VE-cadherin and Lyve1 staining of the iris tissue whole mounts from mice on day 28 after the CAI or sham treatment. Scale bars: 100 μm and 50 μm.
Figure 2
Figure 2. LECs in CAI-induced neolymphatics have a Prox1+, CDH5+, PDGFRβ, and CX3CR1 lineage.
(A) Schematic showing generation of mice harboring the CAG-tdTomato reporter and CreERT2 transgene and experimental timeline of tamoxifen (TAM) administration and CAI for lineage tracing in the indicated mouse lines in BG. Arrows indicate TAM administered 5 times (80 mg/kg) i.p. injections in week 4, followed by CAI treatment at week 6 and analysis at week 10. (B and D) Representative tdTomato, Prox1, and Lyve1 immunostaining images of the iris whole mounts from Prox1-CreERT2;CAG-tdTomato (B) or CDH5-CreERT2;CAG-tdTomato (D) mice at week 10 that received TAM administered 5 times i.p. in week 4 and CAI treatment at week 6. Note overlapping of tdTomato-labeled area with Prox1/Lyve1-labeled lymphatic areas in both mouse lines with CAI treatment, indicating that LECs in CAI-induced neolymphatics originate from Prox1+ and CDH5+ existing lymphatics. Scale bars: 100 μm. (C and E) Quantification of the ratio of tdTomato-labeled area and Prox1/Lyve1-labeled area in B and D. Data are shown as mean ± SEM. n = 4 mice per group. Each dot represents 1 mouse. (F) Representative immunostaining images of tdTomato and Prox1 of the iris whole mounts from PDGFRB-CreERT2;CAG-tdTomato or CX3CR1-CreERT2;CAG-tdTomato mice at week 10 that received TAM administered 5 times i.p. in week 4 and CAI or sham treatment at week 6. Note that Prox1 staining does not overlap with tdTomato-labeled area in both mouse lines with CAI treatment, indicating that LECs in CAI-induced neolymphatics do not originate from PDGFRβ+ mural cells or CX3CR1+ myeloid cells. Scale bar: 100 μm. (G) Quantification of number of Prox1 and tdTomato double-positive cells in F. Data are shown as mean ± SEM. n = 4 mice per group. Each dot represents 1 mouse. (H) Immunofluorescence staining for Lyve1 in sagittal cryosections of the anterior segment of the eyes from WT mice at week 10 that received CAI or sham treatment at week 6. The dotted line depicts the injured iris. Scale bar: 200 μm. (I) Diagram showing possible route of the induction of the iridial neolymphatics from existing limbal lymphatic vessels (LVs).
Figure 3
Figure 3. CAI-induced iridial lymphangiogenesis depends on VEGFC/VEGFR3 signaling.
(A) Schematic showing generation of mice harboring the VEGFR3fl/fl allele and Prox1-CreERT2 transgene and experimental timeline of TAM administration for conditional deletion of the VEGFR3 gene (referred to as VEGFR3iLECko) and CAI in B and C. Mice received CAI or sham treatment at week 6, followed by TAM administered 5 times (80 mg/kg) i.p. between days 13 and 17 and analysis on day 28 after CAI. (B) CD31 and Lyve1 immunostaining images of the iris whole mounts from VEGFR3iLECko and VEGFR3fl/fl mice that received CAI or sham treatment at week 6, followed by TAM administered 5 times (80 mg/kg) i.p. between days 13 and 17 and analysis on day 28 after CAI. Note ablation of lymphatics in the injured VEGFR3iLECko mouse group. Scale bars: 1,000 μm and 100 μm. (C) Quantification of Lyve1+ lymphatic vessel and CD31+ blood vessel coverage in the iris in mice in B. Data are shown as mean ± SEM. n = 7 mice per group. Each dot represents 1 mouse. ***P < 0.001. One-way ANOVA with the Tukey post hoc test. (D) Experimental timeline of VEGFC-156S administration and CAI in E and F. Mice received CAI or sham treatment at week 6, followed by 150 ng administered 3 times VEGFC-156S or PBS intracameral injections between days 16 and 18 and analysis on day 28 after CAI. (E) Lyve1 immunostaining images of the iris whole mounts from WT mice that received CAI treatment at week 6, followed by 150 ng administered 3 times VEGFC-156S or PBS intracameral injections and analysis on day 28 after CAI. Note that intracameral injections with PBS alone could inhibit CAI-induced iridial lymphangiogenesis, compared with no injection controls, and that VEGFC-156S administration could promote CAI-induced iridial lymphangiogenesis. Scale bar: 1,000 μm. (F) Quantification of Lyve1+ lymphatic vessel coverage, branches, and terminal endpoints in the iris in mice in E. Data are shown as mean ± SEM. n = 4 mice per group. Each dot represents 1 mouse. *P < 0.05. Mann-Whitney U test.
Figure 4
Figure 4. Transcriptomic characterization of CAI-treated iris tissues.
(A) Volcano plot showing CAI-induced 2,896 upregulated differentially expressed genes (DEGs) and 2,332 downregulated DEGs in the iris, as revealed by bulk RNA-Seq analysis of iris tissues dissected from VEGFR3fl/fl mice with CAI or sham treatment. (B) KEGG analysis of upregulated DEGs in A. Dot size and color scale intensities represent counts of DEGs and Padj values of the enriched pathways, respectively. (C) Immunostaining images for F4/80, CD206, and CX3CR1 in the iridial tissue regions with or without lymphatic vessel (LV) coverage in CAI-treated VEGFR3fl/fl mice. Arrows and arrowheads indicate CX3CR1hi and CX3CR1lo macrophages, respectively. Scale bar: 50 μm. (D) Quantification of CD206+ (M2) macrophage counts out of F4/80+ total macrophage counts in C (n = 7). Data are shown as mean ± SEM. n = 7 mice per group. Each dot represents 1 mouse. ***P < 0.001. Mann-Whitney U test. (E) Quantification of CX3CR1hi and CX3CR1lo subsets in F4/80+ total macrophage population in C. Data are shown as mean ± SEM. n = 7 mice per group. Each dot represents 1 mouse. (F) Venn diagram showing intersection between the upregulated DEGs in the injured VEGFR3fl/fl versus Sham VEGFR3fl/fl mouse groups and the downregulated DEGs in the injured VEGFR3iLECko versus injured VEGFR3fl/fl mouse groups. (G) GO analysis of the overlapping 199 DEGs in F. Dot size and color scale intensities represent counts of DEGs and Padj values of the enriched pathways, respectively.
Figure 5
Figure 5. Iridial neolymphatics promote phagocytosis, antigen presentation, and T cell infiltration/activation following CAI.
(A and B) GSEA showing expression profiles of phagocytosis/antigen presentation/DC/macrophage/T cell–related immunogenic pathways in the iris tissues following CAI and VEGFR3 depletion. Padj < 0.05 (after Benjamini-Hochberg multiple testing corrections) is considered statistically significant. NES, normalized enrichment score. (C) CD3 and Lyve1 staining of the iris tissue whole mounts from VEGFR3iLECko and VEGFR3fl/fl mice that received CAI at week 6, followed by TAM administered 5 times i.p. between days 13 and 17 and analysis on day 28 after CAI. (D) Quantification of CD3+ T cell counts (per 20× field) in C. Data are shown as mean ± SEM. n = 7 mice per group. Each dot represents 1 mouse. **P < 0.01. Mann-Whitney U test. (E) CD3 and Lyve1 staining of the iris tissue whole mounts from WT mice that received CAI at week 6, followed by VEGFC-156S or PBS intracameral injections administered 3 times between days 16 and 18 and analysis on day 28 after CAI. Note that intracameral injections with PBS alone could alleviate T cell infiltration to the injured iris and that VEGFC-156S administration could promote T cell infiltration following. (F) Quantification of CD3+ T cell counts (per 20× field) in E. Data are shown as mean ± SEM. n = 7 mice per group. Each dot represents 1 mouse. ***P < 0.001. Mann-Whitney U test. (G and H) GSEA showing expression profiles of the indicated antigen presentation/T cell–related immunogenic pathways in the iris tissues following CAI and VEGFR3 depletion. Padj < 0.05 (after Benjamini-Hochberg multiple testing corrections) is considered statistically significant. NES, normalized enrichment score. (I) CD4, CD8, and FOXP3 staining of the iris tissues from VEGFR3iLECko and VEGFR3fl/fl mice that received CAI at week 6, followed by TAM administered 5 times i.p. between days 13 and 17 and analysis on day 28 after CAI. (J) Quantification of CD4+, CD8+, and FOXP3+ T cell counts (per 20× field) in I. Scale bars: 100 μm (C, E, and I). Data are shown as mean ± SEM. n = 6 mice per group. Each dot represents 1 mouse. *P < 0.05, **P < 0.01. Mann-Whitney U test.
Figure 6
Figure 6. Inhibition of lymphangiogenesis alleviates CAI-induced retinal edema and enlargement of cervical lymph nodes.
(A) Experimental timeline of TAM administration CAI in BF. Mice received CAI or sham treatment at week 6, followed by TAM administered 5 times (80 mg/kg) i.p. between days 13 and 17 and analysis on day 28 after CAI. (B) Histological assessment of CAI-induced retina edema. Shown are representative images of the optic disc, peri-disc, middle, and peripheral regions in cross-sectioned retinas from VEGFR3iLECko and VEGFR3fl/fl mice with CAI or sham treatment. Scale bar: 50 μm. GCL, ganglion cell layer; INL, inner nuclear layer; ONL, outer nuclear layer. (C) Quantitation of thickness of the peri-disc, middle, and peripheral retinal regions in B. Data are shown as mean ± SEM. n = 4 mice per group. Each dot represents 1 mouse. *P < 0.05, **P < 0.01. One-way ANOVA with the Tukey post hoc test. (D) Quantitation of GCL, INL, and ONL thickness in the peri-disc, middle, and peripheral retinal regions in B. Data are shown as mean ± SEM. n = 4 mice per group. Each dot represents 1 mouse. *P < 0.05, **P < 0.01. One-way ANOVA with the Tukey post hoc test. (E and F) Images and the average diameter of cervical lymph nodes from VEGFR3iLECko and VEGFR3fl/fl mice with CAI or sham treatment. Scale bar: 2 mm. Data are shown as mean ± SEM. Each dot represents the average diameter of lymph nodes obtained from 1 mouse. n = 4 mice per group. *P < 0.05. Mann-Whitney U test.

Similar articles

Cited by

References

    1. Petrova TV, Koh GY. Biological functions of lymphatic vessels. Science. 2020;369(6500):eaax4063. doi: 10.1126/science.aax4063. - DOI - PubMed
    1. Klotz L, et al. Cardiac lymphatics are heterogeneous in origin and respond to injury. Nature. 2015;522(7554):62–67. doi: 10.1038/nature14483. - DOI - PMC - PubMed
    1. Biswas L, et al. Lymphatic vessels in bone support regeneration after injury. Cell. 2023;186(2):382–397. doi: 10.1016/j.cell.2022.12.031. - DOI - PubMed
    1. D’Alessio S, et al. VEGF-C-dependent stimulation of lymphatic function ameliorates experimental inflammatory bowel disease. J Clin Invest. 2014;124(9):3863–3878. doi: 10.1172/JCI72189. - DOI - PMC - PubMed
    1. Hsu M, et al. Neuroinflammation-induced lymphangiogenesis near the cribriform plate contributes to drainage of CNS-derived antigens and immune cells. Nat Commun. 2019;10(1):229. doi: 10.1038/s41467-018-08163-0. - DOI - PMC - PubMed