. 2024 Jun 10;52(10):5698-5719.
doi: 10.1093/nar/gkae233.

ARID1A regulates DNA repair through chromatin organization and its deficiency triggers DNA damage-mediated anti-tumor immune response

Affiliations

ARID1A regulates DNA repair through chromatin organization and its deficiency triggers DNA damage-mediated anti-tumor immune response

Ali Bakr et al. Nucleic Acids Res. .

Abstract

AT-rich interaction domain protein 1A (ARID1A), a SWI/SNF chromatin remodeling complex subunit, is frequently mutated across various cancer entities. Loss of ARID1A leads to DNA repair defects. Here, we show that ARID1A plays epigenetic roles to promote both DNA double-strand breaks (DSBs) repair pathways, non-homologous end-joining (NHEJ) and homologous recombination (HR). ARID1A is accumulated at DSBs after DNA damage and regulates chromatin loops formation by recruiting RAD21 and CTCF to DSBs. Simultaneously, ARID1A facilitates transcription silencing at DSBs in transcriptionally active chromatin by recruiting HDAC1 and RSF1 to control the distribution of activating histone marks, chromatin accessibility, and eviction of RNAPII. ARID1A depletion resulted in enhanced accumulation of micronuclei, activation of cGAS-STING pathway, and an increased expression of immunomodulatory cytokines upon ionizing radiation. Furthermore, low ARID1A expression in cancer patients receiving radiotherapy was associated with higher infiltration of several immune cells. The high mutation rate of ARID1A in various cancer types highlights its clinical relevance as a promising biomarker that correlates with the level of immune regulatory cytokines and estimates the levels of tumor-infiltrating immune cells, which can predict the response to the combination of radio- and immunotherapy.


Figures

Graphical Abstract
Graphical Abstract
Figure 1.
Figure 1.
ARID1A promotes DSB repair pathways. (A) Clonogenic survival assay of U2OS cells transfected either with control siRNA (siCTR) or a pool of four siRNAs targeting ARID1A (siARID1A) and treated with the indicated dose of ionizing radiation. Data are presented as mean ± SEM, One-Way ANOVA with Bonferroni's multiple comparison test was performed. (B) Representative micrographs and quantification of IR-induced γH2AX foci in U2OS cells, ca. 500 cells were counted at indicated time points. Data are presented as mean ± SEM, One-Way ANOVA with Bonferroni's multiple comparison test was performed. (C, D) HR efficiency measured in U2OS-DR cells and NHEJ efficiency measured in U2OS-EJ5 cells using the indicated siRNAs, respectively. Data are presented as mean ± SD, one-way ANOVA with Tukey's multiple comparison test ws performed. (E) Enrichment of ARID1A at the indicated DSBs in WT AID-DIvA cells, measured by ChIP-qPCR. Data are presented as mean ± SEM, Student's t test was performed. (F) Quantification of ASiSI-induced γH2AX foci in AID-DIvA cells, ca. 500 cells were counted at indicated time points. Data are presented as mean ± SEM, one-way ANOVA with Bonferroni's multiple comparison test was performed. (G) Tornado plots showing BLISS signals in WT and ARID1A-KO cells at HR-prone DSBs at the indicated time points. (H) Quantification of BLISS signals in WT and ARID1A-KO cells at HR-prone DSBs at the indicated time points. (I) Tornado plots showing BLISS signals in WT and ARID1A-KO cells at NHEJ-prone DSBs at the indicated time points. (J) Quantification of BLISS signals in WT and ARID1A-KO cells at NHEJ-prone DSBs at the indicated time points. All data presented in this figure are from n = 3 independent experiments (biological replicates). Statistical significance is presented as: * P< 0.05,** P < 0.01, *** P < 0.001, **** P < 0.0001, ns = not significant.
Figure 2.
Figure 2.
ARID1A is required for efficient chromatin loop formation. (AC) 4C–seq normalized read counts at indicated viewpoints as well as differential 4C–seq track (log2 +DSB/–DSB) in WT (grey) ARID1A-KO (blue) cells collected at indicated time points (T0 and T4). 4C–seq data were smoothed using 10-kb spans. (DF) Box plots showing the differential 4C–seq (log2 +DSB/–DSB) at indicated viewpoints. Four technical replicates from two independent experiments (biological replicates), data are presented mean ± SD, Student's t test. (GI) Enrichment of γH2AX, RAD21 and CTCF, respectively, at the indicated DSBs in WT and ARID1A-KO cells, measured by ChIP-qPCR. n = 3 independent experiments (biological replicates); data are presented as mean ± SEM, Student's t test. Statistical significance is presented as: * P < 0.05, ** P < 0.01, *** P < 0.001, **** P < 0.0001, ns = not significant.
Figure 3.
Figure 3.
ARID1A loss alters chromatin accessibility at DSBs. (A) Heatmap showing the genome-wide differentially accessible region in ARID1A-KO, measured by ATAC-seq. (B, C) Profile plot showing the differentially chromatin accessibility in ARID1A-KO (upper panel), as well as box plot showing the differential accessibility (lower panel, at HR-prone and NHEJ-prone DSBs, respectively. data are presented as mean ± SD, and Student's t test was performed. (D) Profile plots showing the differentially chromatin accessibility in WT and ARID1A-KO cells at HR-prone and at indicated time points after DSBs induction. (E) Box plots showing the differential accessibility, at HR-prone DSBs, data are presented as mean ± SD, and Student's t test was performed. (F) Profile plots showing the differentially chromatin accessibility in WT and ARID1A-KO cells at NHEJ-prone and at indicated time points after DSBs induction. (G) Box plots showing the differential accessibility, at NHEJ-prone DSBs, Student's t test was used. All data presented in this figure are from n = 3 independent experiments (biological replicates).
Figure 4.
Figure 4.
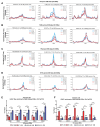
ARID1A interacts with the HDAC1-RSF1 complex to control the distribution of activating histone marks at the DSBs (A, B) Normalized ACT-seq coverage showing the enrichment of H3K27ac at HR- and NHEJ-prone DSBs, respectively, at the indicated time points in WT and ARID1A-KO cells. (C, D) Normalized ACT-seq coverage showing the enrichment of H2A118ac at HR- and NHEJ-prone DSBs, respectively, at the indicated time points in WT and ARID1A-KO cells. (E, F) Enrichment of H2AK118ac and HDAC1, respectively, at the HR-prone DSBs in WT and ARID1A-KO cells, measured by ChIP-qPCR. Data are presented as mean ± SEM, and Student's t test was performed. All data presented in this figure are from n = 3 independent experiments (biological replicates). Statistical significance is presented as: * P < 0.05, ** P < 0.01, *** P < 0.001, **** P < 0.0001, ns = not significant.
Figure 5.
Figure 5.
ARID1A regulates the transcription repression at HR-prone DSBs. (A) Heat map showing differentially expressed genes that are located in close proximity to HR-prone DSBs. (B) Bar plot showing the upregulation of the genes located close to HR-prone DSBs in ARID1A-KO cells. (C) Heat map showing differentially expressed genes that are located in close proximity to HR-prone DSBs. (D) Bar plot showing the upregulation of the genes located close to NHEJ-prone DSBs in ARID1A-KO cells. (E) Enrichment of pS2-RNAPII at the HR-prone DSBs in WT and ARID1A-KO cells, measured by ChIP-qPCR. Data are presented as mean ± SEM, and Student's t test was performed. (F) Translocation frequencies in WT and ARID1A-KO AID-DIvA cells measured by qPCR of MIS12:TRIM37, LINC00271:LYRM2 and RIM37:RBMXL1 rejoining after DSB induction, normalized to untreated control. Data are presented as mean ± SEM, and Student's t test was performed. All data presented in this figure are from n = 3 independent experiments (biological replicates). Statistical significance is presented as: * P < 0.05, ** P < 0.01, *** P < 0.001, **** P < 0.0001, ns = not significant.
Figure 6.
Figure 6.
ARID1A depletion is associated with activation of cGAS/STING-mediated immune response. (A) Representative micrographs and quantification of micronuclei in MDA-MB231 cells transfected either with control siRNA (siCTR) or a pool of four siRNAs targeting ARID1A (siARID1A) and treated with the indicated dose of ionizing radiation. 500 cells were counted at indicated time points. n = 3 independent experiments (biological replicates); data are presented as mean ± SEM, and Student's t test was performed. (B) Representative micrographs and quantification of the overlap between micronuclei, cytosolic dsDNA and cGAS in MDA-MB231 transfected either with control siRNA (siCTR) or a pool of four siRNAs targeting ARID1A (siARID1A) and treated with the indicated dose of ionizing radiation. 500 cells were counted at indicated time points. n = 3 independent experiments (biological replicates); data are presented as mean ± SEM, and Student's t test was performed. (C) Western blot expression analysis of p-IRF3 in MDA-MB231 cells transfected either with siCTR or siARID1A and treated with the indicated dose of ionizing radiation. Representative WB from 3 independent experiments (biological replicates). (D) mRNA expression analysis of cGAS/STING-mediated immune cytokines, done by RT-qPCR. n = 3 independent experiments (biological replicates); data are presented as mean ± SEM, and Student's t test was performed. Statistical significance is presented as: * P < 0.05, ** P < 0.01, *** P < 0.001, **** P < 0.0001, ns = not significant.
Figure 7.
Figure 7.
ARID1A depletion is associated with the infiltration of immune cells in cancer patients. (A) Box plot representation showing ARID1A expression in clusters of patient samples of TCGA Breast invasive carcinoma (BRCA). (B) Box plot showing ARID1A expression in group 1 and 4 of patient samples of TCGA BRCA, who received radiotherapy (upper panel), as well as the expression of IL-6 in the indicated groups (lower panel). (C) Box plots showing the level of immune cells infiltration in group 1 and 4 of patient samples of TCGA BRCA, who received radiotherapy. (D) Breast cancer patient survival analysis comparing group 1 and 4 with or without radiotherapy treatment. Statistical significance is presented as: * P < 0.05, ** P < 0.01, *** P < 0.001, **** P < 0.0001, ns = not significant.

References

    1. O’Connor M.J. Targeting the DNA damage response in cancer. Mol. Cell. 2015; 60:547–560. - PubMed
    1. Lieber M.R., Wilson T.E. SnapShot: nonhomologous DNA end joining (NHEJ). Cell. 2010; 142:496–496. - PubMed
    1. Moynahan M.E., Jasin M. Mitotic homologous recombination maintains genomic stability and suppresses tumorigenesis. Nat. Rev. Mol. Cell Biol. 2010; 11:196–207. - PMC - PubMed
    1. Mailand N., Bekker-Jensen S., Faustrup H., Melander F., Bartek J., Lukas C., Lukas J. RNF8 ubiquitylates histones at DNA double-strand breaks and promotes assembly of repair proteins. Cell. 2007; 131:887–900. - PubMed
    1. Huen M.S., Grant R., Manke I., Minn K., Yu X., Yaffe M.B., Chen J. RNF8 transduces the DNA-damage signal via histone ubiquitylation and checkpoint protein assembly. Cell. 2007; 131:901–914. - PMC - PubMed

MeSH terms