. 2024 Aug 2;14(8):1457-1475.
doi: 10.1158/2159-8290.CD-24-0052.

Novel WRN Helicase Inhibitors Selectively Target Microsatellite-Unstable Cancer Cells

Affiliations

Novel WRN Helicase Inhibitors Selectively Target Microsatellite-Unstable Cancer Cells

Gabriele Picco et al. Cancer Discov. .

Abstract

Microsatellite-unstable (MSI) cancers require WRN helicase to resolve replication stress due to expanded DNA (TA)n dinucleotide repeats. WRN is a promising synthetic lethal target for MSI tumors, and WRN inhibitors are in development. In this study, we used CRISPR-Cas9 base editing to map WRN residues critical for MSI cells, validating the helicase domain as the primary drug target. Fragment-based screening led to the development of potent and highly selective WRN helicase covalent inhibitors. These compounds selectively suppressed MSI model growth in vitro and in vivo by mimicking WRN loss, inducing DNA double-strand breaks at expanded TA repeats and DNA damage. Assessment of biomarkers in preclinical models linked TA-repeat expansions and mismatch repair alterations to compound activity. Efficacy was confirmed in immunotherapy-resistant organoids and patient-derived xenograft models. The discovery of potent, selective covalent WRN inhibitors provides proof of concept for synthetic lethal targeting of WRN in MSI cancer and tools to dissect WRN biology. Significance: We report the discovery and characterization of potent, selective WRN helicase inhibitors for MSI cancer treatment, with biomarker analysis and evaluation of efficacy in vivo and in immunotherapy-refractory preclinical models. These findings pave the way to translate WRN inhibition into MSI cancer therapies and provide tools to investigate WRN biology. See related commentary by Wainberg, p. 1369.


Conflict of interest statement

Declaration of Interests

AstraZeneca, GlaxoSmithKline, and Astex Pharmaceuticals have awarded MJG research grants. Additionally, MJG and EV are founders and advisors at Mosaic Therapeutics. GP serves in a consultant role for Mosaic Therapeutics. All authors listed with an affiliation to GSK are GlaxoSmithKline (GSK) employees except JEC and YP, who are no longer GSK employees. SV is currently employed at Astrazeneca.

Figures
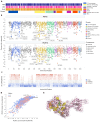
Figure 1
Figure 1. Functional interrogation of WRN domains using base editing screens in MSI cells.
(A) Heatmap of predicted cytosine and adenine base editing edit sites across WRN amino acids. Individual and combined putative edits are overlaid with the main WRN protein domains. (B) Functional variant mapping of WRN for KM12 (top) and RL95-2 (bottom). Z-scores from the base editing screens for each sgRNA are displayed across WRN protein domains. sgRNAs that are referenced in the text and that introduce potential LOF and GOF positions are highlighted with their predicted edited amino acid locations. Screen z-scores for each base editor were determined individually and are shown side by side for comparison. The size of each dot in the graph is proportional to the value of the Z-score (C) Missense variants are represented as dots, plotted based on their AlphaMissense (AM) pathogenicity scores (y-axis) versus their amino acid positions (x-axis of panel B). Variants predicted to be pathogenic (red), likely benign variants (blue), and ambiguous ones (grey) were highlighted as downloaded from the AlphaMissense database (30). (D) Correlation between KM12 (y-axis) and RL95-2 (x-axis) z-scores, with ABE screens in red and CBE screens in blue. (E) The crystal structure of the WRN helicase domain (PDB ID: 6YHR) highlighting residues intolerant to variation identified by base editing screens. Missense edits predicted to introduce proline are marked in orange, while other missense variants are indicated in yellow. ATP analogue AMP-PNP in green has been mapped onto the WRN structure.
Figure 2
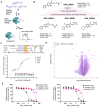
Figure 2. Fragment-based screening identifies potent and selective small molecule WRN helicase inhibitors.
(A) Schematic overview of the fragment-based screening strategy used. (B) Structures of the WRN helicase compounds identified, from the initial hit fragment to the optimized compounds. The IC50s (μM) are reported for MSI and MSS cell lines. (C) Selectivity analysis shows GSK_WRN4 exhibits specificity towards WRN compared to other RecQ family helicases. The schematics above represent the main functional domains of RecQ DNA helicases (created with BioRender.com). (D) Volcano plot of quantitative reactive cysteine profiling of Jurkat cells treated with 10 μM GSK_WRN4. The GSK_WRN4 target cysteine residue WRN Cys727 is indicated. (E) The relative growth of SW48 control and isogenic cells (C727A and C727S) when treated with GSK_WRN3 (left panel) and GSK_WRN4 (right panel) inhibitors. Growth is normalized to DMSO controls and plotted against inhibitor concentrations. Data points reflect average values, with error bars showing the standard deviation of three technical replicates.
Figure 3
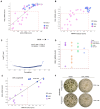
Figure 3. Selective Inhibition of MSI Cell Growth by WRN Inhibitors Correlates with Genetic Inactivation.
(A) Sensitivity of 42 cell lines to GSK_WRN3 and GSK_WRN4. MSI cancer cell lines (pink circles) exhibit a higher level of preferential inhibition than MSS models (blue), as delineated by the red dashed box (AUC< 0.85). (B) Sensitivity of cell lines to GSK_WRN3 versus WRN CRISPR knockout log-fold change (LFC). Drug sensitivity is measured as the area under the dose response curve (AUC). (C) Genome-wide CRISPR-Cas9 gene essentiality profiles versus GSK_WRN3 sensitivity in 39 cell lines. The correlation with WRN knockout is plotted along the x-axis, while the - log10 p-value is on the y-axis. (D) The dot plot displays the AUC of GSK_WRN3 for different MSI-predominant tissues, with each dot symbolizing a cell line and colors indicating tissue type. (E) A scatter plot correlating GSK_WRN3 activity in colorectal cancer (CRC) organoids to WRN knockout LFC showcases a strong positive correlation. Color indicates MSI status. (F) Representative images of CRC organoids that are refractory to immunotherapy, treated with either DMSO or 1.25 µM GSK_WRN3. Patient clincal response to nivolumab is indicated.
Figure 4
Figure 4. Sensitivity to WRN Inhibition in MSI Cancer Models Correlated with TA-Repeat Expansions and MMR Gene Alterations
(A) Heatmap representing GSK_WRN3 sensitivity in MSI cell lines, measured by lnIC50 values. The rows illustrate data for TA-repeat expansions TAn (fpbm), WRN CRISPR dependency log fold change (WRN LFC), and TP53 mutations (TP53_mut). The mutation status of MMR-pathway genes (MLH1, MLH3, MSH2, MSH3, MSH6, PMS1, PMS2) is displayed using colour-coded squares for different mutation types: exon splice (yellow), frameshift (green), missense (orange), nonsense (cyan), and RNAseq confirmation (black). The tissue origin of each cell line is shown. (B) Comparative heatmap for CRC organoids, segregating MSI and MSS profiles. The layout is similar to A, with data for two MSS models included for comparison. (C) Correlation of the IC50 of GSK_WRN3 in colorectal cancer (CRC) organoids to the median depth of 'broken' TA-repeats, as determined by coverage analysis from whole genome sequencing.
Figure 5
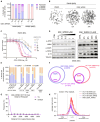
Figure 5. Chromosomal Instability and DNA Damage in MSI Cells Induced by WRN Pharmacological Inhibition.
(A) Chromatid breaks in SW48 (MSI) and SW620 (MSS) cell lines after treatment with DMSO (ctrl) or GSK_WRN3 (2 μM). Twenty metaphase spreads were analyzed per treatment. (B) Representative images of SW48 metaphase spreads harvested after treatment with DMSO (12h) or GSK_WRN3 (12 and 24 h). (C) Time- and dose-dependent inhibition of SW48 cell growth by GSK_WRN4. SW48 cells were treated with 0.1-20 μM for 1.5, 6, 12, 24, 48, 72, or 144 hours. GSK_WRN4 was then washed out, and cell growth was assessed by cell counting over 72 hours. Data points represent the mean ± SD of three independent experiments. (D) Immunoblots of phospho-ATM, WRN, γ-H2AX, phospho-KAP1, and p21 in SW48 cells. Left panel: Post 48h treatment with GSK_WRN3, multiple concentrations as indicated. Right panel: Various time points post-treatment with 1μM GSK_WRN3 (E). Cell cycle phase distribution in HCT116 iWRN cells treated with doxycycline, and HCT116, SW48, and KM12 cells were treated with 2μM GSK_WRN3 for 24h. Data are representative of three independent experiments. (F) The overlap of TrAEL-seq peaks in HCT116 (MSI) cells treated with GSK_WRN3, KM12 cells treated with GSK_WRN3, and HCT116 cells with CRISPR-mediated WRN knockout (i-WRN doxy). (G) Frequency distribution showing the distance in base pairs (bp) of TrAEL-seq peaks in the GSK_WRN3-treated HCT116 cells from the nearest of 67,186 annotated TA-repeat tracts (magenta line) and from 70,000 random sites (dashed line). The x-axis is capped at 5kb to emphasize the initial genomic spacing. (H) TrAEL-seq signal metaplots in HCT116 iWRN cells. The figure compares signal variations across 'broken' TA-repeats (van Wietmarschen et al. 2020)(19) under different conditions: DMSO (control), doxycycline (inducing sgRNA), and GSK_WRN3 in HCT116 and KM12 cells. The Y-axis shows average peak read counts, with the X-axis depicting relative peak positions: 100bp upstream, within, and 100bp downstream of TA-repeats.
Figure 6
Figure 6. Effects of GSK_WRN4 treatment on CRC cell lines and patient-derived xenografts in vivo.
(A-D) Tumor volume measurements over time for xenograft of SW48, SW620, LS411N, and HT-29 CRC cell lines treated with vehicle or GSK_WRN4 at different doses (30, 100, 300 mpk). (E-H) Quantitative analysis of p21, p-KAP1, ɣH2AX and cleaved-Caspase 3 expression levels at days 0, 1, 2, and 9 post-treatment with GSK_WRN4, presented as H-score or percentage of positive cells. (I) Representative immunohistochemical staining for p21, p-KAP1, Y-H2AX, and Ki67 in SW48 tumors treated with vehicle or GSK_WRN4 (300 mpk) at various time points. (J) Tumor volume measurements in an immunotherapy-refractory tumor xenograft derived from MSI CRC, treated with vehicle or GSK_WRN4 (300 mpk). Arrows denote the schematic timeline of clinical treatments, duration, and the corresponding tumor response before PDX establishment. *Note: Error bars represent SEM. Asterisks denote statistical significance compared to vehicle treatment (* p<0.05, ** p<0.01, *** p<0.001, ***p<0.0001). mpk: milligrams per kilogram, the unit for the administered dose. H-score: a combined score of staining intensity and percentage of positive cells. PD: Progressive disease, SD: Stable disease. PO: per os indicating oral administration QD: per daily,

References

    1. Cortes-Ciriano I, Lee S, Park W-Y, Kim T-M, Park PJ. A molecular portrait of microsatellite instability across multiple cancers. Nat Commun. 2017;8:15180. doi: 10.1038/ncomms15180. - DOI - PMC - PubMed
    1. Bonneville R, Krook MA, Kautto EA, Miya J, Wing MR, Chen H-Z, et al. Landscape of Microsatellite Instability Across 39 Cancer Types. JCO Precis Oncol. 2017;2017:1–15. doi: 10.1200/PO.17.00073. - DOI - PMC - PubMed
    1. Toh J, Spring K. Ann Oncol. Vol. 30. Elsevier BV; 2019. Microsatellite Instability (MSI) status and prognosis in colorectal cancer: Meta-analysis; v220.
    1. Zhu L, Li Z, Wang Y, Zhang C, Liu Y, Qu X. Microsatellite instability and survival in gastric cancer: A systematic review and meta-analysis. Mol Clin Oncol. 2015;3:699–705. doi: 10.3892/mco.2015.506. - DOI - PMC - PubMed
    1. Cohen R, Rousseau B, Vidal J, Colle R, Diaz LA, Jr, André T. Immune Checkpoint Inhibition in Colorectal Cancer: Microsatellite Instability and Beyond. Target Oncol. 2020;15:11–24. - PubMed