

Saccharomyces cerevisiae strains performing similarly during fermentation of lignocellulosic hydrolysates show pronounced differences in transcriptional stress responses
- PMID: 38587374
- PMCID: PMC11107148
- DOI: 10.1128/aem.02330-23
Saccharomyces cerevisiae strains performing similarly during fermentation of lignocellulosic hydrolysates show pronounced differences in transcriptional stress responses
Abstract
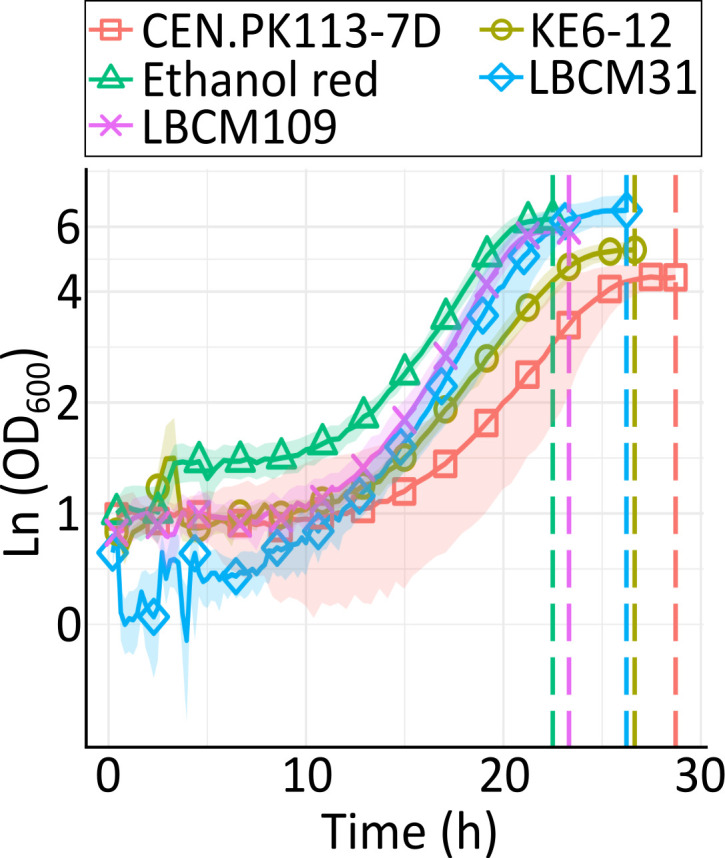
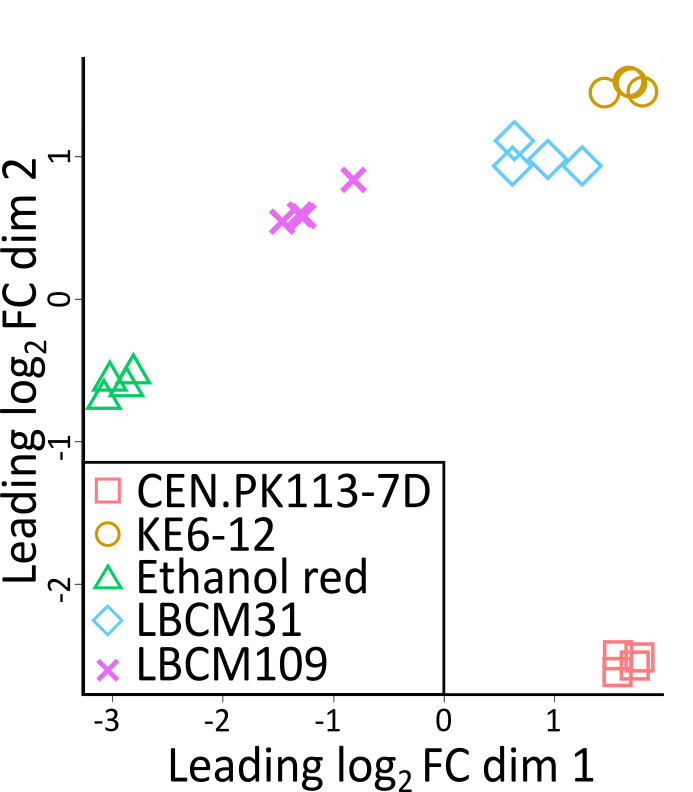
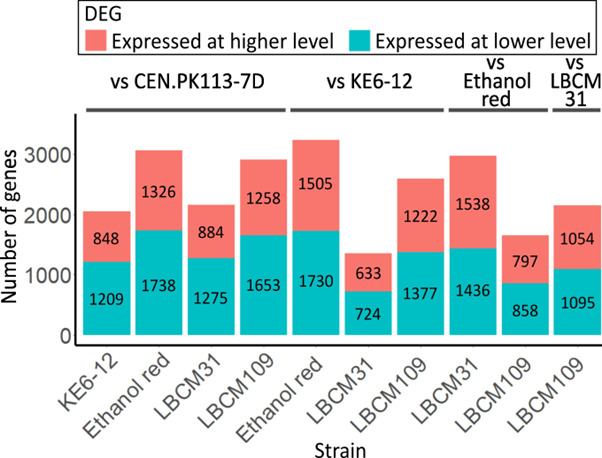
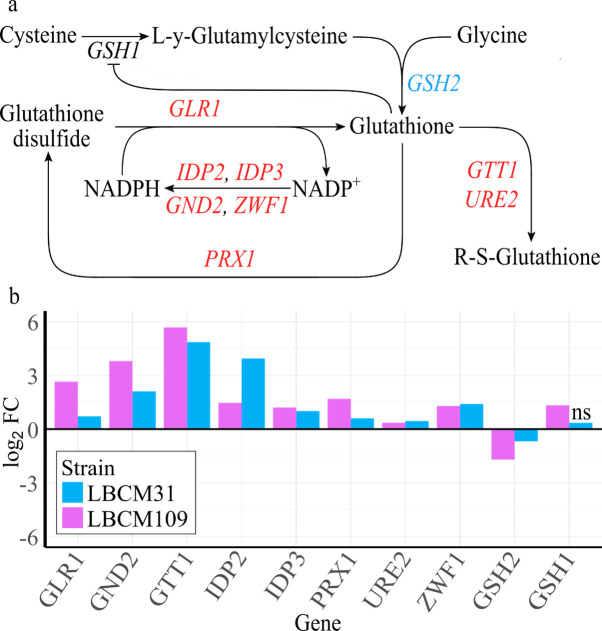
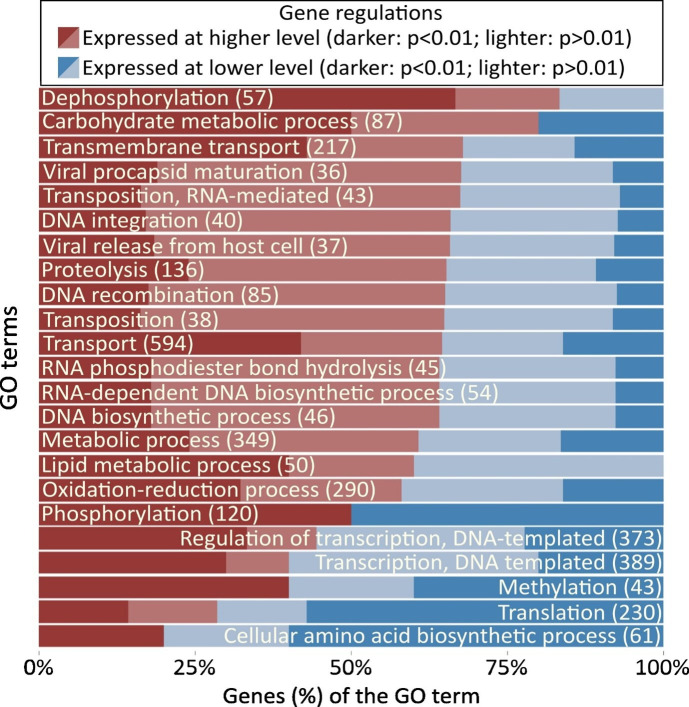
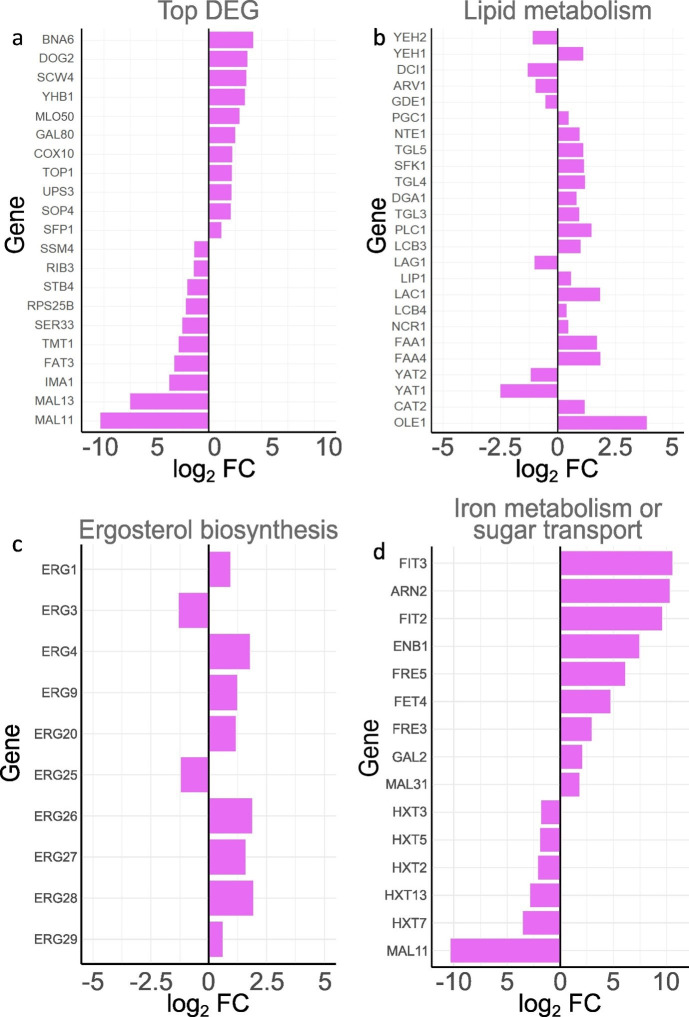
Improving our understanding of the transcriptional changes of Saccharomyces cerevisiae during fermentation of lignocellulosic hydrolysates is crucial for the creation of more efficient strains to be used in biorefineries. We performed RNA sequencing of a CEN.PK laboratory strain, two industrial strains (KE6-12 and Ethanol Red), and two wild-type isolates of the LBCM collection when cultivated anaerobically in wheat straw hydrolysate. Many of the differently expressed genes identified among the strains have previously been reported to be important for tolerance to lignocellulosic hydrolysates or inhibitors therein. Our study demonstrates that stress responses typically identified during aerobic conditions such as glutathione metabolism, osmotolerance, and detoxification processes also are important for anaerobic processes. Overall, the transcriptomic responses were largely strain dependent, and we focused our study on similarities and differences in the transcriptomes of the LBCM strains. The expression of sugar transporter-encoding genes was higher in LBCM31 compared with LBCM109 that showed high expression of genes involved in iron metabolism and genes promoting the accumulation of sphingolipids, phospholipids, and ergosterol. These results highlight different evolutionary adaptations enabling S. cerevisiae to strive in lignocellulosic hydrolysates and suggest novel gene targets for improving fermentation performance and robustness.
Importance: The need for sustainable alternatives to oil-based production of biochemicals and biofuels is undisputable. Saccharomyces cerevisiae is the most commonly used industrial fermentation workhorse. The fermentation of lignocellulosic hydrolysates, second-generation biomass unsuited for food and feed, is still hampered by lowered productivities as the raw material is inhibitory for the cells. In order to map the genetic responses of different S. cerevisiae strains, we performed RNA sequencing of a CEN.PK laboratory strain, two industrial strains (KE6-12 and Ethanol Red), and two wild-type isolates of the LBCM collection when cultivated anaerobically in wheat straw hydrolysate. While the response to inhibitors of S. cerevisiae has been studied earlier, this has in previous studies been done in aerobic conditions. The transcriptomic analysis highlights different evolutionary adaptations among the different S. cerevisiae strains and suggests novel gene targets for improving fermentation performance and robustness.
Keywords: RNA sequencing; industrial yeast strains; inhibitor stress; tolerance; wild-type isolates.
Conflict of interest statement
The authors declare no conflict of interest.
Figures
Similar articles
-
Screening of natural yeast isolates under the effects of stresses associated with second-generation biofuel production.J Biosci Bioeng. 2016 May;121(5):509-16. doi: 10.1016/j.jbiosc.2015.09.006. Epub 2015 Oct 21. J Biosci Bioeng. 2016. PMID: 26481160
-
Genome-wide screening of Saccharomyces cerevisiae genes required to foster tolerance towards industrial wheat straw hydrolysates.J Ind Microbiol Biotechnol. 2014 Dec;41(12):1753-61. doi: 10.1007/s10295-014-1519-z. Epub 2014 Oct 7. J Ind Microbiol Biotechnol. 2014. PMID: 25287021
-
Data mining of Saccharomyces cerevisiae mutants engineered for increased tolerance towards inhibitors in lignocellulosic hydrolysates.Biotechnol Adv. 2022 Jul-Aug;57:107947. doi: 10.1016/j.biotechadv.2022.107947. Epub 2022 Mar 18. Biotechnol Adv. 2022. PMID: 35314324 Review.
-
Influence of genetic background of engineered xylose-fermenting industrial Saccharomyces cerevisiae strains for ethanol production from lignocellulosic hydrolysates.J Ind Microbiol Biotechnol. 2017 Nov;44(11):1575-1588. doi: 10.1007/s10295-017-1979-z. Epub 2017 Sep 11. J Ind Microbiol Biotechnol. 2017. PMID: 28891041
-
Development of Robust Yeast Strains for Lignocellulosic Biorefineries Based on Genome-Wide Studies.Prog Mol Subcell Biol. 2019;58:61-83. doi: 10.1007/978-3-030-13035-0_3. Prog Mol Subcell Biol. 2019. PMID: 30911889 Review.
Cited by
-
Advances in fungal sugar transporters: unlocking the potential of second-generation bioethanol production.Appl Microbiol Biotechnol. 2025 Jan 22;109(1):19. doi: 10.1007/s00253-025-13408-2. Appl Microbiol Biotechnol. 2025. PMID: 39841260 Free PMC article. Review.
References
-
- Favaro L, Basaglia M, Trento A, Van Rensburg E, García-Aparicio M, Van Zyl WH, Casella S. 2013. Exploring grape marc as trove for new thermotolerant and inhibitor-tolerant Saccharomyces cerevisiae strains for second-generation bioethanol production. Biotechnol Biofuels 6:1–14. doi:10.1186/1754-6834-6-168 - DOI - PMC - PubMed
-
- Jansen MLA, Bracher JM, Papapetridis I, Verhoeven MD, de Bruijn H, de Waal PP, van Maris AJA, Klaassen P, Pronk JT. 2017. Saccharomyces cerevisiae strains for second-generation ethanol production: from academic exploration to industrial implementation. FEMS Yeast Res. 17:1–20. doi:10.1093/femsyr/fox044 - DOI - PMC - PubMed
Publication types
MeSH terms
Substances
Grants and funding
LinkOut - more resources
Full Text Sources
