. 2024 May 8;15(5):e0069324.
doi: 10.1128/mbio.00693-24. Epub 2024 Apr 9.

Recombinational exchange of M-fibril and T-pilus genes generates extensive cell surface diversity in the global group A Streptococcus population

Affiliations

Recombinational exchange of M-fibril and T-pilus genes generates extensive cell surface diversity in the global group A Streptococcus population

Debra E Bessen et al. mBio. .

Abstract

Among genes present in all group A streptococci (GAS), those encoding M-fibril and T-pilus proteins display the highest levels of sequence diversity, giving rise to the two primary serological typing schemes historically used to define strain. A new genotyping scheme for the pilin adhesin and backbone genes is developed and, when combined with emm typing, provides an account of the global GAS strain population. Cluster analysis based on nucleotide sequence similarity assigns most T-serotypes to discrete pilin backbone sequence clusters, yet the established T-types correspond to only half the clusters. The major pilin adhesin and backbone sequence clusters yield 98 unique combinations, defined as "pilin types." Numerous horizontal transfer events that involve pilin or emm genes generate extensive antigenic and functional diversity on the bacterial cell surface and lead to the emergence of new strains. Inferred pilin genotypes applied to a meta-analysis of global population-based collections of pharyngitis and impetigo isolates reveal highly significant associations between pilin genotypes and GAS infection at distinct ecological niches, consistent with a role for pilin gene products in adaptive evolution. Integration of emm and pilin typing into open-access online tools (pubmlst.org) ensures broad utility for end-users wanting to determine the architecture of M-fibril and T-pilus genes from genome assemblies.IMPORTANCEPrecision in defining the variant forms of infectious agents is critical to understanding their population biology and the epidemiology of associated diseases. Group A Streptococcus (GAS) is a global pathogen that causes a wide range of diseases and displays a highly diverse cell surface due to the antigenic heterogeneity of M-fibril and T-pilus proteins which also act as virulence factors of varied functions. emm genotyping is well-established and highly utilized, but there is no counterpart for pilin genes. A global GAS collection provides the basis for a comprehensive pilin typing scheme, and online tools for determining emm and pilin genotypes are developed. Application of these tools reveals the expansion of structural-functional diversity among GAS via horizontal gene transfer, as evidenced by unique combinations of surface protein genes. Pilin and emm genotype correlations with superficial throat vs skin infection provide new insights on the molecular determinants underlying key ecological and epidemiological trends.

Keywords: cell surface proteins; genotyping; group A streptococcus; molecular epidemiology; pili; population biology.


Conflict of interest statement

The authors declare no conflict of interest.

Figures

Fig 1
Fig 1
FCT-region forms of GAS. Nomenclature is proposed for pilin subunit adhesin (pilA), backbone (pilB), and linker (pilL) loci (arrows), for each of the eight FCT-region forms present in genomes of 628 GAS isolates. Horizontal dotted lines separate the FCT-region forms corresponding to the six major lineages of pilin loci (shades of blue). Other loci encode transcriptional regulators (arrows, no fill), fibronectin-binding proteins (dark gray), pilus biosynthesis enzymes (medium gray), and a putative LPxTG-linked surface protein (designated fctZ; light gray) sharing weak homology with the pilin-like homolog of Spa from Corynebacterium diphtheriae. Note that FCT-11 described in reference (34) is renamed FCT-10 based on its similarity to that described in reference (35). The FCT-9 region has either a full-length or partial prtF1 locus. FCT-regions range from ~11 to 16 kb (33); FCT-7 and FCT-8, as originally defined by PCR-based mapping (32), have not been confirmed via WGS. The alternative nomenclature of Table S2 is also indicated (light gray font).
Fig 2
Fig 2
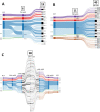
Sankey diagram for visualizing pilin sequence clusters. FCT-region assignment (colors) was determined for 628 genomes (FCT-9 lacks the pilA locus). (A) Clustering of 257 pilin adhesin sequences at two thresholds: amino acid similarity at 50% over 90% sequence length (PilA aa50) and a pilA gene homology at 80% sequence identity and length (pilA nt80). (B) Clustering of 219 pilin backbone sequences, as described for pilin adhesin sequences. The number of clusters at each threshold is indicated (boxed). (C) Merged Sankey plots for pilin adhesin and backbone sequences, illustrating intra-FCT-region crossover events and unique pilin types.
Fig 3
Fig 3
Neighbor-net analysis of pilB34 alleles. The 137 pilB34 alleles were aligned by MUSCLE and underwent neighbor-net analysis using SplitsTree v5. Alleles corresponding to the 12 T-serotype reference strains harboring a pilB34 allele are indicated (red font and red dots). Also marked are the positions of the 12 nt80 clusters identified by cd-hit (blue).
Fig 4
Fig 4
FCT-region forms and emm pattern groups for the set of unique emm-pilin type combinations. Fractional distribution of 379 GAS organisms having unique combinations of emm and pilin type, according to FCT-region form (A) and emm pattern grouping (B); REA, rearranged; yellow (unlabeled), FCT-6.
Fig 5
Fig 5
Genetic distances among 158 unique emm-pilin types. Each unique emm-pilin type having multiple isolates in the data set is analyzed for the maximum number of core housekeeping gene differences among those isolates (x-axis). (A) Distribution of same vs different PopPUNK phylogroups (whole-genome clusters). (B) Distribution of wide vs narrow spatiotemporal distances. A wide spatiotemporal distance is defined as the recovery of multiple isolates from different countries and/or >2 years apart, based on Table S1 data.
Fig 6
Fig 6
Associations between emm and pilin genotypes. (A) The number of emm types found in association with three pilin genotypes defined over a wide range of resolution (pilin types, blue; pilB nt80 clusters, red; FCT-region forms, green). (B) The number of pilin types found in association with various numbers of emm types. The four emm-null organisms are excluded from all calculations.
Fig 7
Fig 7
Associations between pilin adhesin and backbone sequence clusters. Bar heights (y-axis) indicate the number of pilB nt80 clusters having variable numbers of associated pilA nt80 clusters (x-axis). For pilB nt80 clusters associated with >1 pilA nt80 cluster, the latter are characterized as belonging to a single (green) or multiple (red) PilA aa50 cluster(s).
Fig 8
Fig 8
Distribution of pilin sequences across the FCT-3 and FCT-4 regions. For the 258 organisms with unique emm-pilin types and FCT-3 or FCT-4 region forms, relative distributions are measured for (A) PilA aa50 sequence clusters; (B) pilA nt80 sequence clusters; and (C) pilB nt80 sequence clusters. The x-axes designate the cluster number assignments. The pilA nt80_16, nt80_17 and nt80_18 clusters (panel B) correspond to the PilA aa50_05 cluster (panel A).
Fig 9
Fig 9
Distribution of inferred pilin genotypes among pharyngitis and impetigo isolates. Data are summarized for pharyngitis (Table S9) and impetigo (Table S10) isolates; excluded are isolates (<1%) with FCT-region forms not determined (n.d.). Inferences for pilin genotypes are based on known emm types, using the combined data for Tables S1, S9, and S10. (A) Distribution of pharyngitis and impetigo isolates among FCT-region forms for 34 pharyngitis and 10 impetigo surveys. (B) Relative ratios of pharyngitis to impetigo isolates, according to FCT-region form; observed vs expected comparisons for pharyngitis vs impetigo isolates, for each FCT-region assignment, were assessed by Fishers exact test and/or χ2 with Yates correction (two-tailed); P values are highly significant (P < 0.01, **) except for FCT-4 (non-significant, NS). (C and D) Relative fractional ratios (log10) of pharyngitis to impetigo isolates, according to inferred pilin (pil) type (C) (raw data are listed in Table S12), and pilA nt80 cluster (D); excluded are pilin genotypes comprising <1% of pharyngitis or impetigo isolates; each unique pilin genotype is depicted by ●. For (C), mean averages (bars) are shown; for FCT-3 vs FCT-4 pilin types, t < 0.01 (unpaired t-test and two-tailed).
Fig 10
Fig 10
Distribution of inferred emm genotypes among pharyngitis and impetigo isolates. Data are summarized for pharyngitis (Table S9) and impetigo (Table S10) isolates; excluded are isolates (<1%) with emm pattern groupings that are n.d., rearranged, or mixed for an emm type; emm cluster is inferred from emm type as described (43). (A) Distribution of pharyngitis and impetigo isolates among emm pattern groupings for 34 pharyngitis and 10 impetigo surveys. (B) Relative ratios of pharyngitis to impetigo isolates according to major emm pattern grouping. Paired t test (two-tailed) for two-way comparisons between the percentage of isolates assigned to emm pattern groups A–C vs D, for the 34 collections of pharyngitis isolates (t = 7.20E-05) and for the 10 collections of impetigo isolates (t = 2.04E-06). (C) Distribution of pharyngitis and impetigo isolates among emm clusters; “single clade Y” genes represent emm genes that occupy single branches in the phylogenetic tree and are subdivided for emm patterns A–C and D. (D and E) Distribution of pharyngitis (D) and impetigo (E) isolates among the five main emm cluster groups (plus “other”), according to inferred FCT-region form. (F) Relative fractional ratios (log10) of pharyngitis to impetigo isolates, according to inferred pilA nt80 cluster (left; as shown in Fig. 9D) or a subset of pilA nt80 clusters recovered in association with emm cluster D4 (right), which harbors a (putative) plasminogen-binding domain. Colored symbols: red, pilA nt80_16; green, nt80_8; blue, nt80_12; orange, nt80_15; purple, nt80_17; brown, nt80_14.

References

    1. Carapetis JR, Steer AC, Mulholland EK, Weber M. 2005. The global burden of group A Streptococcal diseases. Lancet Infect Dis 5:685–694. doi:10.1016/S1473-3099(05)70267-X - DOI - PubMed
    1. Bryant AE, Stevens DL. 2020. Streptococcus pyogenes. In Mandell GL, Douglas RG, Dolin R (ed), Principles and practice of infectious diseases, 9th ed. Churchill Livingstone, Philadelphia.
    1. Bessen DE, Smeesters PR, Beall BW. 2018. Molecular epidemiology, ecology, and evolution of group A Streptococci, Microbiol Spectrum 6(1):Gpp3-0009-2018. In Fischetti VA, Novick RP, Ferretti JJ, Portnoy DA, Rood JI (ed), Gram-positive pathogens, vol 6. ASM Press, Washington D.C. - PMC - PubMed
    1. Kalia A, Spratt BG, Enright MC, Bessen DE. 2002. Influence of recombination and niche separation on the population genetic structure of the pathogen Streptococcus pyogenes. Infect Immun 70:1971–1983. doi:10.1128/IAI.70.4.1971-1983.2002 - DOI - PMC - PubMed
    1. Johnson DR, Kaplan EL, VanGheem A, Facklam RR, Beall B. 2006. Characterization of group A Streptococci (Streptococcus pyogenes): correlation of M-protein and emm-gene type with T-protein agglutination pattern and serum opacity factor. J Med Microbiol 55:157–164. doi:10.1099/jmm.0.46224-0 - DOI - PubMed

Publication types

MeSH terms

LinkOut - more resources