. 2024 May 2;84(9):1517-1533.
doi: 10.1158/0008-5472.CAN-23-1660.

Transfer Learning Reveals Cancer-Associated Fibroblasts Are Associated with Epithelial-Mesenchymal Transition and Inflammation in Cancer Cells in Pancreatic Ductal Adenocarcinoma

Affiliations

Transfer Learning Reveals Cancer-Associated Fibroblasts Are Associated with Epithelial-Mesenchymal Transition and Inflammation in Cancer Cells in Pancreatic Ductal Adenocarcinoma

Samantha Guinn et al. Cancer Res. .

Abstract

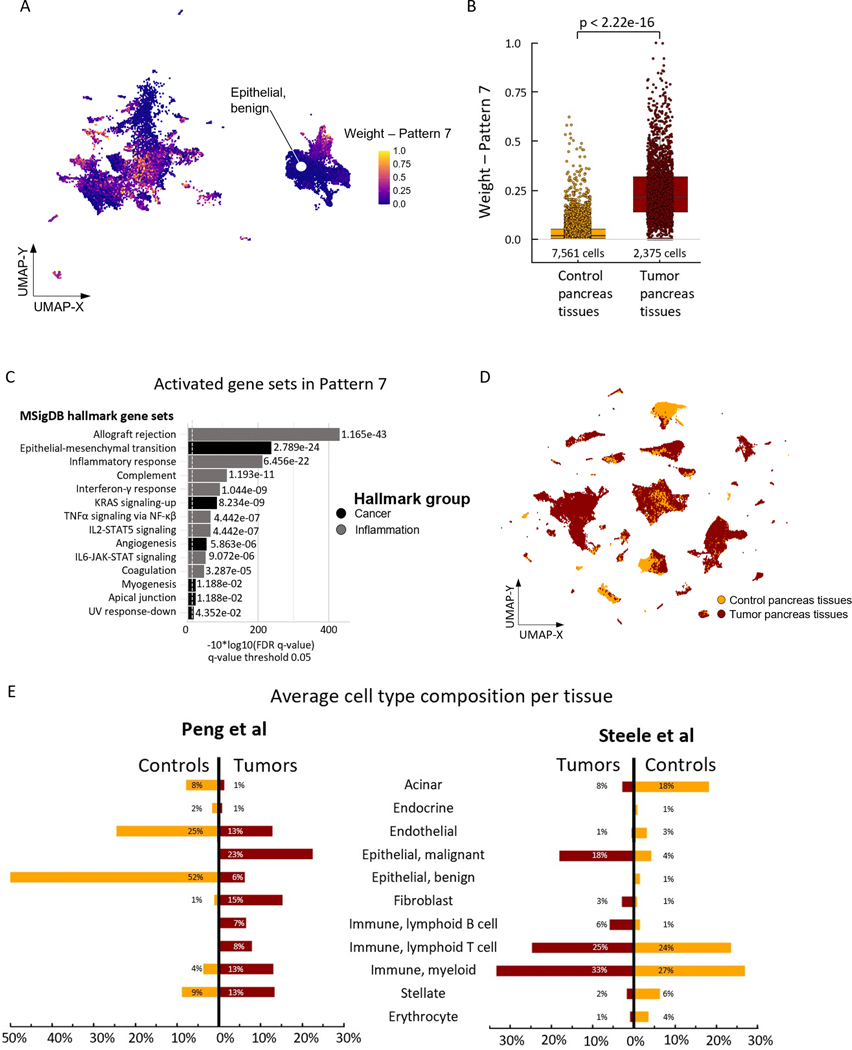
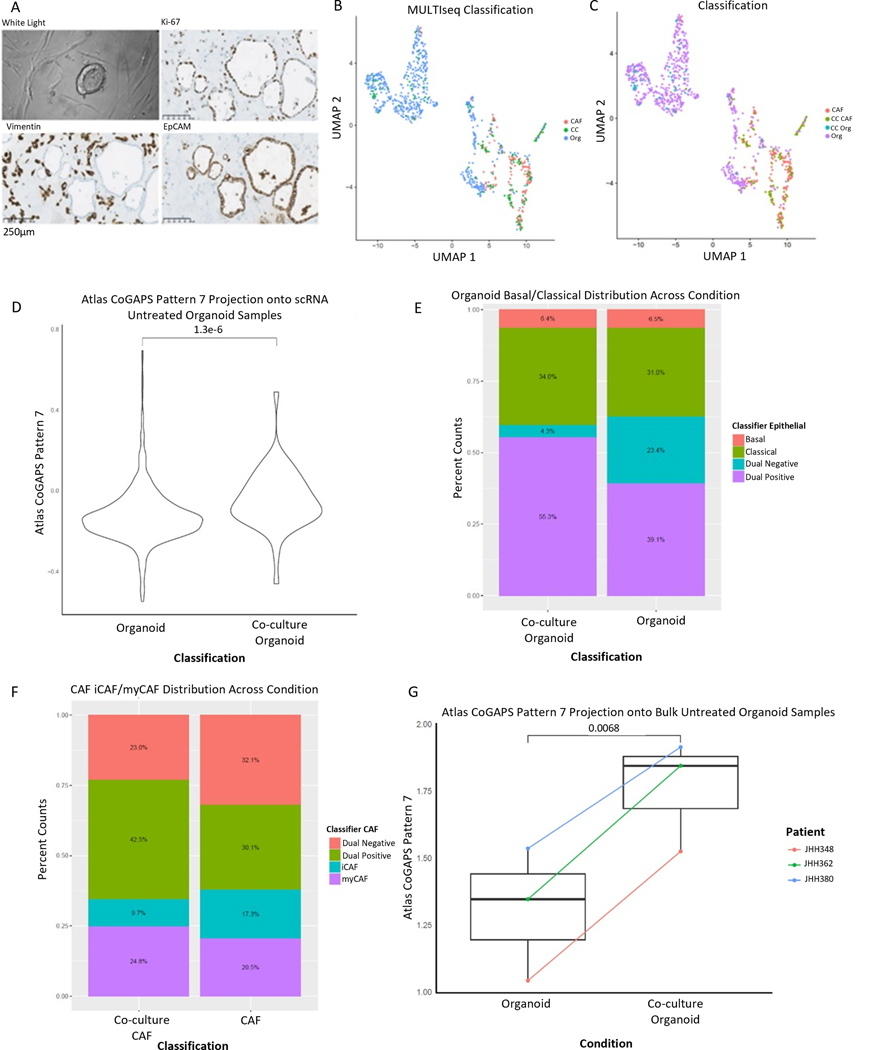
Pancreatic ductal adenocarcinoma (PDAC) is an aggressive malignancy characterized by an immunosuppressive tumor microenvironment enriched with cancer-associated fibroblasts (CAF). This study used a convergence approach to identify tumor cell and CAF interactions through the integration of single-cell data from human tumors with human organoid coculture experiments. Analysis of a comprehensive atlas of PDAC single-cell RNA sequencing data indicated that CAF density is associated with increased inflammation and epithelial-mesenchymal transition (EMT) in epithelial cells. Transfer learning using transcriptional data from patient-derived organoid and CAF cocultures provided in silico validation of CAF induction of inflammatory and EMT epithelial cell states. Further experimental validation in cocultures demonstrated integrin beta 1 (ITGB1) and vascular endothelial factor A (VEGFA) interactions with neuropilin-1 mediating CAF-epithelial cell cross-talk. Together, this study introduces transfer learning from human single-cell data to organoid coculture analyses for experimental validation of discoveries of cell-cell cross-talk and identifies fibroblast-mediated regulation of EMT and inflammation.

Significance: Adaptation of transfer learning to relate human single-cell RNA sequencing data to organoid-CAF cocultures facilitates discovery of human pancreatic cancer intercellular interactions and uncovers cross-talk between CAFs and tumor cells through VEGFA and ITGB1.


Conflict of interest statement

T.T.S. is the CEO and co-owner of Healthfund Finland and reports consultation fees from Boehringer Ingelheim Finland and Amgen. E.M.J is a paid consultant for Adaptive Biotech, Achilles, DragonFly, Candel Therapeutics, Genocea, and Roche. She receives funding from Lustgarten Foundation and Bristol Myer Squibb. She is the Chief Medical Advisor for Lustgarten and SAB advisor to the Parker Institute for Cancer Immunotherapy (PICI) and for the C3 Cancer Institute. She is a founding member of Abmeta. E.J.F is on the SAB for Resistance Biology, Consultant for Mestag Therapeutics and Merck. D.T.T. has received consulting fees from ROME Therapeutics, Tekla Capital, Ikena Oncology, Foundation Medicine, Inc., NanoString Technologies, and Pfizer that are not related to this work. D.T.T. is a founder and has equity in ROME Therapeutics, PanTher Therapeutics and TellBio, Inc., which is not related to this work. D.T.T. receives research support from ACD-Biotechne, PureTech Health LLC, and Ribon Therapeutics, which was not used in this work. D.T.T.’s interests were reviewed and are managed by Massachusetts General Hospital and Mass General Brigham in accordance with their conflict of interest policies. L.Z. reports personal fees from Biosion, Alphamab, NovaRock, Xilio, Ambrx, Novagenesis, and Snow Lake Capitals; and other support from Alphamab and Mingruizhiyao outside the submitted work. A.C.K. reports support from Vescor Therapeutics, Rafael Pharma, and AbbVie outside the submitted work; in addition, A.C.K. has a patent for targeting alanine transport pending, a patent for KRAS-regulated metabolic pathways issued, a patent for targeting GOT1 as a therapeutic approach issued, and a patent for autophagy control of iron metabolism issued. D.P.R. reports personal fees and other support from MPM, other support from Boehringer Ingelheim and Exact Sciences, and personal fees from UpToDate and McGraw Hill outside the submitted work. J.W.Z. reports grant funding from Genentch outside the submitted work.

Competing interests:

All other authors declare no potential conflict of interest.

Figures

Figure 1.
Figure 1.
Summary of atlas composition. (A) Complete atlas with assigned cell types. (B) Heatmap of differentially expressed genes used for cell type annotations. (C) Relative contribution of the 77 different samples with 140,250 cells, separated by tumor (below line) and control tissue (above line). (D) Mean number of cells per tissue by dataset origin. (E) Cell mapping by dataset origin from the six manuscripts in the complete atlas.
Figure 2.
Figure 2.
Identification of Pattern 7 and cell type distribution in the atlas. (A) Complete atlas subset of the epithelial cell populations from the Peng et al(11) and Steele et al(10) data with assigned weights of Pattern 7 as resulting from CoGAPS analyses. (B) Boxplot of Pattern 7 weights within the Epithelial, benign cell population demonstrating differences between control and tumor pancreas tissues. p < 2.22 e-16, generated by Wilcoxon test. (C) Overrepresented MSigDB hallmark gene sets in cells expressing Pattern 7 genes. (D) Cell mapping by tumor vs. control pancreas tissue in the complete atlas. (E) Differences in cell type composition for selected tumor vs. control pancreas tissues originating from Peng et al(11) and Steele et al(10).
Figure 3.
Figure 3.
Patient-derived organoids co-cultured with CAFs recapitulate the Pattern 7 identified in tumor epithelial cells and demonstrate dynamic cellular phenotypes. (A) Representative brightfield image of co-culture. Representative IHC of co-culture demonstrating proliferation by Ki-67 after co-culture (top right), vimentin positive CAFs (bottom left), and EpCAM positive organoids (bottom right). Images obtained at 20x magnification; scale bars represent 250μm. (B) UMAP demonstrating culture conditions: organoid monoculture (Org), CAF monoculture (CAF), co-culture (CC). (C) UMAP demonstrating cell-type calls after co-culture: Organoid monoculture (Org), CAF monoculture (CAF), CAFs from co-culture (CC CAF), organoids from co-culture (CC Org). (D) Pattern 7 was enhanced in organoid cells from co-culture relative to organoid cells from monoculture, p=1.3e-6 by Wilcoxon. (E) Co-culture demonstrates plasticity in epithelial representation in the co-culture condition with a greater percentage of cells representing both basal and classical markers (dual positive) present in co-culture. (F) Co-culture demonstrates plasticity in CAF representation in the co-culture condition with a greater percentage of cells representing both iCAF and myCAF markers (dual positive) present in co-culture. (G) Pattern 7 is enhanced in bulk RNA-seq after co-culture, p=0.0068 by paired T-test.
Figure 4.
Figure 4.
Domino evaluation of intercellular interactions in the atlas with PDO-CAF co-culture. (A) Signaling network between epithelial and CAF subpopulations from tumor pancreas tissues in the Peng et al(10) dataset as derived from the Domino R package. Nodes of the subpopulations are sized according to the amounts of expressed targeting ligands. The thicknesses of the intercellular connections are scaled based on the strength of signaling with their color indicating the signals’ origin (directionality). (B) Heatmap plotting mean normalized expression of each ligand for each group, demonstrating ITGB1 as a ligand originating in the CAF populations with the epithelial cells receiving this signal from the Peng et al(10) dataset. (C) ITGB1 expression in human PDAC tissue shown first as H&E stain at 5X magnification with focused section at 40X magnification from H&E and ITGB1 IHC with hematoxylin nuclear stain. H&E and IHC completed on sequentially cut slides. (D) Schema demonstrating the workflow for co-culture setup and disassembly with flow sort prior to qPCR. (E) ITGB1 expression in monoculture and co-culture CAFs and epithelial cells after 24 or 96 hours of co-culture. Plotted are the Fold Change values comparing our PDO co-culture to monoculture using GAPDH as an endogenous control. Comparisons of monoculture and co-culture conditions are statistically supported using the two-tailed students t-test with equal variance in PRISM (V9.2.0 [283]). Significance is measured as: ****, p<0.0001; ***, p<0.001; **, p<0.01; *, p<0.05; ns, not significant. Panel D created with BioRender.com
Figure 5.
Figure 5.
Domino evaluation of intercellular interactions through VEGF-A with PDO-CAF co-culture validation. (A) Heatmap plotting mean normalized expression of each ligand for each group, demonstrating VEGF-A as a ligand originating in the epithelial populations with the CAFs receiving this signal from the Peng(10) dataset. (B) VEGF-A expression in human PDAC tissue shown first as H&E stain at 5X magnification with focused section at 40X magnification from H&E and VEGF-A IHC with hematoxylin nuclear stain. H&E and IHC completed on sequentially cut slides. (C) Differential expression by qPCR of VEGF-A in monoculture and co-culture CAFs and epithelial cells after 24 or 96 hours of co-culture. Plotted are the Fold Change values comparing our PDO co-culture to monoculture using GAPDH as an endogenous control. (D) VEGF concentration on ELISA of monoculture and co-culture. N=7 PDO-CAF cultures from 7 distinct patients. (E) Angiogenesis assay in HUVEC cells cultured in organoid, CAF, or co-culture conditioned media (CM). Top: transillumination at 4X magnification after 8 hours in culture. Bottom Left: Quantification of segment length of HUVEC networks following culture for 8 hours with increased segment length after culture in CAF CM with trend towards increased segment length in co-culture CM. Bottom Right: Quantification of Nodes in angiogenesis assay after 8 hours in culture. (F) Representative flow cytometry contour plots examining VEGFR1 and VEGFR2 surface expression in CAF (top) and PDO (bottom) monoculture or co-culture. (G) Quantification of CAF (top) VEGFR1 and VEGF2 percent positive, PDO (middle) percent positive VEGFR1 and VEGFR2 and PDO (bottom) Median Fluorescence Intensity expression in monoculture and co-culture across 5 patients. Colored circles on bar graphs correspond to distinct PDOs across experimental conditions. Comparisons of monoculture and co-culture conditions are statistically supported using the two-tailed students t-test with equal variance in PRISM (V9.2.0 [283]). Significance is measured as: ****, p<0.0001; ***, p<0.001; **, p<0.01; *, p<0.05; ns, not significant.
Figure 6.
Figure 6.
NRP1 is an inferred binding partner for VEGF-A and overexpression has survival implications (A) Ligand-receptor interaction network between epithelial and CAF subpopulations from tumor pancreas tissues in the Peng et al(10) dataset as derived from the Domino R package. (B) Representative flow cytometry contour plots evaluation of NRP1 expression in CAF (top) and PDO (bottom) from co-culture and monoculture. Associated quantification in bar graphs on the right. (C) Left: Quantification of NRP1 expression on CAFs in monoculture and in co-culture with PDO, Right: Quantification of NRP1 expression on PDOs in monoculture and co-culture resulting in significant decrease of NRP1 after co-culture with CAFs (D) Representative H&E of human PDAC tumor at 5X and 40X with IHC with hematoxylin nuclear stain on sequential slides examining VEGF-A and NRP1 expression (N=3 patients). Quantification of NRP1 and VEGFA expression from 11 Regions of Interest (ROI) from JHH394 as determined by pathologist. Correlation statistics by simple linear regression. Comparisons of monoculture and co-culture conditions are statistically supported using the two-tailed students t-test with equal variance in PRISM (V9.2.0 [283]). Significance is measured as: ****, p<0.0001; ***, p<0.001; **, p<0.01; *, p<0.05; ns, not significant. (E) Proposed interaction of tumor epithelial cells and CAFs through VEGF-A and ITGB1 enriching epithelial cell inflammatory signaling and EMT. Panel E created with BioRender.com

References

    1. Ho WJ, Jaffee EM, Zheng L. The tumour microenvironment in pancreatic cancer - clinical challenges and opportunities. Nat Rev Clin Oncol. 2020. Sep;17(9):527–40. - PMC - PubMed
    1. Peran I, Madhavan S, Byers SW, McCoy MD. Curation of the Pancreatic Ductal Adenocarcinoma Subset of the Cancer Genome Atlas Is Essential for Accurate Conclusions about Survival-Related Molecular Mechanisms. Clin Cancer Res. 2018. Aug 15;24(16):3813–9. - PubMed
    1. Chen K, Wang Q, Li M, Guo H, Liu W, Wang F, et al. Single-cell RNA-seq reveals dynamic change in tumor microenvironment during pancreatic ductal adenocarcinoma malignant progression. EBioMedicine. 2021. Apr;66:103315. - PMC - PubMed
    1. Hosein AN, Huang H, Wang Z, Parmar K, Du W, Huang J, et al. Cellular heterogeneity during mouse pancreatic ductal adenocarcinoma progression at single-cell resolution. JCI Insight [Internet]. 2019. Jul 23;5(16). Available from: 10.1172/jci.insight.129212 - DOI - PMC - PubMed
    1. Carstens JL, Yang S, Correa de Sampaio P, Zheng X, Barua S, McAndrews KM, et al. Stabilized epithelial phenotype of cancer cells in primary tumors leads to increased colonization of liver metastasis in pancreatic cancer. Cell Rep. 2021. Apr 13;35(2):108990. - PMC - PubMed

Publication types

MeSH terms