. 2024 Apr 16;121(16):e2317783121.
doi: 10.1073/pnas.2317783121. Epub 2024 Apr 8.

Developmental trajectories of GABAergic cortical interneurons are sequentially modulated by dynamic FoxG1 expression levels

Affiliations

Developmental trajectories of GABAergic cortical interneurons are sequentially modulated by dynamic FoxG1 expression levels

Goichi Miyoshi et al. Proc Natl Acad Sci U S A. .

Abstract

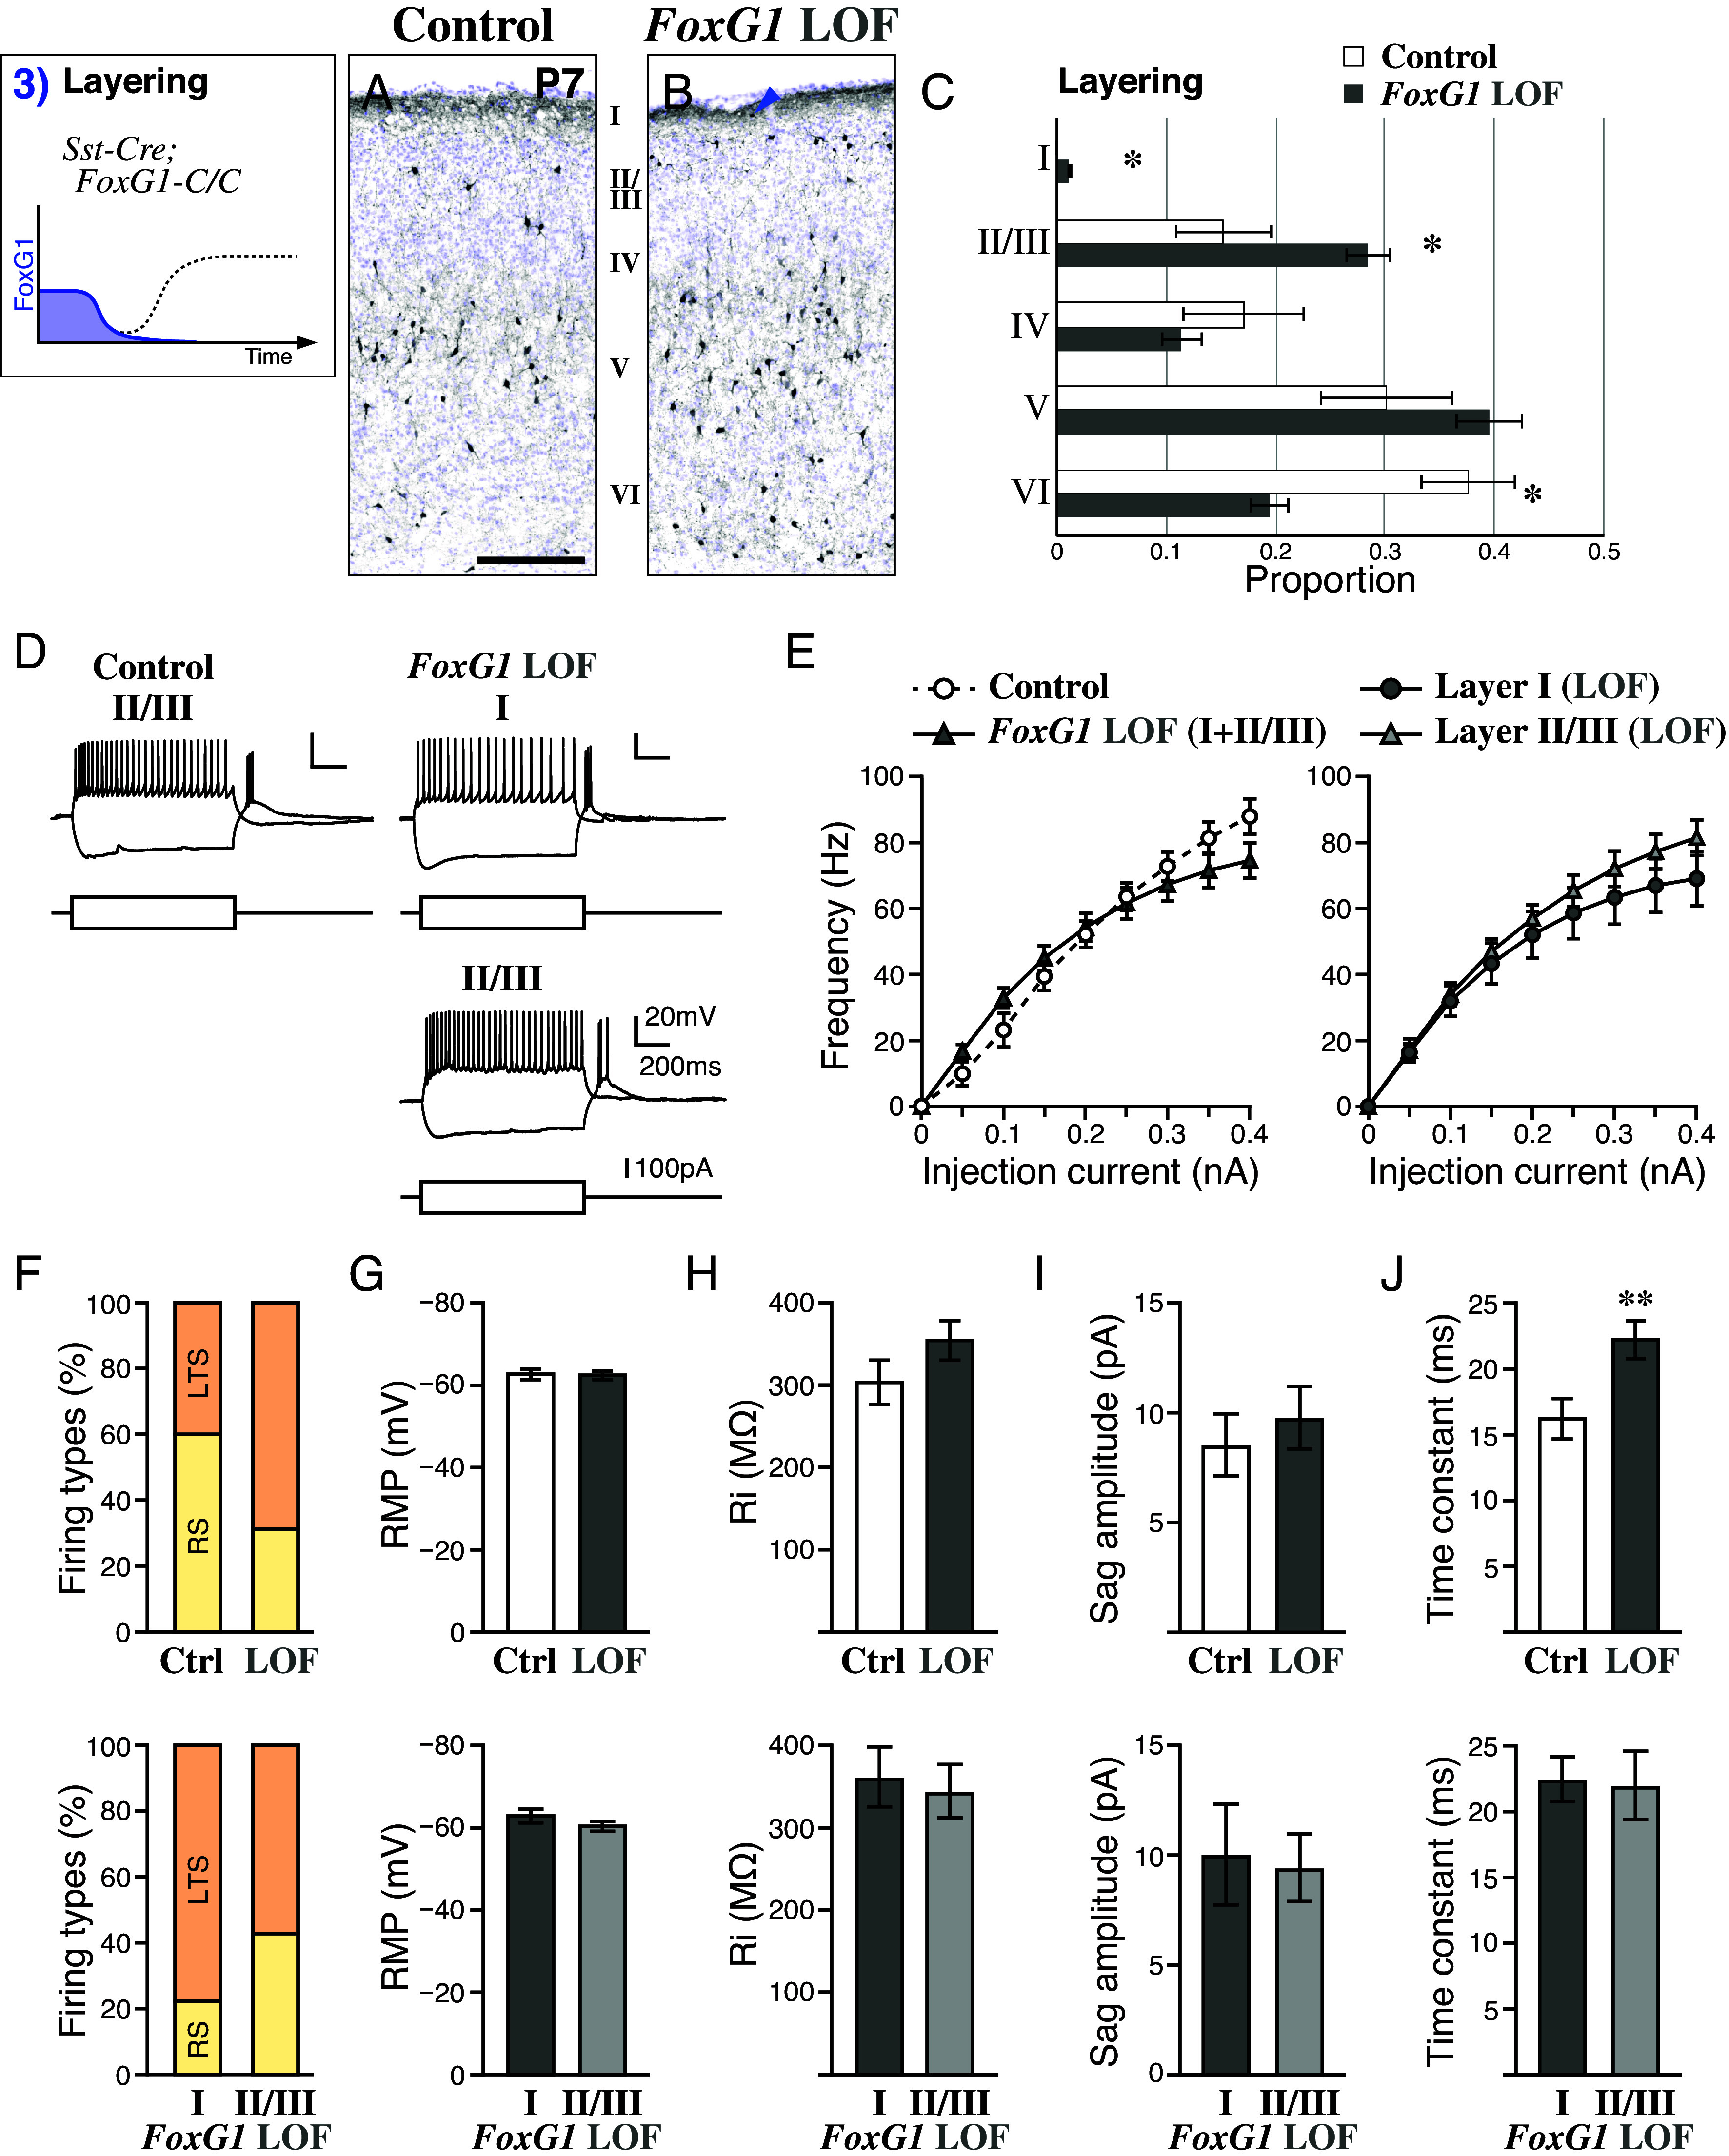
GABAergic inhibitory interneurons, originating from the embryonic ventral forebrain territories, traverse a convoluted migratory path to reach the neocortex. These interneuron precursors undergo sequential phases of tangential and radial migration before settling into specific laminae during differentiation. Here, we show that the developmental trajectory of FoxG1 expression is dynamically controlled in these interneuron precursors at critical junctures of migration. By utilizing mouse genetic strategies, we elucidate the pivotal role of precise changes in FoxG1 expression levels during interneuron specification and migration. Our findings underscore the gene dosage-dependent function of FoxG1, aligning with clinical observations of FOXG1 haploinsufficiency and duplication in syndromic forms of autism spectrum disorders. In conclusion, our results reveal the finely tuned developmental clock governing cortical interneuron development, driven by temporal dynamics and the dose-dependent actions of FoxG1.

Keywords: cortex; development; gene-dosage; inhibitory neuron; interneuron.


Conflict of interest statement

Competing interests statement:The authors declare no competing interest.

Figures

Fig. 1.
Fig. 1.
FoxG1 expression is tightly correlated with the differentiation and migratory stages of GABAergic neuronal precursors. (AN) GABAergic neuronal precursors are labeled in red using Dlx5a-Cre; R26-stop-tdTomato (Ai9) fate mapping, with FoxG1 immunohistochemistry shown in blue. (A and B) Anterior and posterior coronal sections of the mouse forebrain at E14.5. Medium levels of FoxG1 expression in postmitotic GABAergic neuron precursors (A’, Med) are evident (C, C’, and D, arrowheads). (E and E’) Higher magnification of the E14.5 cortical region outlined in A’. Within GABAergic neuronal precursors (red), FoxG1 expression (blue) is very low in the intermediate zone and is almost invisible in the marginal zone (E and E’, open arrowheads). However, FoxG1 is expressed at high levels in pyramidal neuron precursors in the cortical plate. Higher magnification of the marginal (F) and intermediate (G) zones in E. (HK) At E18.5, while GABAergic cells in the marginal zone (I) and cortical plate (J) express FoxG1, the ones in the SVZ/VZ do not express at comparable levels (K, open arrowheads). (LN) At P3, many GABAergic neuron precursors are undergoing radial migration and have reexpressed FoxG1. High magnification of the squared areas in L is shown in M and N. (O) A schematic drawing depicting the high, medium, and low phases of FoxG1 expression (blue) in developing cortical GABAergic interneurons (red) originating from the ventral forebrain. Each figure represents the analysis of three brains. MGE, LGE, and CGE: medial, lateral, and caudal ganglionic eminence, Ctx: cortex, HC: hippocampus, Th: thalamus, MZ: marginal zone, CP: cortical plate, IZ: intermediate zone, SVZ/VZ: subventricular/ventricular zone, WM: white matter. (Scale bars: A and B 200 µm and CN 50 µm.)
Fig. 2.
Fig. 2.
FoxG1 is cell autonomously required to establish GABAergic neuronal identity but is not required for its maintenance. (AD) A cell-autonomous role of FoxG1 was analyzed by mosaic LOF (schemes on the Top) by combining R26-CreER and conditional FoxG1 alleles and by activating CreER with tamoxifen administration. (A and B). Compared to the E11.5 control tissue (A, FoxG1-C/+) and neighboring control cells (B, FoxG1-C/C without homozygous recombination) with FoxG1 expression (green), LOF cells (no green signals, FoxG1-C/C with recombination) failed to express Nkx2-1 (B and B’) upon E8.5 tamoxifen administration. In the neighboring section of B’, Pax6 expression was complementary to Nkx2-1 (C), indicating that FoxG1 is cell autonomously required to acquire ventral GABAergic identity. When similar mosaic LOF was carried out 1 d later at E9.5, some FoxG1-null cells similarly failed to express Nkx2-1 (D and D’, open arrowheads), but some did not (arrowheads). (EL) In order to test the roles of FoxG1 in cells which have already expressed Nkx2-1, Nkx2-1BAC-Cre-mediated FoxG1 LOF was carried out, and adjacent sections were compared (E and F, compare the filled and open arrowheads). In the ventral MGE progenitor domain, no obvious change in Nkx2-1 expression was observed in the FoxG1 LOF territories compared to the control (G and H, arrowheads). Consistent with this notion, Pax6 expression was not changed in these domains (I and J, open arrowheads). The proneural gene Ascl1 (Mash1), which shows ventral-specific expression during early telencephalic development, is also not changed in the Cre-recombined domains (K and L, arrowheads), although the VZ/SVZ (marked by Ascl1 expression) is thinner in the FoxG1 LOF compared to the control due to decreased cell proliferation. Each figure represents the analysis of three brains. Ctx: cortex, HC: hippocampus, Th: thalamus, MGE: medial ganglionic eminence. (Scale bars: 200 µm.)
Fig. 3.
Fig. 3.
GABAergic neuron precursors require FoxG1 expression to enter into the striatum and the neocortex. (AL) FoxG1 LOF during the 1st phase (Left scheme, Fig. 1O) by using a Nkx2-1BAC-Cre transgenic driver prevents reporter-labeled GABAergic cells from entering the hippocampus, cortex, and striatum at E14.5 (A and B) and also later at E18.5 (C and D). (EH) The FoxG1 LOF cells remaining in the vicinity of the MGE still retained expression of Lhx6 (E and F arrowheads), a downstream target of Nkx2-1. However, these LOF cells significantly down-regulated the expression of ErbB4 (G arrowhead and H open arrowhead), a transmembrane receptor that is critically required for MGE-derived cells to migrate into the cortex. (IL) Fluorescent images of figures C and D with Nkx2-1 expression (K and L) and rostral forebrain regions (I and J). Even in anterior forebrain regions, FoxG1 LOF cells are not able to enter into the cortex and the striatum (I and J). The globus pallidus (GP) is a structure located medially to the striatum (Str) that normally maintains Nkx2-1 expression into mature stages (K, GP). While the globus pallidus structure is largely absent in the FoxG1 LOF forebrain (L, open arrowhead), a population strongly maintaining Nkx2-1 can be found in anterior regions (J, asterisk), suggesting that FoxG1 is required for globus pallidus cell migration. (M and N) In order to characterize the migration of LGE-derived medium spiny neuron precursors (Left panel of M and N), Nestin-CreER driver and an EGFP reporter are combined in the conditional FoxG1 background, and tamoxifen administration was carried out at E11.5. The control EGFP-labeled cells born after E11.5 and coexpressing Ctip2 successfully entered into the striatal domain (M, arrowhead) and relatively homogeneously intermingled with Ctip2 non-EGFP cells, most of which are likely born prior to E11.5. However, FoxG1 LOF cells labeled with both EGFP and Ctip2 failed to mix with Ctip2/non-EGFP cells (N, open arrowhead), indicating that FoxG1 is required for LGE-derived medium spiny cells to migrate within the striatum. Each figure represents the analysis of three brains. (Scale bars: 200 µm.)
Fig. 4.
Fig. 4.
GABAergic neuron precursors require FoxG1 downregulation to maintain tangential migration and to reach distant cortical territories including the hippocampus. FoxG1 GOF was carried out (Dlx-Cre; R26-stop-tTA; TRE-FoxG1), and recombined cells were visualized with tdTomato (Ai9 reporter) during the 2nd phase (Left scheme, Fig. 1O) of GABAergic interneuron migration. Control littermates do not carry the TRE-FoxG1 allele. (A and B) No clear difference was observed in the E14.5 cortex between control and FoxG1 GOF experiments. (C and D) Distribution of FoxG1 GOF cells was analyzed at P7. Higher-magnification views of the white matter (WM) and layer 1 (LI) in C and D are shown in C’ and D’. FoxG1 GOF resulted in reduced interneuron numbers in the hippocampus (HC) and the medial cortex (Ctx, asterisk in D). Ectopically located GOF cells were found in the white matter and layer 1, particularly in the lateral part of the cortex (D and D’, arrowheads), corresponding to the major tangential migration routes (intermediate and marginal zones, respectively) at earlier time points (C and C’, open arrowheads). (E) Comparison of the labeled cell density in the hippocampus (HC), medial (retrosplenial), and lateral (barrel) part of the cortex (n = 3 each). Two-tailed t test: P = 0.00272**(HC), P = 0.0379*(medial), and P = 0.0992(lateral). (F) Bulk RNA sequencing analysis of FACS-purified cortical interneurons from five control and eight FoxG1 GOF brains revealed 5 increased and 22 decreased genes upon FoxG1 GOF (increased ×3.2) at E18.5. MZ: marginal zone, CP: cortical plate, IZ: intermediate zone, SVZ/VZ: subventricular/ventricular zone, WM: white matter, HC: hippocampus. (Scale bars: 50 µm.)
Fig. 5.
Fig. 5.
FoxG1 upregulation during radial migration is required for the positioning but not the maturation of interneuron precursors. FoxG1 LOF was carried out during tangential migration prior to the 3rd phase (Fig. 1O) by using a Sst-Cre driver. Control (Sst-Cre; FoxG1-C/+) and FoxG1 LOF (Sst-Cre; FoxG1-C/C) cells were compared. Approximately 30% of cortical interneurons are Sst positive, and they mostly occupy deep layers (A). At P7, the positions of LOF cells were shifted more superficially (B and C), and some were ectopically located in layer 1 (B, arrowhead). Error bars are ± SEM, two-tailed t test: P = 0.0127*(I), P = 0.0376*(II/III), P = 0.269 (IV), P = 0.0880(V), P = 0.0366*(VI). (DJ) Intrinsic electrophysiological properties of FoxG1 LOF cells were analyzed. For this, tdTomato-labeled cells (Ai9) at postnatal 3 wk were compared by whole-cell patch clamp analysis in acute brain slices. (D) Responses to depolarizing or hyperpolarizing current injection of Sst interneurons in the superficial layers of the S1 barrel field. Similar to control layer 2/3 Sst interneurons, FoxG1 LOF cells in layer 2/3 as well as the ones ectopically located in layer 1 showed low threshold spike (LTS) firing properties. (E) Frequency–current relationships were found to be similar between control (n = 10) and FoxG1 LOF (n = 16) Sst interneurons (E, Left). Ectopically located layer 1 (n = 9) and layer 2/3 (n = 7) FoxG1 LOF cells were both indistinguishable from the wild type (E, Right). (FJ) Intrinsic firing properties of Sst interneurons were found to be largely unaffected by FoxG1 LOF. (Top) Data comparing control vs. FoxG1 LOF, and (Bottom) data comparing layer 1 vs. layer 2/3 FoxG1 LOF interneurons. (F) Intrinsic firing properties of Sst interneurons, which show either LTS or regular spiking (RS) features. The proportion of LTS and RS Sst types was similar between control vs. FoxG1 LOF (F, Top) and L1 vs. L2/3 FoxG1 LOF cells (F, Bottom; not significant by Chi-square test). While resting membrane potential (RMP, G, Top), input resistance (Ri, H, Top) and voltage sag amplitude in response to a hyperpolarizing current injection (−0.2 nA, 1 s) were indistinguishable (I, Top), FoxG1 LOF cells exhibited a longer time constant compared to control Sst interneurons (P < 0.01, Welch’s t test) (J, Top). Note that FoxG1 LOF interneurons in layers 1 and 2/3 have similar intrinsic electrophysiological properties (GJ, Bottom). (Scale bars: 50 µm.)
Fig. 6.
Fig. 6.
FoxG1 functions in a gene dosage–dependent manner in forebrain patterning. Control (homozygous for floxed conditional allele), heterozygous (floxed allele/LacZ knock-in null), hypomorphic (floxed allele with a Neo cassette remaining in downstream 3′UTR/LacZ knock-in null), and null (floxed allele/Cre knock-in null) brains were compared at E12.5. Immunohistochemistry is shown for Pax6 (AD) and Nkx2-1 (A’D’), with nuclear counterstaining (DAPI) in blue. As FoxG1 gene dosage decreases (top scheme), the Nkx2-1 positive domain disappears between the heterozygous (B’) and hypomorphic (C’) models. Refer to SI Appendix, Supplementary Figure for the FoxG1 +/+ and +/− genotypes. (Scale bars: 200 µm.)

References

    1. Hansen D. V., et al. , Non-epithelial stem cells and cortical interneuron production in the human ganglionic eminences. Nat. Neurosci. 16, 1576–1587 (2013). - PMC - PubMed
    1. Ma T., et al. , Subcortical origins of human and monkey neocortical interneurons. Nat. Neurosci. 16, 1588–1597 (2013). - PubMed
    1. Anderson S. A., Eisenstat D. D., Shi L., Rubenstein J. L., Interneuron migration from basal forebrain to neocortex: Dependence on Dlx genes. Science 278, 474–476 (1997). - PubMed
    1. Rakic P., Neurons in rhesus monkey visual cortex: Systematic relation between time of origin and eventual disposition. Science 183, 425–427 (1974). - PubMed
    1. Angevine J. B. J., Sidman R. L., Autoradiographic study of cell migration during histogenesis of cerebral cortex in the mouse. Nature 192, 766–768 (1961). - PubMed

LinkOut - more resources