. 2024 May;629(8013):927-936.
doi: 10.1038/s41586-024-07379-z. Epub 2024 Apr 8.

Tumour-selective activity of RAS-GTP inhibition in pancreatic cancer

Urszula N Wasko #  1   2 Jingjing Jiang #  3 Tanner C Dalton  1   2 Alvaro Curiel-Garcia  1   2 A Cole Edwards  4 Yingyun Wang  3 Bianca Lee  3 Margo Orlen  5 Sha Tian  6 Clint A Stalnecker  7   8 Kristina Drizyte-Miller  7 Marie Menard  3 Julien Dilly  9   10 Stephen A Sastra  1   2 Carmine F Palermo  1   2 Marie C Hasselluhn  1   2 Amanda R Decker-Farrell  1   2 Stephanie Chang  3 Lingyan Jiang  3 Xing Wei  3 Yu C Yang  3 Ciara Helland  3 Haley Courtney  3 Yevgeniy Gindin  3 Karl Muonio  3 Ruiping Zhao  3 Samantha B Kemp  5 Cynthia Clendenin  11 Rina Sor  11 William P Vostrejs  5 Priya S Hibshman  4 Amber M Amparo  7 Connor Hennessey  9   10 Matthew G Rees  12 Melissa M Ronan  12 Jennifer A Roth  12 Jens Brodbeck  3 Lorenzo Tomassoni  2   13 Basil Bakir  1   2 Nicholas D Socci  14 Laura E Herring  15 Natalie K Barker  15 Junning Wang  9   10 James M Cleary  9   10 Brian M Wolpin  9   10 John A Chabot  16 Michael D Kluger  16 Gulam A Manji  1   2 Kenneth Y Tsai  17   18 Miroslav Sekulic  19 Stephen M Lagana  19 Andrea Califano  1   2   13   20   21   22   23   24 Elsa Quintana  3 Zhengping Wang  3 Jacqueline A M Smith  3 Matthew Holderfield  3 David Wildes  3 Scott W Lowe  6   25 Michael A Badgley  1   2 Andrew J Aguirre  9   10   12   26 Robert H Vonderheide  5   11   27 Ben Z Stanger  5   11 Timour Baslan  28 Channing J Der  7   8 Mallika Singh  29 Kenneth P Olive  30   31
Affiliations

Tumour-selective activity of RAS-GTP inhibition in pancreatic cancer

Urszula N Wasko et al. Nature. 2024 May.

Erratum in

  • Author Correction: Tumour-selective activity of RAS-GTP inhibition in pancreatic cancer.
    Wasko UN, Jiang J, Dalton TC, Curiel-Garcia A, Edwards AC, Wang Y, Lee B, Orlen M, Tian S, Stalnecker CA, Drizyte-Miller K, Menard M, Dilly J, Sastra SA, Palermo CF, Hasselluhn MC, Decker-Farrell AR, Chang S, Jiang L, Wei X, Yang YC, Helland C, Courtney H, Gindin Y, Muonio K, Zhao R, Kemp SB, Clendenin C, Sor R, Vostrejs WP, Hibshman PS, Amparo AM, Hennessey C, Rees MG, Ronan MM, Roth JA, Brodbeck J, Tomassoni L, Bakir B, Socci ND, Herring LE, Barker NK, Wang J, Cleary JM, Wolpin BM, Chabot JA, Kluger MD, Manji GA, Tsai KY, Sekulic M, Lagana SM, Califano A, Quintana E, Wang Z, Smith JAM, Holderfield M, Wildes D, Lowe SW, Badgley MA, Aguirre AJ, Vonderheide RH, Stanger BZ, Baslan T, Der CJ, Singh M, Olive KP. Wasko UN, et al. Nature. 2024 Nov;635(8040):E12. doi: 10.1038/s41586-024-08084-7. Nature. 2024. PMID: 39533066 Free PMC article. No abstract available.

Abstract

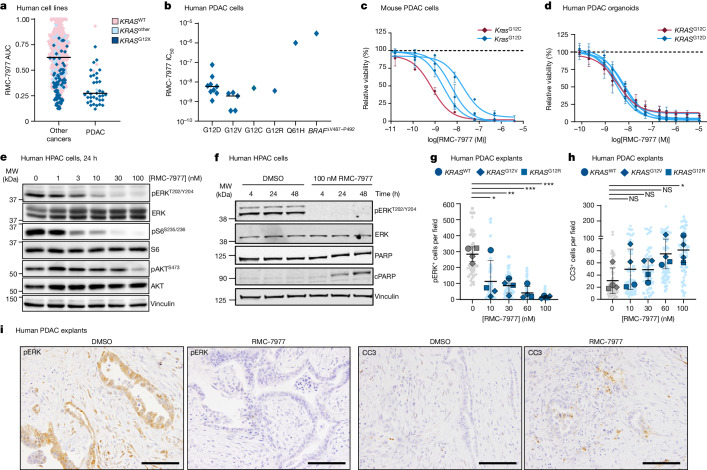
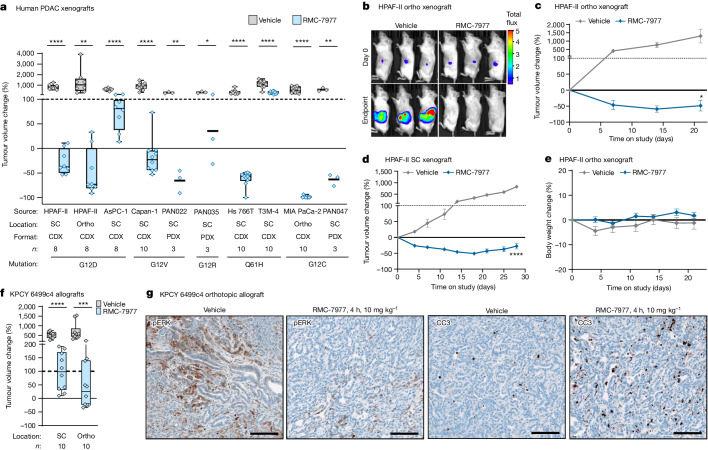
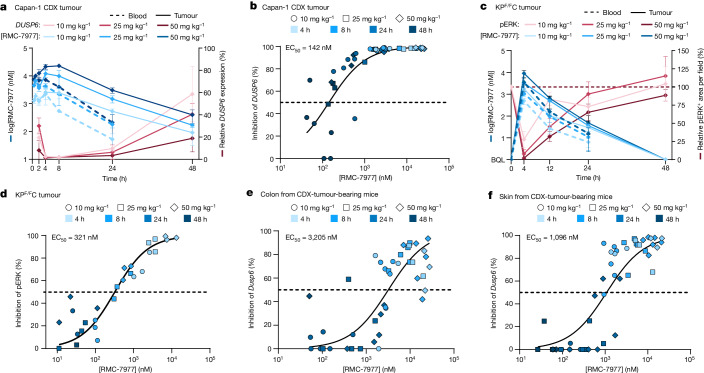
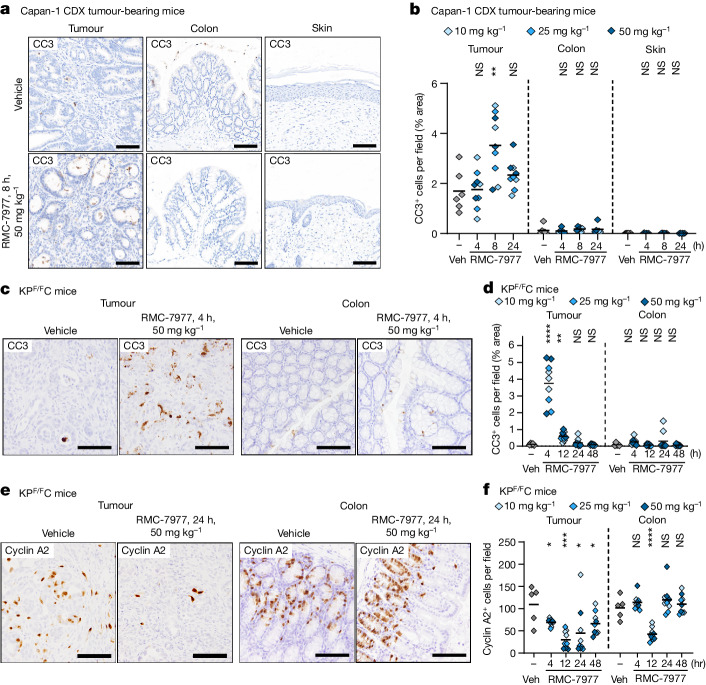
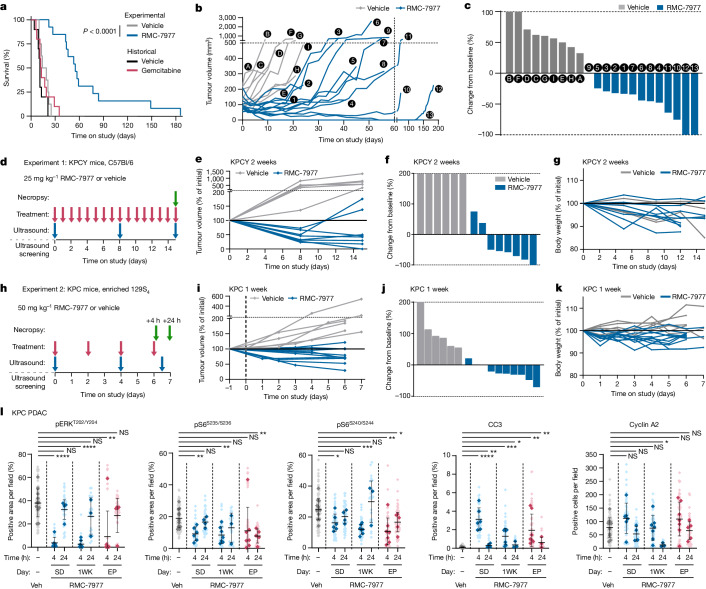
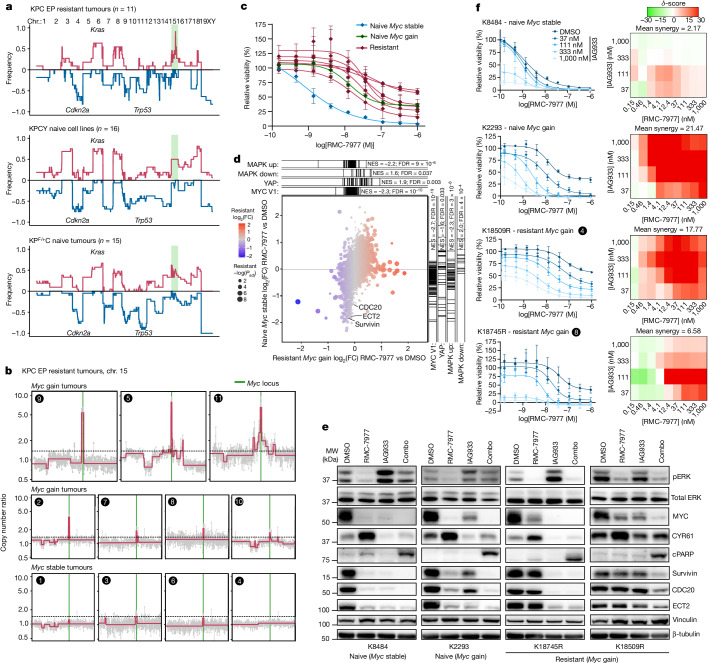
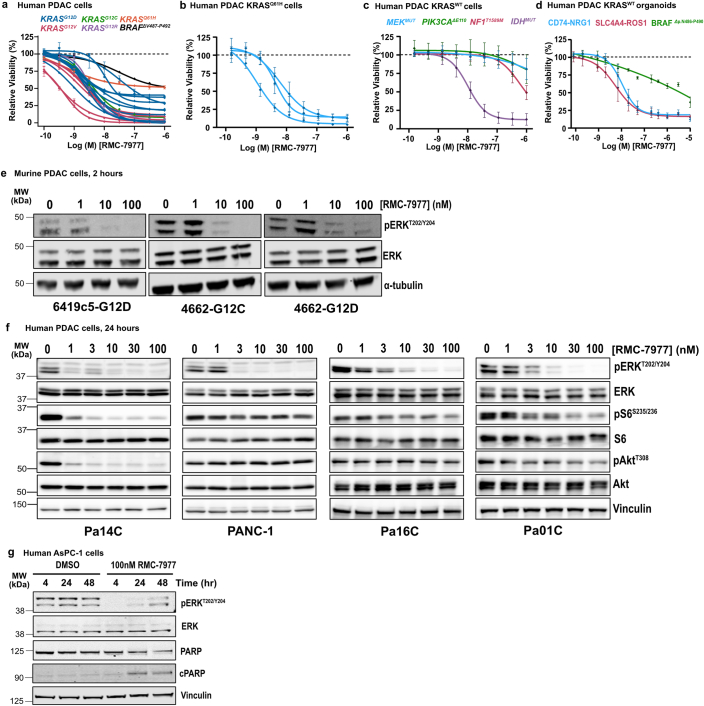
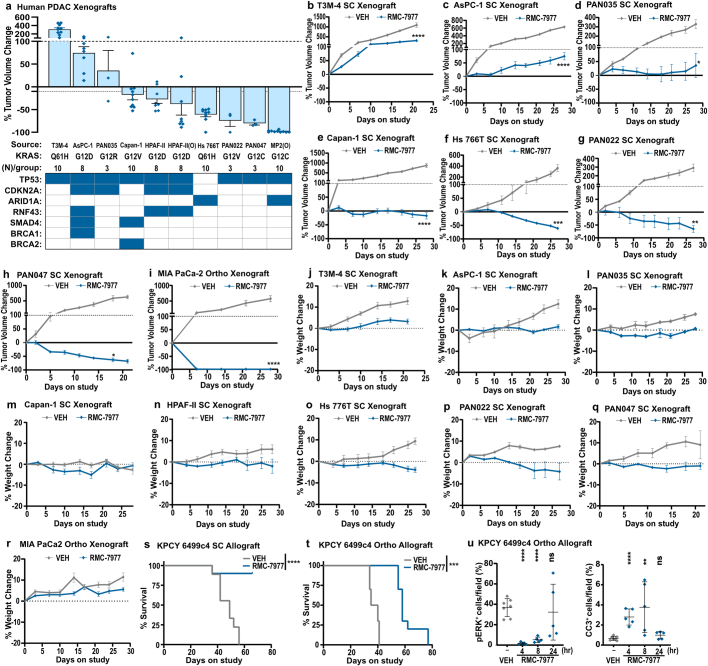
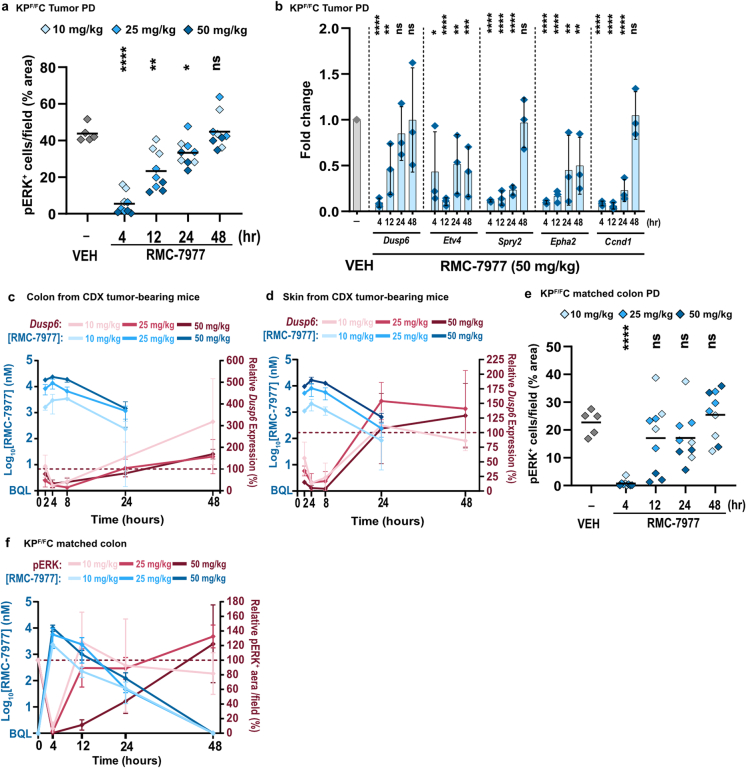
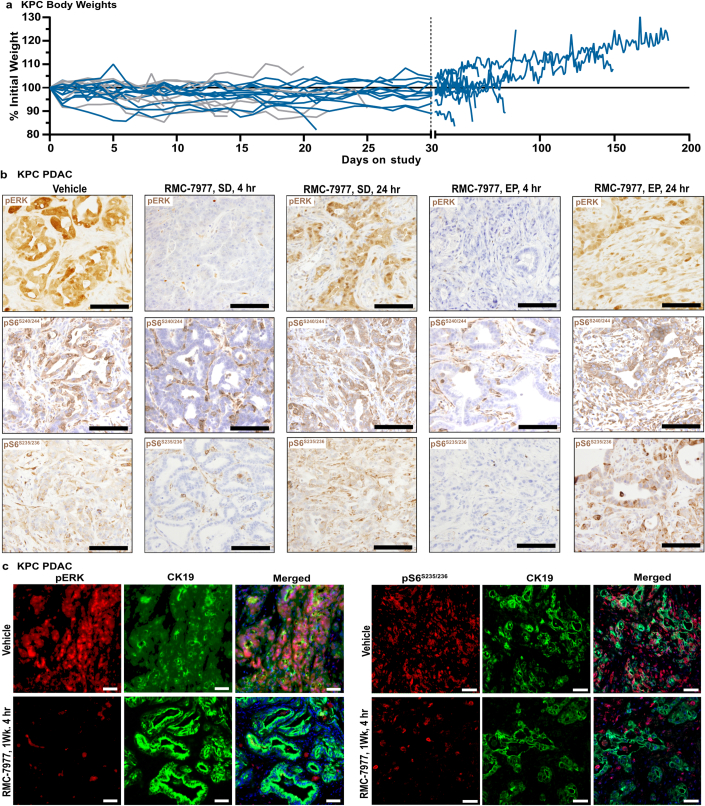
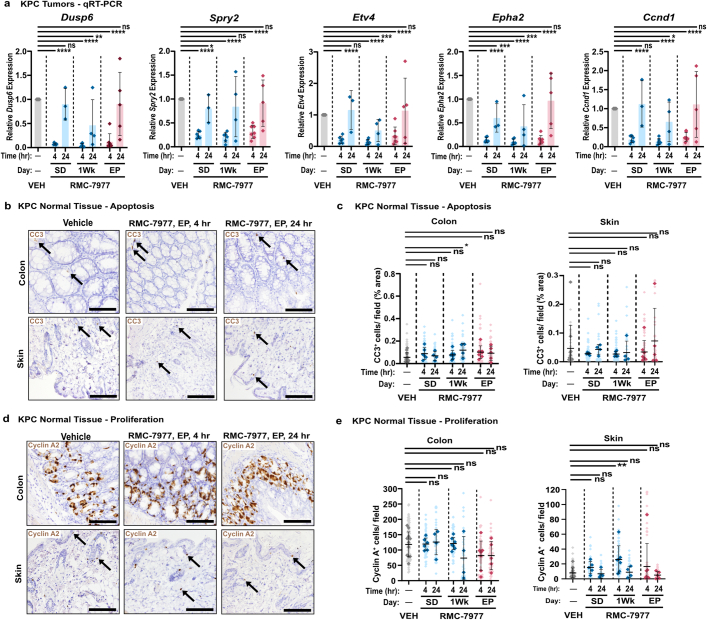
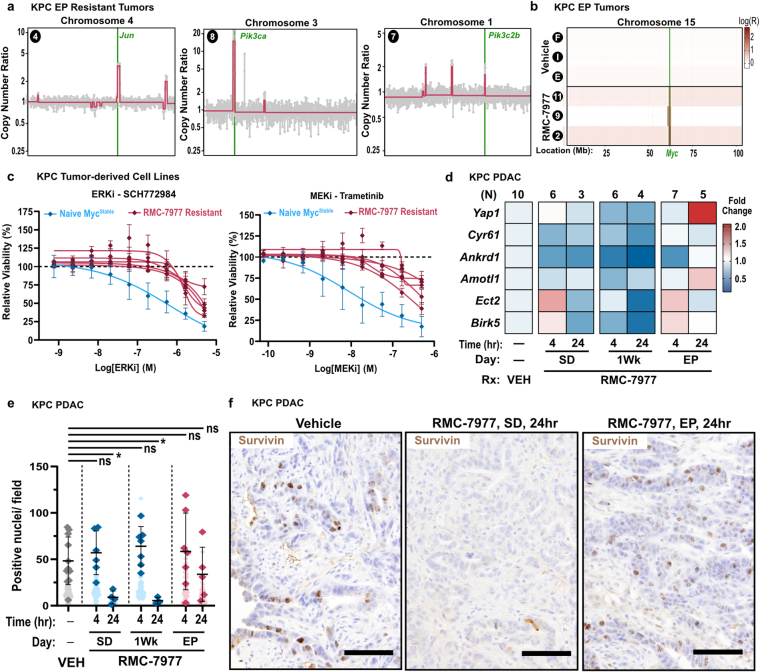
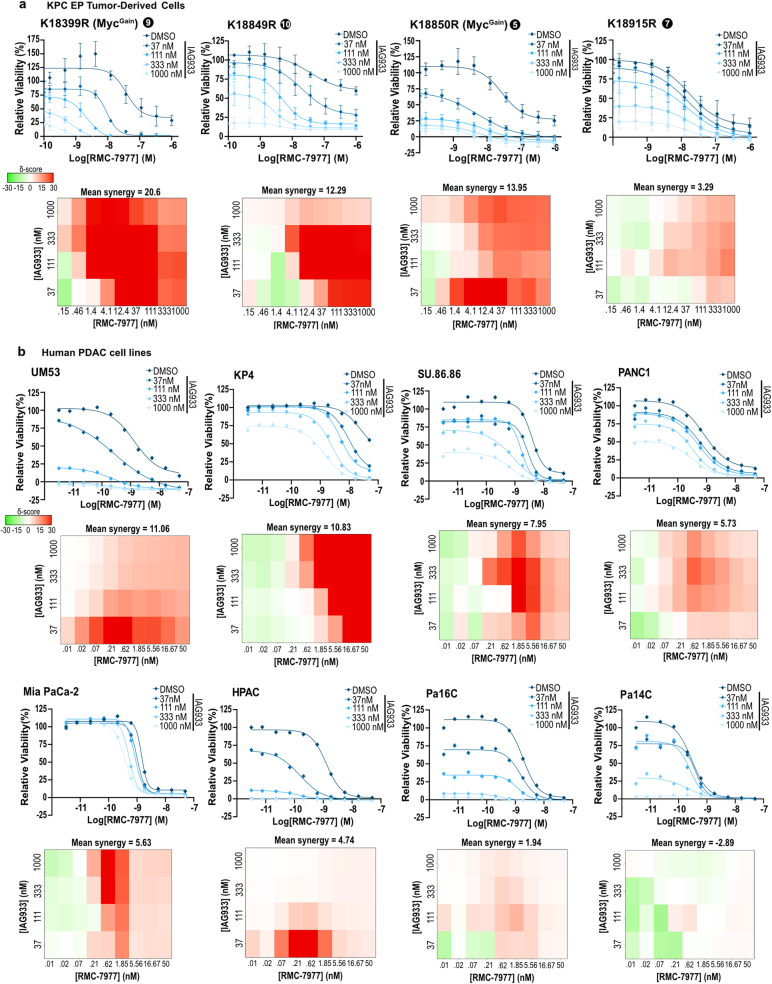
Broad-spectrum RAS inhibition has the potential to benefit roughly a quarter of human patients with cancer whose tumours are driven by RAS mutations1,2. RMC-7977 is a highly selective inhibitor of the active GTP-bound forms of KRAS, HRAS and NRAS, with affinity for both mutant and wild-type variants3. More than 90% of cases of human pancreatic ductal adenocarcinoma (PDAC) are driven by activating mutations in KRAS4. Here we assessed the therapeutic potential of RMC-7977 in a comprehensive range of PDAC models. We observed broad and pronounced anti-tumour activity across models following direct RAS inhibition at exposures that were well-tolerated in vivo. Pharmacological analyses revealed divergent responses to RMC-7977 in tumour versus normal tissues. Treated tumours exhibited waves of apoptosis along with sustained proliferative arrest, whereas normal tissues underwent only transient decreases in proliferation, with no evidence of apoptosis. In the autochthonous KPC mouse model, RMC-7977 treatment resulted in a profound extension of survival followed by on-treatment relapse. Analysis of relapsed tumours identified Myc copy number gain as a prevalent candidate resistance mechanism, which could be overcome by combinatorial TEAD inhibition in vitro. Together, these data establish a strong preclinical rationale for the use of broad-spectrum RAS-GTP inhibition in the setting of PDAC and identify a promising candidate combination therapeutic regimen to overcome monotherapy resistance.


Conflict of interest statement

J.J., Y.W., B.L., M.M., S.C., L.J., X.W., Y.C.Y., C. Helland, H.C., Y.G., K.M., R.Z., J.B., E.Q., Z.W., J.A.M.S., M.H., D.W. and M. Singh are employees and stockholders of Revolution Medicines. S.W.L., R.H.V., B.Z.S., A.J.A., C.J.D. and K.P.O. received research funding from Revolution Medicines. A.C. is founder, equity holder and consultant of DarwinHealth, a company that has licensed some of the algorithms used in this manuscript from Columbia University. Columbia University is also an equity holder in DarwinHealth. L.T. is an employee of DarwinHealth. J.M.C. receives research funding to his institution from Merus, Roche and Bristol Myers Squibb. He receives research support from Merck, AstraZeneca, Esperas Pharma, Bayer, Tesaro, Arcus Biosciences and Apexigen; he has also received honoraria for being on the advisory boards of Syros Pharmaceuticals, Incyte and Blueprint Medicines. B.M.W. has received research funding from Celgene, Eli Lilly, Novartis and Revolution Medicine and has consulted for Celgene, GRAIL and Mirati. A.J.A. has consulted for Anji Pharmaceuticals, Affini-T Therapeutics, Arrakis Therapeutics, AstraZeneca, Boehringer Ingelheim, Oncorus, Merck & Co., Mirati Therapeutics, Nimbus Therapeutics, Plexium, Revolution Medicines, Reactive Biosciences, Riva Therapeutics, Servier Pharmaceuticals, Syros Pharmaceuticals, T-knife Therapeutics, Third Rock Ventures and Ventus Therapeutics. A.J.A. holds equity in Riva Therapeutics. A.J.A. has research funding from Bristol Myers Squibb, Deerfield, Eli Lilly, Mirati Therapeutics, Novartis, Novo Ventures, Revolution Medicines and Syros Pharmaceuticals. While not directly related to this manuscript, S.W.L. declares competing interests outside consultancy and equity for Oric Pharmaceuticals, Blueprint Medicines, Mirimus, Senecea Therapeutics, Faeth Therapeutics and PMV Pharmaceuticals, and outside consultancy (no equity) for Fate Therapeutics. C.J.D. is a consultant/advisory board member for Cullgen, Deciphera Pharmaceuticals, Eli Lilly, Mirati Therapeutics, Reactive Biosciences, Revolution Medicines, Ribometrics, Sanofi and SHY Therapeutics. C.J.D. has received research funding support from Deciphera Pharmaceuticals, Mirati Therapeutics, Reactive Biosciences, and SpringWorks Therapeutics. R.H.V. has received consulting fees from BMS, is an inventor on patents relating to cancer cellular immunotherapy, cancer vaccines and KRAS immune epitopes, and receives royalties from Children’s Hospital Boston for a licensed research-only monoclonal antibody. U.N.W., C.J.D. and K.P.O. were named as inventors on a patent application filed by Columbia University pertaining to the treatment of RAS inhibitor resistant tumours. The other authors declare no competing interests.

Figures

Fig. 1
Fig. 1. RMC-7977 exhibits potent anti-tumour activity in in vitro models of PDAC.
a, PRISM multiplex screening changes in viability of 796 cancer cell lines in response to RMC-7977 treatment. Cell line viability was plotted as area under the curve (AUC) values. Colours indicate KRAS status. Horizontal lines indicate median. WT, wild type. b, Sensitivity of human PDAC cell lines with KRASG12X, KRASQ61H or BRAFΔV487–P492 mutations treated with indicated concentrations of RMC-7977 for 5 days, expressed as half-maximal inhibitory concentration (IC50). c, Viability of mouse PDAC lines with KrasG12X mutations treated with indicated concentrations of RMC-7977 for 72 h. d, Viability of human PDAC organoids with KRASG12X mutations treated with indicated concentrations of RMC-7977 for 6 days. Data in bd are mean ± s.d. of three biological replicates normalized to DMSO control. Colours indicate KRAS mutation. e, Western blots of HPAC cells treated with DMSO or RMC-7977 at the indicated concentrations for 24 h (n = 3). MW, molecular weight. f, Western blots of HPAC cells treated with DMSO or 100 nM RMC-7977 for indicated durations. e,f, Vinculin was used as loading control. gi, Ex vivo human PDAC explants treated with DMSO or indicated concentrations of RMC-7977 for 24 h (n = 4). g,h, Quantification of pERKT202/Y204 (g) and CC3 (h) from IHC analysis of explants. Analysis based on 10–15 fields of view (light shade), averaged per explant slice (dark shade) compared by one-way analysis of variance (ANOVA) with Tukey correction. Error bars indicate ±s.d. i, Representative IHC of pERKT202/Y204 and CC3 staining of explants treated with DMSO or 100 nM RMC-7977. Scale bars, 50 μm. Cell line information is provided in Supplementary Table 5. *P < 0.05, **P < 0.01, ***P < 0.001, ****P < 0.0001; NS, not significant. Source Data
Fig. 2
Fig. 2. RMC-7977 exhibits anti-tumour activity in xenograft and allograft models of PDAC.
ae, Human PDAC xenograft models implanted either subcutaneously (SC) or orthotopically (ortho) into immunodeficient mice. Tumour-bearing mice were treated with vehicle or 10 mg kg−1 RMC-7977 orally, once daily, for 21–28 days. a, Box plot showing percentage change in tumour volume at endpoint compared with baseline at day 0 in vehicle and RMC-7977 treatment arms. Each symbol represents one mouse. Source and format of cell line, KRAS mutation, number of mice and tumour location are indicated. Study arms were compared by two-tailed Student’s unpaired t-test. b, Representative bioluminescence images showing signal in HPAF-II orthotropic xenograft tumours at day 0 and day 21 (endpoint) for vehicle and RMC-7977 treatment arms. c,d, Representative tumour growth curves for HPAF-II orthotopic (c) and subcutaneous (d) xenograft models treated with vehicle or RMC-7977, shown as percentage change in tumour volume from baseline over time. Vehicle and RMC-7977 groups were compared by two-way repeated measures ANOVA on the last measurement day of the vehicle group. Data are mean ± s.e.m. e, Tolerability of RMC-7977 as assessed by percentage change in body weight from baseline over time. Data are mean ± s.e.m. f,g, The KPCY-derived PDAC cell line 6499c4 was transplanted either subcutaneously or orthotopically into syngeneic mice. Tumour-bearing mice were treated with vehicle or 10 mg kg−1 RMC-7977 orally, once daily. f, Box plot showing changes in tumour volumes at day 14, compared with baseline at day 0, in vehicle and RMC-7977 treatment arms. Groups compared by two-tailed unpaired Student’s t-test. Tumour locations as indicated in the graph. g, Representative IHC of pERKT202/Y204 (left) or CC3 (right) in tumours from vehicle and RMC-7977-treated KPCY allograft mice. Scale bars, 100 μm. Quantification is presented in Extended Data Fig. 2u. Source Data
Fig. 3
Fig. 3. Pharmacology of RAS dependence.
a,b, Capan-1 subcutaneous xenograft mice were treated with a single dose of vehicle or RMC-7977 at 10 mg kg−1, 25 mg kg−1 or 50 mg kg−1. Tissues were collected at indicated timepoints (n = 3–6 per timepoint and dose). a, Pharmacokinetic–pharmacodynamic study in the Capan-1 xenograft model. Pharmacokinetic profile is shown as RMC-7977 concentration in tumours (solid blue lines) and blood (dashed blue lines) over time. Pharmacodynamic response is shown as relative change in DUSP6 mRNA expression (solid red lines) over time. Shades of blue or red represent the three tested doses of RMC-7977. Data are mean ± s.d. b, Pharmacokinetic–pharmacodynamic relationship between RMC-7977 concentration and inhibition of DUSP6 expression in tumours. c,d, Tumour-bearing KPF/FC mice were treated with a single dose of vehicle or RMC-7977 at 10 mg kg−1, 25 mg kg−1 or 50 mg kg−1. Tissues were collected at indicated timepoints (n = 3 per timepoint and dose). c, Pharmacokinetic–pharmacodynamic relationship in the KPF/FC mouse model. Pharmacokinetic response is shown as RMC-7977 concentration in tumours (solid blue lines) and blood (dashed blue lines) over time. Pharmacodynamic response is shown as relative change in pERKT202/Y204-positive IHC staining in tumours (solid red lines) over time. Shades of blue or red represent different doses. Data are mean ± s.d. BQL, below quantifiable limit. d, Pharmacokinetic–pharmacodynamic relationship between RMC-7977 concentration and pERKT202/Y204 inhibition in tumours. e,f, CDX tumour-bearing mice were treated with a single dose of vehicle or RMC-7977 at 10 mg kg−1, 25 mg kg−1 or 50 mg kg−1. Tissues were collected at indicated timepoints (n = 3–6 per timepoint and dose). Pharmacokinetic–pharmacodynamic relationship between RMC-7977 concentration and inhibition of Dusp6 expression in normal colon (e) and skin (f). b,df, A three-parameter sigmoidal exposure response model was fitted to the data to derive EC50 values. Source Data
Fig. 4
Fig. 4. Inhibition of RAS induces pancreatic tumour-selective apoptosis.
a,b, Capan-1 subcutaneous xenograft mice (from Fig. 3) were treated with a single dose of vehicle (veh) or RMC-7977 at 10 mg kg−1, 25 mg kg−1 or 50 mg kg−1. Tissues were collected at indicated timepoints (n = 3–6 per timepoint and dose). a, Representative IHC of tumours, colon and skin from the Capan-1 xenograft model collected at 8 h after a single dose of vehicle or RMC-7977, stained for CC3. Scale bars, 100 μm. b, Quantification of CC3 staining in tumours, colon, and skin. bf, Tumour-bearing KPF/FC mice were treated with a single dose of vehicle or RMC-7977 at 10 mg kg−1, 25 mg kg−1 or 50 mg kg−1. Tissues were collected at indicated timepoints (n = 3 per timepoint and dose). c, Representative IHC of KPF/FC tumours and colons collected at 4 h after a single dose of vehicle or RMC-7977, stained for CC3. Scale bars, 50 μm. d, Quantification of CC3 staining in tumours and colons. e, Representative IHC of KPF/FC tumours and colons collected at 24 h after a single dose of vehicle or RMC-7977, stained for cyclin A2. Scale bars, 50 μm. f, Quantification of cyclin A2 staining in tumours and colons. b,d,f, Analysis of IHC based on ten fields of view and plotted as the average per tissue section. Shades of blue represent the tested doses. Results were compared by two-tailed unpaired Student’s t-test. Source Data
Fig. 5
Fig. 5. RMC-7977 inhibits tumour growth and extends survival in autochthonous models of PDAC.
ac, KPC mice treated with vehicle (n = 9) or RMC-7977 (50 mg kg−1 orally, on alternating days; n = 13) until endpoint criteria were met. a, Kaplan–Meier survival analysis comparing RMC-7977 to vehicle, and historical data from gemcitabine and vehicle treatment arms. b, Tumour growth rates calculated from longitudinal tumour volumes. c, Waterfall plot showing best response for each tumour relative to initial volume. b,c, Letters represent individual vehicle-treated mice and numbers represent RMC-7977 treated mice. d, Treatment scheme for KPCY mice (C57Bl/6 background) with vehicle (n = 6) or RMC-7977 (25 mg kg−1 orally, once daily; n = 8) for 15 days. e, Tumour growth curves for mice in the experiment depicted in d. f, Waterfall plot showing percentage change in tumour volume compared with baseline after 15 days of treatment. g, RMC-7977 tolerability as assessed by body weight change from baseline over time. h, Treatment scheme for KPC mice (129S4/SvJae background) with vehicle (n = 6) or RMC-7977 (50 mg kg−1, orally, on alternating days; n = 11) for 1 week. Tissues collected at 4 h (n = 7) or 24 h (n = 4) after the last dose. i, Tumour growth curves for mice in the experiment depicted in h. j, Waterfall plot showing percent change in tumour volume compared with baseline after one week of treatment. k, RMC-7977 tolerability assessed by body weight change from baseline over time. l, IHC analysis of KPC tumours treated with vehicle or RMC-7977 for the indicated time, with tissues collected either at 4 h or 24 h after the last dose. Tumours were stained for pERKT202/Y204, pS6S235/236, pS6S240/244, CC3 and cyclin A2. Quantification of IHC was based on ten fields of view (light shade), averaged per tumour (dark shade) and means were compared by two-tailed unpaired Student’s t-test. Error bars indicate ±s.d. Source Data
Fig. 6
Fig. 6. Resistance to RMC-7977 predominantly arises independently of MAPK activity.
a, CNV analysis of DNA isolated from epithelial cells from RMC-7977-resistant KPC tumours (top), KPCY tumour-derived cell lines (middle) and KPF/+C naive tumours (bottom). The region highlighted in green marks chromosome 15, which includes the Myc locus. Chr., chromosome. b, CNV plots showing chromosome 15 (chr. 15) in RMC-7977-resistant KPC tumours. The vertical green line marks the Myc locus. The horizontal dashed line indicates the threshold to be called as a gain. Numbers indicate tumour identity from Fig. 5. cf, Cell lines derived from RMC-7977-resistant or naive KPC tumours. c, Cell lines treated with DMSO or indicated concentrations of RMC-7977 for 3–5 days. Data are mean ± s.d. of three biological replicates normalized to DMSO control. Values reproduced from DMSO control (RMC-7977 alone) from Fig. 6f and Extended Fig. 7a. d, Mass spectrometry-based proteomic analysis comparing the effects of RMC-7977 and DMSO treatment in resistant K18509R (Myc gain) and naive K8484 (Myc stable). Differential protein expression signatures within each line were analysed for enrichment of published functional gene sets (MAPK, MYC and YAP–TAZ). FC, fold change; FDR, false discovery rate; NES, normalized enrichment score. e, Western blot analyses of two RMC-7977-resistant (K18745R and K18509R) and two naive (K8484 and K2293) cell lines treated with DMSO, RMC-7977 (100 nM), IAG933 (1 μM) or the combined treatment (combo) for 24 h. Vinculin and β-tubulin were used as loading controls. f, Cell lines described in e were treated with indicated concentrations of DMSO, RMC-7977, IAG933 or the combined treatment. Right, dose–response matrices show combination synergy based on cell viability at different dose pairs. Left, viability of cell lines treated with a range of RMC-7977 concentrations in combination with the indicated concentration of IAG933. Data are mean ± s.d. of 3–4 biological replicates normalized to DMSO control. Source Data
Extended Data Fig. 1
(a) Viability levels of human PDAC cell lines (from Fig. 1b) with KRASG12X, KRASQ61H, and BRAFΔV487-P492 mutations treated with indicated concentrations of RMC-7977 for 5 days. Data points represent the mean of biological 3 replicates normalized to DMSO control. KRAS mutations are indicated by curve colors. Error bars indicate ±s.d. (b,c) Viability levels of human PDAC cell lines with (b) KRASQ61H mutation or (c) KRASWT treated with DMSO or indicated concentrations of RMC-7977 for 5 days. Data points represent the mean of 3-4 biological replicates normalized to DMSO control. Error bars indicate ±s.d. (d) Viability levels of human PDAC organoids with KRASWT treated with DMSO or indicated concentrations of RMC-7977 for 6 days. Data points represent the mean of 2 biological replicates normalized to DMSO control. Error bars indicate ±s.d. (e) Western Blots of mouse PDAC cell lines treated with DMSO or range of RMC-7977 concentrations (1-100 nM) for 2 h. Protein levels of phospho-ERKT202/Y204 and total ERK were analyzed. Alpha-(α)-tubulin was used as loading control. (f) Western Blots of human PDAC cell lines treated with DMSO or range of RMC-7977 concentrations (1-100 nM) for 24 h. Protein levels of phospho-ERKT202/Y204, total ERK, phospho-pS6S235/236 total S6, phospho-AktT308 and total Akt were analyzed. Vinculin was used as loading control. (g) Western Blots of AsPC-1 cell line treated with DMSO or RMC-7977 (100 nM) for indicated timepoints. Protein levels of phospho-ERKT202/Y204, total ERK, total PARP and cleaved PARP were analyzed. Vinculin was used as loading control. For cell line information see SI Table 5. Source Data
Extended Data Fig. 2
(a-r) Human PDAC xenograft models from Fig. 2a. (a) Waterfall plot showing tumor volume change from baseline in RMC-7977 treated tumors. Error bars indicate ±s.e.m. Table shows selected genotypes for the xenograft panel with the row above indicating the KRAS mutation and number of animals. Present co-mutations in each model shown as blue squares in the table. (b-i) Tumor growth curves for indicated xenograft models from (a), shown as percent tumor volume change from baseline over time. Vehicle and RMC-7977 groups were compared by 2-way repeated measures ANOVA on the last measurement day of the vehicle group (*, p < 0.05; **, p < 0.01; ***, p < 0.001; ****, p < 0.0001). Error bars indicate ±s.e.m. (j-r) Tolerability of RMC-7977 as assessed by percent animal body weight change from baseline over time, for indicated xenograft models from (a). Error bars indicate ±s.e.m. (s,t) Kaplan-Meier survival analysis comparing RMC-7977 and Vehicle treatment arms in (s) subcutaneous and (t) orthotopic KPCY 6499c4 allograft models (***, p < 0.001; ****, p < 0.0001). (u) Quantification of phospho-ERKT202/Y204 (left) and CC3 (right) staining in tumors from orthotopic KPCY 6499c4 allograft model collected at indicated timepoints post single dose of Vehicle or RMC-7977. Analysis of IHC images based on 10 fields of view and plotted as average per tissue section. Results were compared by two-tailed Student’s unpaired t-test (**, p < 0.01; ****, p < 0.0001). Error bars indicate ±s.d. Source Data
Extended Data Fig. 3
Extended Data Fig. 3. Analysis was ran on tissues collected from mice in Fig. 3.
(a) Quantification of phospho-ERKT202/Y204 IHC staining of tumors isolated from Vehicle and RMC-7977-treated KPF/FC mice, at indicated timepoints post single dose. (b) qRT-PCR analysis was ran on tumors collected from KPF/FC mice treated with a single dose of Vehicle or RMC-7977 (50mg/kg). Plot shows relative expression of five MAPK pathway signature genes over time. Results were compared by two-tailed Student’s unpaired t-test (*, p < 0.05; **, p < 0.01; p < 0.001; ****, p < 0.0001). Error bars indicate ±s.d. (c,d) PK/PD in the colons and skin isolated from CDX tumor-bearing mice. Pharmacokinetic response shown as RMC-7977 concentration in (c) colon and (d) skin (solid blue lines) over time. Pharmacodynamic response shown as relative change in Dusp6 expression in colon or skin (red solid lines) over time. Shades of blue or red represent three tested doses. Error bars indicate ±s.d. (e) Quantification of phospho-ERKT202/Y204 IHC staining of colons isolated from Vehicle and RMC-7977-treated KPF/FC mice, at indicated timepoints post single dose. (f) PK/PD of RMC-7977 in the colons isolated from KPF/FC mice. Pharmacokinetic response shown as RMC-7977 concentration in colon (solid blue lines) over time. Pharmacodynamic response shown as relative change in phospho-ERKT202/Y204 positive IHC staining (red solid lines) over time. Shades of blue or red represent three tested doses. Error bars indicate ±s.d. (a,e) Analysis of IHC images based on 10 fields of view and plotted as average per tissue section. Shades of blue represent three tested doses. Results were compared by two-tailed Student’s unpaired t-test (*, p < 0.05; **, p < 0.01; ****, p < 0.0001). Source Data
Extended Data Fig. 4
(a) KPC mice (from Fig. 5) treated with Vehicle (n = 9) or RMC-7977 (50 mg/kg, p.o., q.o.d., n = 13) until endpoint criteria were met. Tolerability of RMC-7977 in KPC mice as assessed by percent animal body weight change from baseline over time. (b,c) KPC mice (from Fig. 5) were treated with Vehicle (n = 10) or RMC-7977 (n = 31) for indicated time, with tissues collected either at 4 or 24 h post last dose. (b) Representative IHC images of KPC tumors collected at indicated timepoints, stained for phospho-ERKT202/Y204, phospho-S6S235/236 and phospho-S6S240/244. Scale bars = 100 μm. (c) Representative IF images of KPC tumors collected at indicated timepoints, stained for phospho-ERKT202/204 (left panel, red), phospho-S6S235/236 (right panel, red) and CK19 (green), and counterstained with DAPI (blue). Scale bars = 50 μm. Source Data
Extended Data Fig. 5
(a-e) KPC mice (from Fig. 5) were treated with Vehicle (n = 11) or RMC-7977 (50 mg/kg, n = 33) for indicated time, with tissues collected either at 4 or 24 h post last dose (a) qRT-PCR analysis was run on RNA isolated from KPC tumors. Plots show relative expression of five MAPK pathway signature genes at indicated timepoints. Results were compared by two-tailed Student’s unpaired t-test (*, p < 0.05; **, p < 0.01; p < 0.001; ****, p < 0.0001). Error bars indicate ±s.d. (b) Representative IHC images of KPC colon and skin collected at endpoint and stained for CC3. Scale bars = 100 μm. (c) Quantification of CC3 IHC staining in colon, and skin. (d) Representative IHC images of KPC colon and skin collected at endpoint and stained for Cyclin A2. Scale bars = 100 μm. (e) Quantification of Cyclin A2 IHC staining in colon and skin. (c,e) Quantification of IHC images was based on 10 fields of view (light shade), averaged per tissue section (dark shade) and means were compared by two-tailed Student’s unpaired t-test (*, p < 0.05; **, p < 0.01). Error bars indicate ±s.d. Source Data
Extended Data Fig. 6
(a) CNV analysis of DNA isolated from epithelial cells of RMC-7977 resistant KPC tumors. Green lines mark amplified regions of interest. Numbers represent matched tumors from Fig. 5. (b) Targeted sequencing of Myc locus in RMC-7977 resistant KPC tumors and KPC Vehicle tumors. Letters and numbers represent matched tumors from Fig. 5. (c) Cell lines derived from RMC-7977 resistant or naive KPC tumors, treated with DMSO or indicated concentrations of SCH772984 (ERKi, left) or Trametinib (MEKi, right) for 3 days. Data points represent the mean of 3 replicates normalized to DMSO control. Error bars indicate ± s.d. RMC-7977 resistance and Myc status are indicated by curve colors. (d-f) KPC mice (from Fig. 5) were treated with Vehicle or RMC-7977 (50 mg/kg) for indicated time, with tissues collected either at 4 or 24 h post last dose. (d) qRT-PCR analysis was run on RNA isolated from KPC tumors. Heatmap shows changes in expression of YAP/TAZ/TEAD pathway signature genes in RMC-7977 mice relative to Vehicle controls. (e) Quantification of Survivin IHC staining of KPC tumors. (f) Representative IHC images of KPC Vehicle tumors and RMC-7977 tumors collected 24 h post single dose or at endpoint. Scale bars = 100 μm. Source Data
Extended Data Fig. 7
(a) Cell lines derived from RMC-7977 resistant KPC tumors and (b) human PDAC cell lines treated with DMSO, RMC-7977, IAG933 or combinations. (Top rows) Viability levels of cell lines treated with a range of RMC-7977 concentrations in combination with indicated concentration of IAG933. Line colors correspond to IAG933 concentration. Data points in (a) represent the mean of 3-4 biological replicates normalized to DMSO control. Error bars indicate ±s.d. (Bottom rows) The dose–response matrices show combination synergy based on cell viability at different dose pairs. Each cell line in (b) represents one biological replicate (n = 8). Source Data

References

    1. Punekar, S. R., Velcheti, V., Neel, B. G. & Wong, K. K. The current state of the art and future trends in RAS-targeted cancer therapies. Nat. Rev. Clin. Oncol.19, 637–655 (2022). - PMC - PubMed
    1. Prior, I. A., Hood, F. E. & Hartley, J. L. The frequency of ras mutations in cancer. Cancer Res.80, 2969–2974 (2020). - PMC - PubMed
    1. Singh, M. et al. Concurrent inhibition of oncogenic and wild-type RAS-GTP for cancer therapy. Nature10.1038/s41586-024-07205-6 (2024). - PMC - PubMed
    1. Waters, A. M. & Der, C. J. KRAS: the critical driver and therapeutic target for pancreatic cancer. Cold Spring Harb. Perspect. Med.8, a031435 (2018). - PMC - PubMed
    1. Janne, P. A. et al. Adagrasib in non-small-cell lung cancer harboring a KRAS(G12C) mutation. N. Engl. J. Med.387, 120–131 (2022). - PubMed

MeSH terms