. 2024 May;300(5):107271.
doi: 10.1016/j.jbc.2024.107271. Epub 2024 Apr 7.

Impaired malin expression and interaction with partner proteins in Lafora disease

Affiliations

Impaired malin expression and interaction with partner proteins in Lafora disease

Alexander V Skurat et al. J Biol Chem. 2024 May.

Abstract

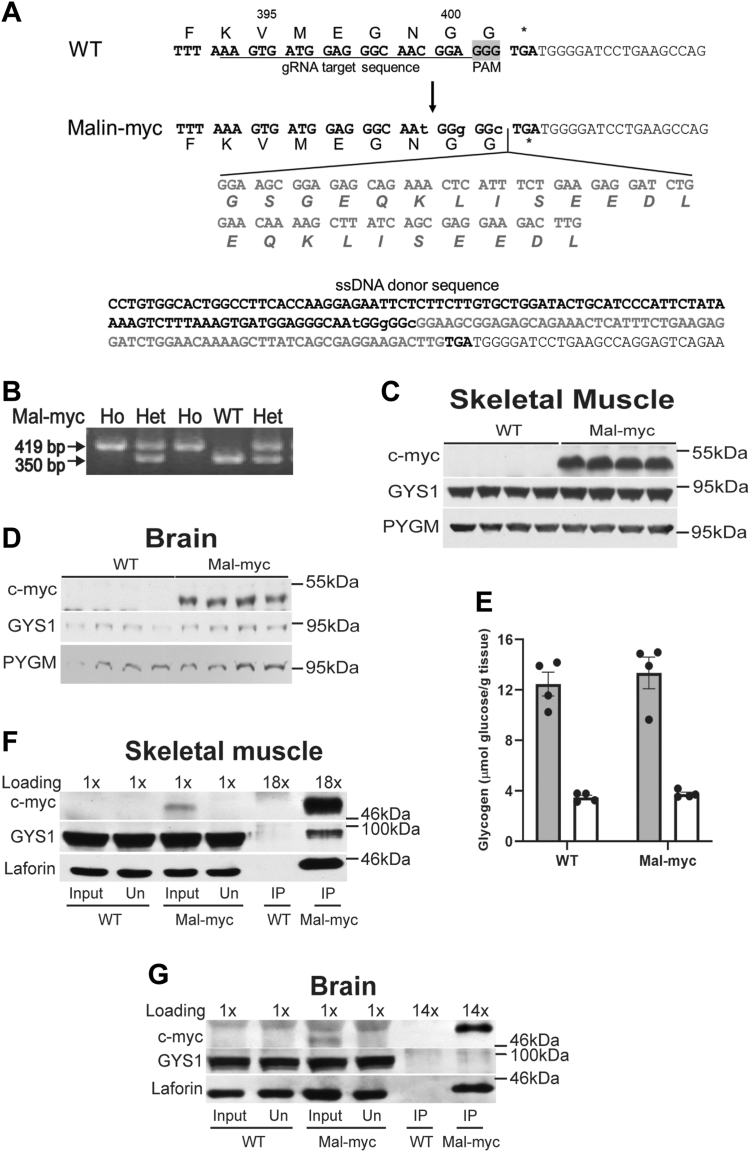
Lafora disease (LD) is an autosomal recessive myoclonus epilepsy with onset in the teenage years leading to death within a decade of onset. LD is characterized by the overaccumulation of hyperphosphorylated, poorly branched, insoluble, glycogen-like polymers called Lafora bodies. The disease is caused by mutations in either EPM2A, encoding laforin, a dual specificity phosphatase that dephosphorylates glycogen, or EMP2B, encoding malin, an E3-ubiquitin ligase. While glycogen is a widely accepted laforin substrate, substrates for malin have been difficult to identify partly due to the lack of malin antibodies able to detect malin in vivo. Here we describe a mouse model in which the malin gene is modified at the C-terminus to contain the c-myc tag sequence, making an expression of malin-myc readily detectable. Mass spectrometry analyses of immunoprecipitates using c-myc tag antibodies demonstrate that malin interacts with laforin and several glycogen-metabolizing enzymes. To investigate the role of laforin in these interactions we analyzed two additional mouse models: malin-myc/laforin knockout and malin-myc/LaforinCS, where laforin was either absent or the catalytic Cys was genomically mutated to Ser, respectively. The interaction of malin with partner proteins requires laforin but is not dependent on its catalytic activity or the presence of glycogen. Overall, the results demonstrate that laforin and malin form a complex in vivo, which stabilizes malin and enhances interaction with partner proteins to facilitate normal glycogen metabolism. They also provide insights into the development of LD and the rescue of the disease by the catalytically inactive phosphatase.

Keywords: Lafora disease; glycogen; glycogen metabolism; glycogen storage disease; laforin; malin; phosphatases.


Conflict of interest statement

Conflict of interest The authors declare the following financial interests/personal relationships which may be considered as potential competing interests: T. D. H., A. A. D.-R., and P. J. R. were consultants for Maze Therapeutics. T. D. H. is also a consultant for SAJE Pharma. The other authors declare that they have no competing interest. None of the work in this article was supported by these entities.

Figures

Figure 1
Figure 1
Design of the malin-myc fusion construct and expression of malin-myc, glycogen synthase, glycogen phosphorylase, and glycogen in skeletal muscle and brain of WT and malin-myc mice and within anti-myc immunoprecipitation from tissues.A, CRISPR-Cas9 design strategy to introduce a C-terminal myc epitope tag into the mouse malin gene; gRNA (target sequence underlined), a ssDNA donor sequence containing a linker (GSG), 2× myc-tag and silent mutations (lower case) is indicated; nucleotide and corresponding amino acid sequence are shown, PAM is highlighted in grey. B, PCR genotyping that identifies WT and malin-myc (Mal-myc) mice produced for this work. WT malin produces a PCR product of 350 bp, whereas the malin-myc fusion gene produces a PCR product of 419 bp. C and D, immunoblotting of the low-speed supernatant (LSS) of skeletal muscle and brain from 4-month-old mice using antibodies against the c-myc tag, glycogen synthase (GYS1) or muscle isoform of glycogen phosphorylase (PYGM). E, glycogen content from skeletal muscle (black bars) and brain (grey bars) of WT and malin-myc mice. Data from four mice are shown as means ± SEM (n = 4). F and G, immunoprecipitation of malin-myc from LSS of skeletal muscle and brain of 4-month-old WT and malin-myc mice using anti-c-myc antibodies and Protein-G Agarose. Absorbed proteins were eluted with SDS/loading buffer. Proteins from LSS (Input), unbound fraction (Un), and eluted from Protein-G Agarose (IP) were separated by gel electrophoresis, transferred to nitrocellulose membranes, and blotted with antibodies to c-myc tag, GYS1 or laforin. Loading values (1×, 18× or 14×) indicate the amount of sample loaded relative to the input.
Figure 2
Figure 2
Near complete immunoprecipitation of malin-myc from skeletal muscle with anti-myc Agarose and effect of α-amylase or amyloglucosidase treatment on immunoprecipitated proteins.A, LSS from the skeletal muscle of 4-month-old malin-myc mice was treated with Protein-G Agarose for 1 h followed by centrifugation at 6000g for 20 min; the resulting supernatant was designated as Input. Aliquots of this fraction were incubated with anti-myc tag Agarose containing 5 μg or 10 μg of covalently linked anti-c-myc antibody (α-myc) for 18 h at 4 °C. The supernatants obtained after centrifugation and precipitation of anti-myc Agarose were designated as unbound fractions. Proteins of LSS, Input, unbound fraction and eluted from anti-myc Agarose with SDS loading buffer (IP) were separated by gel electrophoresis, transferred to nitrocellulose membrane, and blotted with antibodies to c-myc, GYS1 or laforin. Loading indicates the amount of sample loaded relative to the LSS. C, the input fraction from WT and malin-myc mice was incubated with or without 0.1 mg/ml of α-amylase followed by immunoprecipitation using anti-myc Agarose. Input, unbound and eluted proteins were analyzed by Western blot for c-myc, GYS1 and laforin. B, glycogen content in the input and unbound fractions from malin-myc samples treated with or without 0.1 mg/ml of α-amylase was measured. D, after immunoprecipitation from the skeletal muscle of malin-myc mice, the anti-myc Agarose beads were incubated with (+) or without (−) 0.1 mg/ml of amyloglucosidase for 2.5 h at 37 °C. Supernatants containing released proteins (Released) were collected, beads were washed, and resuspended with SDS loading buffer in the original volume (Beads). Proteins from both fractions were analyzed by Western blot for c-myc, GYS1, and laforin. No difference in the protein levels were observed.
Figure 3
Figure 3
Quantitative analysis of glycogen-metabolizing proteins identified by mass spectrometry in c-myc IP of skeletal muscle and brain.A, DAVID GO term analysis of proteins identified by mass spectrometry in c-myc pull-downs versus WT. The 22 proteins for which t test p-value <0.05 (c-myc versus WT) were submitted to the DAVID interface. The histogram displays top Gene Ontology – Biological Process (GO-BP) terms. Bar height represents the Fold Enrichment of the proteins annotated with each term (observed versus expected). The numbers in parentheses represent counts of proteins annotated within each group. B, volcano plot of skeletal muscle c-myc pull downs versus WT displayed as average fold-change (FC) in protein abundance (expressed as log2(FC)) on the x-axis versus significance (expressed as −log10(p-value). The thresholds for selecting proteins abundance changes are indicated by the dotted lines. The vertical lines demarcate the log2(FC) threshold of ±1 and the horizontal line demarcates −log10(p-value) equal to 1.3. Significantly enriched proteins (p < 0.05) with at least two-fold enrichment in IP from Malin-myc mice (log2(FC) >1) are shown in upper right part of the graph. The data is shown as dots and proteins involved in glycogen metabolism are annotated with their respective gene name. C, table of Glycogen-metabolizing proteins identified in IPs from skeletal muscle extracts quantified by total spectrum counts (TSC), protein sequence coverage (% coverage), average NSAF values and p-values. D, table of glycogen-metabolizing proteins identified in IPs from skeletal muscle extracts treated with α-amylase and quantitated as in panel (C). E, glycogen-metabolizing proteins identified in IPs from brain extracts quantified as in panel C. F, volcano plot of proteins identified in IPs from brain tissue of mal-myc mice compared to WT mice, presented as in Panel B. Proteins involved in glycogen metabolism are annotated with their respective gene name. Data are average of three independent experiments ± SEM.
Figure 4
Figure 4
Levels of malin-myc, glycogen synthase, laforin, and glycogen in skeletal muscle of malin-myc, malin-myc/LKO, and LKO mice.A, immunoblot analysis of LSS and low-speed pellet (LSP) from skeletal muscle of 10-month-old mice of the indicated genotype using antibodies to c-myc, GYS1, laforin, or GAPDH as the loading control. Quantitation of malin (BD) and GYS1 (E) levels in LSS of skeletal muscle from malin-myc and malin-myc/LKO mice. Values are normalized to expression in malin-myc mice. Note the decreased levels of malin in the LKO/malin-myc samples. Malin-myc protein distribution in LSS or LSP, expressed as the ratio of protein in LSS or LSP to the total protein (LSS + LSP) is presented in (C) and (D), respectively. Data are shown as means ± SEM (n = 3). Asterisk (∗) denotes p < 0.05 versus malin-myc. F, total skeletal muscle glycogen in the indicated mouse genotypes, ∗p < 0.05 versus WT (n = 3).
Figure 5
Figure 5
Expression of malin-myc, glycogen synthase, laforin and glycogen in brain of malin-myc, malin-myc/LKO, and LKO mice.A, immunoblot analysis of brain LSS and LSP from 10-month-old mice of the indicated genotype using antibodies to c-myc, GYS1, laforin or GAPDH as loading control. BF, quantitation of expression of malin in LSS (B) and GYS1 (CF) in LSP (C and D) and LSS (E and F) of brain from malin-myc and malin-myc/LKO mice. In B values are normalized to expression in malin-myc mice. Distribution of GYS1 protein in LSP or LSS is expressed as the ratio of protein in LSP (D) or LSS (F) to the total protein (LSS + LSP). Note the GYS1 depletion from the LSS (E and F) and redistribution to the LSP (C and D) in the malin-myc/LKO and LKO mice. Data are shown as means ± SEM. Asterisk (∗) denotes p < 0.05 versus malin-myc. G, total brain glycogen in the indicated mouse genotypes. ∗p < 0.05 as compared to WT (n = 3).
Figure 6
Figure 6
Analysis of glycogen-metabolizing proteins in IP from skeletal muscle of malin-myc, malin-myc/LKO, and LKO mice.A, immunoblot analysis using antibodies to c-myc, GYS1 or laforin of input (In), anti-c-myc unbound fractions (Un), and anti-c-myc IP from 4-month-old mice of the indicated genotype. B, table of glycogen-metabolizing proteins identified in IPs by mass spectrometry and presented as percentage protein sequence coverage, average NSAF value and p-value. C and D, volcano plots of proteins identified in IPs from skeletal muscle of malin-myc (myc) compared to malin-myc/LKO and LKO samples displayed by average fold-change (FC) in protein abundance (expressed as log2(FC)) on the x-axis versus significance (expressed as -log10(p-value) as in Figure 3B. Significantly enriched proteins are shown in the upper right part of the graph and those involved in glycogen metabolism are annotated with their respective gene names. The average of three biological replicates ± SEM is shown.
Figure 7
Figure 7
Design of LaforinC265S (LCS) mutant and comparison of (LCS) with LKO mouse models.A, CRISPR-Cas9 design strategy for the introduction of the C265S mutation within the endogenous EMP2A gene (Laforin). The gRNA target sequence indicating (arrow) the Cys codon TGC change to the Ser TCT is underlined and a ssDNA donor that contains nucleotide changes (bold lower case) to introduce C265S and an ApaLI restriction site (boxed) is shown. Nucleotides and corresponding amino acid sequences are shown. PAM, highlighted in gray. B, PCR genotyping of mice WT, heterozygous and homozygous for the LCS mutation. PCR primers were designed to generate a fragment of 639 bp. Digestion with ApaLI results in an uncut fragment of 639 bp for the WT and 450 and 189 bp fragments for the LCS. C and D, total glycogen content in skeletal muscle (C) and brain (D) of 5-month-old (grey bars) and 12-month-old (black bars) WT, LCS and LKO mice, means ± SEM of 7 to 15 mice per genotype. E, total glycogen phosphate content in skeletal muscle of 5-month-old (grey bars) and 12-month-old (black bars) WT, LCS, and LKO mice, means ± SEM of 5 to 11 mice per genotype. F, glucose C-6 phosphate in the brain of 12-month-old WT, LCS and LKO mice, means ± SEM of five mice per genotype. G, glycogen branch chain length distribution in WT, LKO and LCS mice at 4 to 5 and 12 months of age. On the x-axis the degree of polymerization indicates the number of glucose residues/polymer chain and on the y-axis the percent signal of polysaccharides from 3 to 40 residues. Symbols and colors denote the different genotypes. Data are shown as means ± SEM of the indicated number of animals. H, periodic acid-Schiff (PAS) staining of the hippocampus, quadricep muscle and heart sections of 12-month-old LCS and 5- and 12-month-old LKO mice. Purple staining denotes LB. Images were taken at 40× and the bars inside the images denote 50 μm. Representative images from at least four mice are shown. Asterisks: ∗p < 0.05 versus WT; ∗∗p < 0.001 versus WT.
Figure 8
Figure 8
Expression of malin-myc, glycogen synthase, laforin and glycogen levels in skeletal muscle and brain of WT, malin-myc, malin-myc/LCS, and LCS mice.A, immunoblot analysis of LSS and LSP from skeletal muscle of 10-month-old mice with indicated genotype using antibodies to c-myc, GYS1, laforin, or GAPDH as loading control. B, quantitation of malin expression in LSS of malin-myc and malin-myc/LCS mice. Values are normalized to expression in malin-myc mice. C and D, quantitation of malin-myc distribution in LSS (C) or LSP (D), expressed as the ratio of protein in LSS or LSP to the total protein (LSS + LSP). E, total skeletal muscle glycogen in 10-month-old mice of the indicated genotypes. F, immunoblot analysis of LSS and LSP from brain of 10-month-old mice with indicated genotype using antibodies to c-myc, GYS1, laforin or GAPDH as loading control. G and H, quantitation of malin expression in LSS of brain from malin-myc and Malin-myc/LCS mice (G) and laforin/LCS expression in LSS of brain from mice of indicated genotype (H). Note the high level of LCS expression associated with the brain soluble fraction (F and H). I, total brain glycogen in 10-month-old mice of the indicated genotypes. Representatives of three immunoblots for skeletal muscle or brain are shown and data are presented as means ± SEM (n = 3). Asterisk (∗) denotes p < 0.05 as compared to malin-myc.
Figure 9
Figure 9
Analysis of malin-interacting proteins in IP from skeletal muscle of malin-myc, malin-myc/LCS and LCS mice and model of interacting proteins.A, table of glycogen-metabolizing proteins identified in IPs by mass spectrometry and presented as percent protein sequence coverage, average NSAF value, and p-value. B, volcano plot displaying the average fold-change (FC) in protein abundance (expressed as log2(FC)) on the x-axis versus significance (expressed as −log10(p-value) in skeletal muscle of malin-myc (myc) compared to LCS mice. C, volcano plot for proteins identified in IPs from skeletal muscle of myc/LCS mice compared to LCS mice. The data is shown as dots and proteins involved in glycogen metabolism are annotated with their respective gene name. The average of three biological replicates ± SEM are shown. D, a model depicting malin-interacting proteins in the context of glycogen metabolism. Proteins identified in this study EPM2a, NHLRC1, AGL, GYS1, PYGM, GYG1, Stdb1, and Ppp1r3a are shown as interacting with each other in a cluster, some can also associate directly with glycogen. Glycogen branches are shown with solid lines. Dotted lines indicate known or proposed interactions.

References

    1. Minassian B.A. Lafora's disease: towards a clinical, pathologic, and molecular synthesis. Pediatr. Neurol. 2001;25:21–29. - PubMed
    1. Ganesh S., Puri R., Singh S., Mittal S., Dubey D. Recent advances in the molecular basis of Lafora's progressive myoclonus epilepsy. J. Hum. Genet. 2006;51:1–8. - PubMed
    1. Andrade D.M., Turnbull J., Minassian B.A. Lafora disease, seizures and sugars. Acta Myol. 2007;26:83–86. - PMC - PubMed
    1. Delgado-Escueta A.V. Advances in lafora progressive myoclonus epilepsy. Curr. Neurol. Neurosci. Rep. 2007;7:428–433. - PubMed
    1. Turnbull J., Tiberia E., Striano P., Genton P., Carpenter S., Ackerley C.A., et al. Lafora disease. Epileptic Disord. 2016;18:38–62. - PMC - PubMed

Publication types

MeSH terms