. 2024 May 29;44(22):e2048232024.
doi: 10.1523/JNEUROSCI.2048-23.2024.

Impaired Cortical Tracking of Speech in Children with Developmental Language Disorder

Affiliations

Impaired Cortical Tracking of Speech in Children with Developmental Language Disorder

Anni Nora et al. J Neurosci. .

Erratum in

Abstract

In developmental language disorder (DLD), learning to comprehend and express oneself with spoken language is impaired, but the reason for this remains unknown. Using millisecond-scale magnetoencephalography recordings combined with machine learning models, we investigated whether the possible neural basis of this disruption lies in poor cortical tracking of speech. The stimuli were common spoken Finnish words (e.g., dog, car, hammer) and sounds with corresponding meanings (e.g., dog bark, car engine, hammering). In both children with DLD (10 boys and 7 girls) and typically developing (TD) control children (14 boys and 3 girls), aged 10-15 years, the cortical activation to spoken words was best modeled as time-locked to the unfolding speech input at ∼100 ms latency between sound and cortical activation. Amplitude envelope (amplitude changes) and spectrogram (detailed time-varying spectral content) of the spoken words, but not other sounds, were very successfully decoded based on time-locked brain responses in bilateral temporal areas; based on the cortical responses, the models could tell at ∼75-85% accuracy which of the two sounds had been presented to the participant. However, the cortical representation of the amplitude envelope information was poorer in children with DLD compared with TD children at longer latencies (at ∼200-300 ms lag). We interpret this effect as reflecting poorer retention of acoustic-phonetic information in short-term memory. This impaired tracking could potentially affect the processing and learning of words as well as continuous speech. The present results offer an explanation for the problems in language comprehension and acquisition in DLD.

Keywords: development; developmental language disorder; machine learning; magnetoencephalography; speech processing.


Conflict of interest statement

The authors declare no competing financial interests.

Figures

Figure 1.
Figure 1.
Time-varying versus nontime-varying features for modeling spoken words and environmental sounds. Visualization of the different acoustic models for example stimuli (four spoken words and the corresponding four environmental sounds).
Figure 2.
Figure 2.
Models for decoding spoken words and environmental sounds. A, Illustration of the time-locked (convolution and logistic regression) and time-averaged (linear regression) machine learning models and the different sets of acoustic, phonemic, and semantic features. The different sets of features and the different machine learning models are illustrated here for exemplary spoken words; the same models were used for decoding environmental sounds. B, Visualization of the performance evaluation for the machine learning models (here for spectrogram reconstruction with the convolution model, for two spoken words).
Figure 3.
Figure 3.
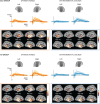
Sensor and source-level brain responses to spoken words and environmental sounds. A, Grand average evoked responses averaged over all spoken words (orange) and environmental sounds (blue) and over sensors covering the left and right temporal cortices in individual participants (narrow lines) and over participants (thick lines) of the DLD and TD groups. The same selection of sensors was used for decoding of the acoustic and phoneme features in the machine learning analysis. B, Cortical source maps (dSPMs) of spoken words and environmental sounds.
Figure 4.
Figure 4.
Decoding results for the different acoustic models for spoken words and environmental sounds. MEG data from sensors over bilateral temporal cortices were used in decoding. For getting an overview of decoding the amplitude envelope and the spectrogram, we used a lag from 20 to 420 ms between each time point in the stimulus features and the MEG data. The phoneme sequence of the spoken words was decoded with the same lag window using a logistic regression model. These models were compared with models using a wide time window of the MEG data (0–1,000 ms) for decoding the overall spectral content (FFT) or spectral and modulation content (MPS) for spoken words (orange) and, separately, for environmental sounds (blue). The gray solid line denotes the chance level (50%) and the gray dashed line the approximate significance level at alpha 0.05, based on permutation tests; the significance level varied somewhat between different models. The average decoding accuracy reported here means the percentage of cases, averaged across all participants, where the model finds the correct sound among two sounds, based on reconstructed features.
Figure 5.
Figure 5.
Decoding results for speech envelope and spectrogram in the left and right hemispheres in the DLD and TD groups. Solid (DLD) and dashed (TD) red lines show the average (with standard error of mean) decoding performance for each participant group. The black bar denotes the largest observed cluster showing differences (TD > DLD) based on cluster permutation testing.
Figure 6.
Figure 6.
Decoding results for the nonspeech envelope and spectrogram in the left and right hemispheres in the DLD and TD groups. Solid and dashed blue lines show the average (with standard error of mean) decoding performance for each participant group. Based on cluster permutation testing, there were no significant differences between the participant groups.
Figure 7.
Figure 7.
Envelope and spectrogram decoding for pseudowords in the left and right hemispheres in the DLD and TD groups. Solid and dashed red lines show the average (with standard error of mean) decoding performance for each participant group. The black bar denotes the largest observed cluster showing differences (TD > DLD) based on cluster permutation testing.
Figure 8.
Figure 8.
Illustration of the original and reconstructed amplitude envelopes of the spoken words. A, Amplitude envelopes for example words. The overall syllable rhythm is clearly illustrated, but the amplitude envelope also carries information about phoneme identity, such as the voiceless stops /k/ and /t/ and the vibrations of the alveolar trill /r/, which are clearly visible in the envelope. B, Average amplitude envelopes for words of different lengths (2, 3, and 4 syllables) in one stimulus set. The downward facing arrows mark the average syllable timings for stimuli of each syllable length. The black/gray arrow denotes the 160–340 ms lag, which showed better decoding of the spoken word amplitude envelope in the TD than DLD group; this corresponds roughly to between-syllable latency within the stimulus words. C, Reconstructed amplitude envelopes for example words, based on data from bilateral temporal cortices at 50–150 and 200–300 ms lag, in one participant from each group (leave-one-out reconstruction). The reconstructions based on MEG data at both latencies most prominently highlight the first syllables (where the word stress lies in Finnish words) but also somewhat reflect the syllable rhythm in both participant groups. D, Reconstructed amplitude envelopes averaged over two-, three-, and four-syllable words, based on data from bilateral temporal cortices at 20–420 ms lag, in one participant from each group (leave-one-out reconstruction).

References

    1. Abrams DA, Nicol T, Zecker S, Kraus N (2008) Right-hemisphere auditory cortex is dominant for coding syllable patterns in speech. J Neurosci 28:3958–3965. 10.1523/JNEUROSCI.0187-08.2008 - DOI - PMC - PubMed
    1. Abrams DA, Nicol T, Zecker S, Kraus N (2009) Abnormal cortical processing of the syllable rate of speech in poor readers. J Neurosci 29:7686–7693. 10.1523/JNEUROSCI.5242-08.2009 - DOI - PMC - PubMed
    1. Adams A-M, Gathercole SE (2000) Limitations in working memory: implications for language development. Int J Lang Commun Disord 35:95–116. 10.1080/136828200247278 - DOI - PubMed
    1. Attout L, Grégoire C, Majerus S (2020) How robust is the link between working memory for serial order and lexical skills in children? Cogn Dev 53:100854. 10.1016/j.cogdev.2020.100854 - DOI
    1. Baddeley A, Gathercole S, Papagno C (1998) The phonological loop as a language learning device. Psychol Rev 105:158–173. 10.1037/0033-295X.105.1.158 - DOI - PubMed

LinkOut - more resources