. 2024 Apr 8;15(1):3016.
doi: 10.1038/s41467-024-46547-7.

Accelerated DNA replication fork speed due to loss of R-loops in myelodysplastic syndromes with SF3B1 mutation

Affiliations

Accelerated DNA replication fork speed due to loss of R-loops in myelodysplastic syndromes with SF3B1 mutation

David Rombaut et al. Nat Commun. .

Abstract

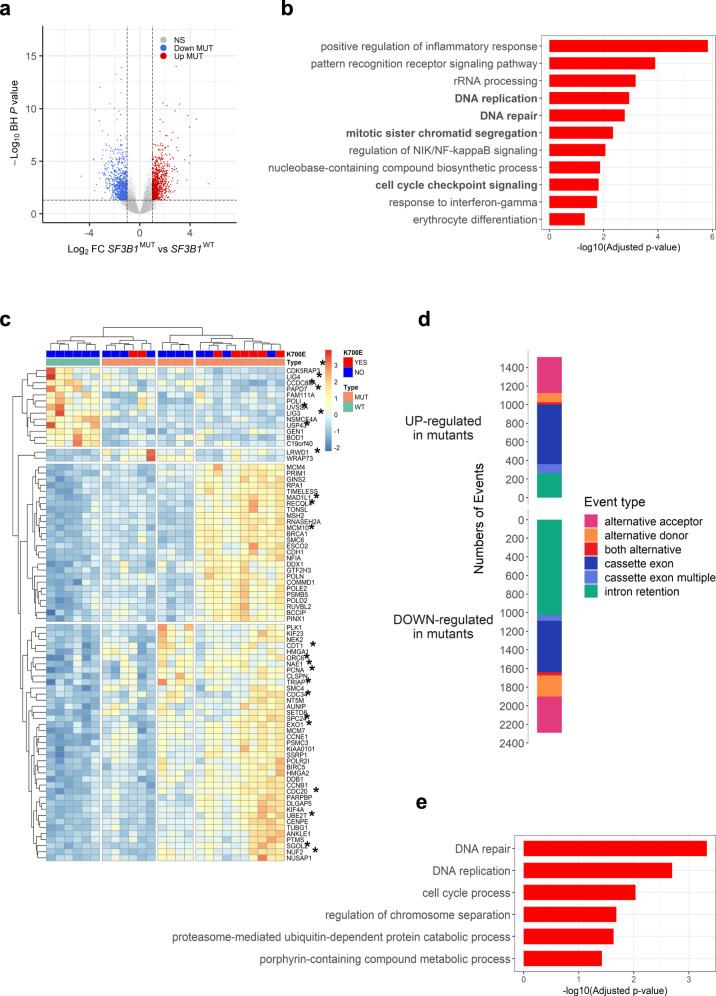
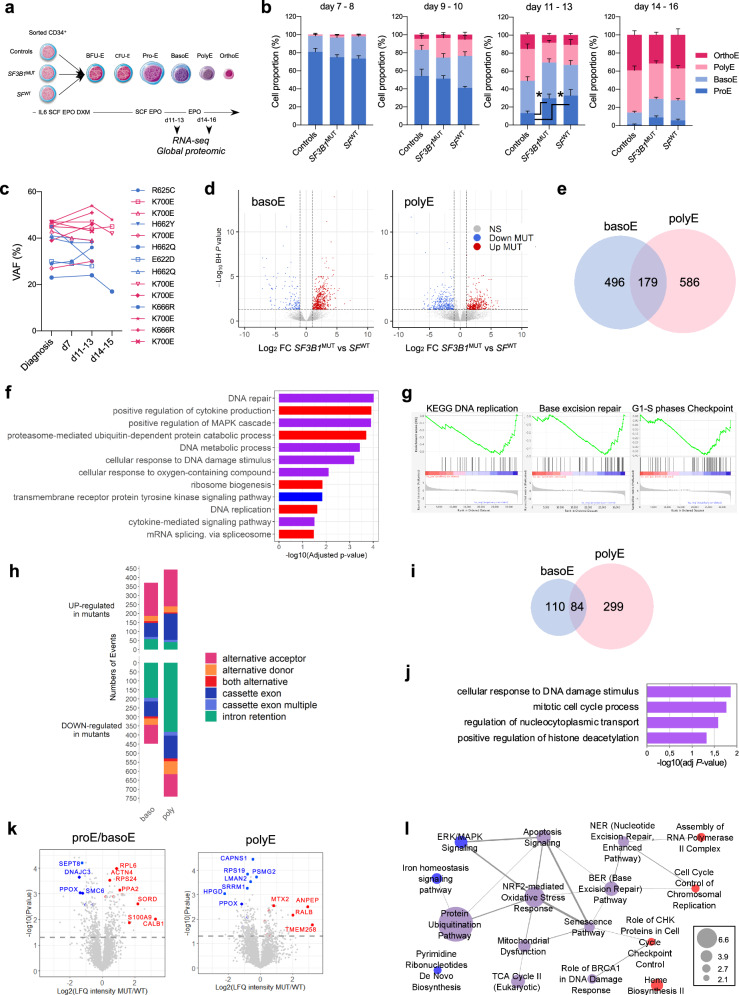
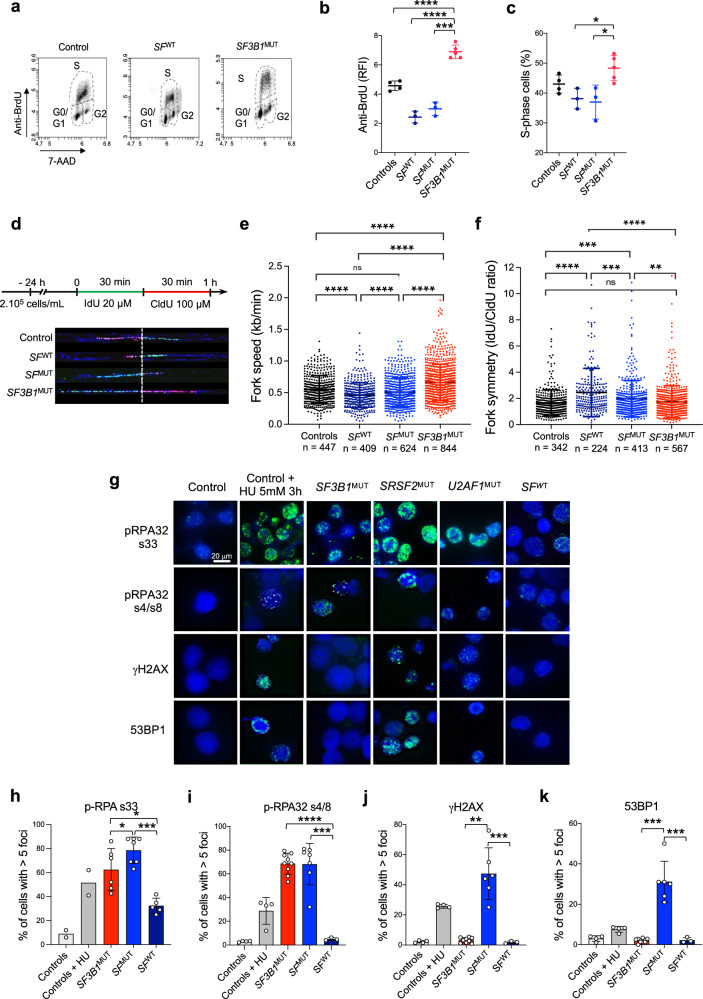
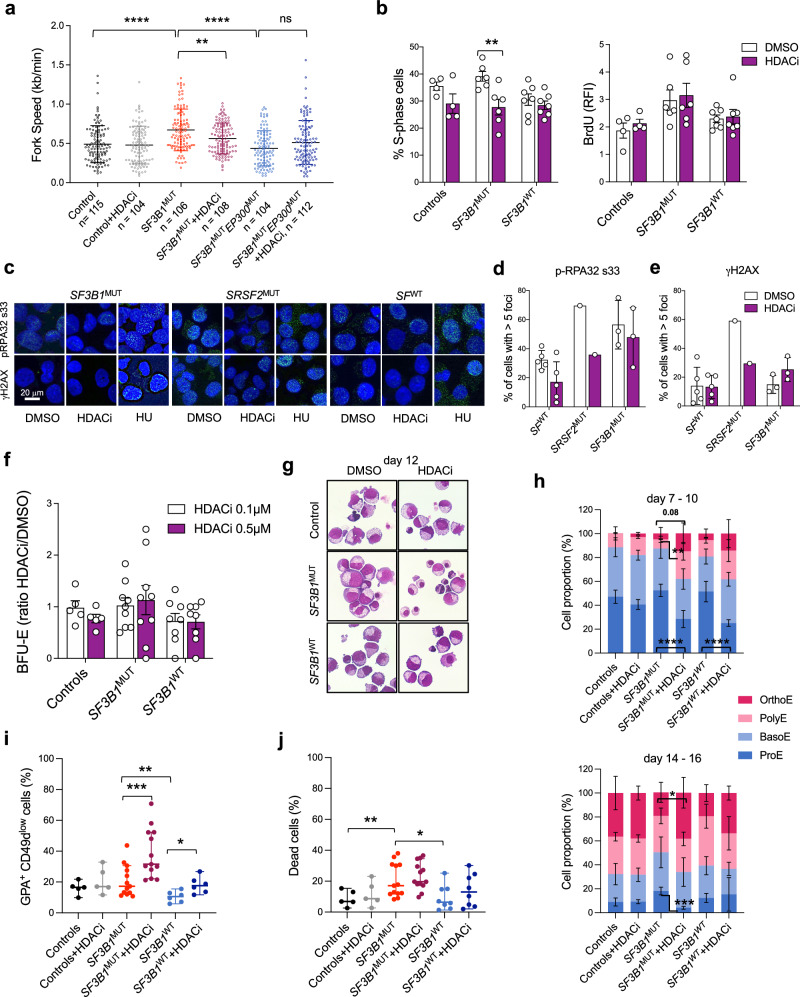
Myelodysplastic syndromes (MDS) with mutated SF3B1 gene present features including a favourable outcome distinct from MDS with mutations in other splicing factor genes SRSF2 or U2AF1. Molecular bases of these divergences are poorly understood. Here we find that SF3B1-mutated MDS show reduced R-loop formation predominating in gene bodies associated with intron retention reduction, not found in U2AF1- or SRSF2-mutated MDS. Compared to erythroblasts from SRSF2- or U2AF1-mutated patients, SF3B1-mutated erythroblasts exhibit augmented DNA synthesis, accelerated replication forks, and single-stranded DNA exposure upon differentiation. Importantly, histone deacetylase inhibition using vorinostat restores R-loop formation, slows down DNA replication forks and improves SF3B1-mutated erythroblast differentiation. In conclusion, loss of R-loops with associated DNA replication stress represents a hallmark of SF3B1-mutated MDS ineffective erythropoiesis, which could be used as a therapeutic target.


Conflict of interest statement

The authors declare no competing interests.

Figures

Fig. 1
Fig. 1. Intron retention reduction correlates with transcriptomic changes of human SF3B1MUT bone marrow mononuclear cells.
RNA-sequencing data of 21 SF3B1MUT and 6 SF3B1WT (4 SRSF2MUT and 2 SFWT) bone marrow mononuclear cell samples were re-analyzed. a Volcano plot showing 1764 up or down-regulated genes in SF3B1MUT samples (Log2(FC) <|1 | ; Two-sided Wald test and Benjamini-Hochberg (BH)-adjusted P value < 0.05). b Gene Ontology (GO) enrichment analysis of the up and downregulated genes showing significantly enriched terms according to -log10(adjusted P value). Fisher’s exact test corrected by false discovery rate (FDR) < 0.05. Terms of interest are in bold. c Heatmap representing the clustering of samples by the variations of expression of a subset of 80 genes belonging to GO terms highlighted in (b). Genes affected by 1 to 8 differential splicing events are marked with an asterisk. d Barplot representing the number and types of differential splicing events in SF3B1MUT in comparison to SF3B1WT with ΔPSI > | 0.10| using two-sided Wald test and BH-adjusted P value < 0.05. The bars over 0 indicate the events upregulated in mutant cases and the bars under 0 indicate the events downregulated in wild type cases. e GO over-representation analysis of 296 significantly deregulated genes affected by 383 intron retention reductions. Fisher’s exact test corrected by FDR < 0.05. FC: fold-change. Source data are provided as a Source Data file.
Fig. 2
Fig. 2. Transcriptomic and proteomic features of SF3B1MUT bone marrow-derived basophilic (basoE) and polychromatophilic (polyE) erythroblasts.
Erythroid precursors were expanded in culture from SF3B1MUT, SFWT MDS and controls samples. a Schematic representation of the protocol. b Erythroid differentiation evaluated on May-Grünwald Giemsa-stained cytospins. Histograms representing the proportion of erythroid precursors in up to 7 controls, 11 SF3B1MUT and 7 SFWT independent samples at days (d)7-8, 9-10, 11-13 and 14-16. Results are expressed as means ± standard error of the mean. 2-way ANOVA for multiple comparisons. Controls versus SF3B1MUT, P = 0.017; controls versus SFWT, P = 0.012. c Variant allele frequencies of SF3B1 mutation in erythroblasts at d7, d11-13 and d14-15 of 14 independent SF3B1MUT samples. d Volcano plot representing up- and down-regulated transcripts in SF3B1MUT basoE and polyE compared to SFWT ones. Two-sided Wald-test and BH-adjusted P value < 0.05. e Venn diagram representing the numbers of differentially expressed genes between SF3B1MUT and SFWT samples at basoE and polyE stages. f Gene Ontology (GO) enrichment analysis of up- and down-regulated genes in SF3B1MUT versus SFWT erythroblasts. Fisher’s exact test corrected by false discovery rate (FDR) < 0.05. Specific terms to basoE or polyE as blue or red bars, respectively, shared terms as violet bars. g Gene set Enrichment Analysis (GSEA) showing terms deregulated in SF3B1MUT basoE. h Barplots representing numbers and types of differential splicing events in SF3B1MUT versus SF3B1WT basoE and polyE with ΔPSI > | 0.10| using two-sided Wald-test and BH-adjusted P value < 0.05. Bars over 0 indicate events upregulated and bars under 0 indicate events downregulated in SFWT erythroblasts. i Venn diagram of intron retention reductions (IRR) in SF3B1MUT basoE and polyE. j. GO terms overrepresented among genes with IRR in SF3B1MUT basoE and polyE. Fisher’s exact-test corrected by FDR < 0.05. k Volcano plots representing differentially expressed proteins in SF3B1MUT versus SFWT samples at proE/basoE and polyE stages (Wald-test, BH-adjusted P value < 0.05). l Cytoscape representation of Ingenuity Pathway Analysis showing deregulated pathways in SF3B1MUT versus SF3B1WT samples (P values < 0.05 by Student t-test) either basoE-specific (blue dots), polyE-specific (red dots) or shared (violet dots). Scale: dot size proportional to –log10 (adjusted-P value). Source data are provided as a Source Data file.
Fig. 3
Fig. 3. Loss of R-loops overlaps intron retention reductions in SF3B1MUT human primary erythroblasts.
DRIP-sequencing. a Violin plots showing the shared peak numbers in 4 controls, 5 SF3B1MUT and 6 SF3B1WT (4 SFWT, 2 SRSF2MUT). Two-sided unpaired t-test. Controls versus SF3B1MUT, P = 0.011; SF3B1WT versus SF3B1MUT, P = 0.015. b DRIP-seq profiles ± RNaseH1 (RNH1) of a 50-kb region on chr7 showing the distribution of R-loops in reads per million. c Pie charts representing localizations of shared R-loops at gene features. d Proportion of shared peaks at gene features in SF3B1MUT samples relative to SF3B1MUT + SF3B1WT samples. e DRIP-seq profiles showing R-loops near SUZ12 promoter. f Comparison of the expression of genes with overlapping R-loops at TSS, gene body, TTS and 3’UTR in SF3B1WT samples and without overlapping R-loops in SF3B1MUT samples. Violon plots represent the difference of mean expression intensity between SF3B1WT and SF3B1MUT samples (d11). Central lines represent the means. Gene numbers in each category are indicated. One sample Wilcoxon signed rank test is used for comparison of actual mean to theorical mean. TSS, P < 0.0001; gene body, P = 0.031; TTS, P = 0.179; 3’UTR, P = 0.118. g Volcano plot representing differential restriction fragments overlapping with peaks between SF3B1MUT and control samples (left panel) and SF3B1MUT and SF3B1WT samples (right panel) with log2(FC) >|1| using two-sided Wald-test and a BH-adjusted P value < 0.05. h Distribution to gene features of differential R-loops in SF3B1WT samples and lost in SF3B1MUT samples. i Venn diagram showing overlap between genes that lost one R-loop and genes with intron retention reduction (IRR) in SF3B1MUT erythroblasts. j DRIP-seq and RNA-seq overlays at RAD9A and IQGAP3 loci showing R-loop losses and IRR events in SF3B1MUT erythroblasts. Gene structures using GENCODE GRCh37. k DRIP-qPCR analysis of 4 controls, 3 SF3B1WT including 1 U2AF1MUT designated as green dot and 4 SF3B1MUT samples. Enrichment signals (normalized to input) at specific loci were normalized to EGR1 (no R-loop). RPL13A and TFPT as positive controls. In box plots, central lines represent medians, bounds represent lower and upper quartiles and whiskers correspond to min-max values. Two-sided unpaired t-test for P values (see Suppl informations). b, e, j RPM: reads per million. * P < 0.05; ** P < 0.01; **** P < 0.0001; ns: not significant. Source data are provided as a Source Data file.
Fig. 4
Fig. 4. DNA replication stress in SF3B1-mutated human primary erythroblasts.
Erythroblasts were derived in culture from 9 SF3B1MUT, 11 SF3B1WT, 6 controls. a–c. Cell cycle analysis by BrdU incorporation. a Representative flow cytometry scatter plot of control, SFWT and SF3B1MUT samples. b, c Scatter plots representing ratios of fluorescence intensity (RFI) anti-BrdU antibody/control Ig (b) and percentages of S-phase cells (c) in 4 controls, 3 SFWT, 3 SFMUT and 5 SF3B1MUT samples. Results are expressed as means ± SD. Two-sided unpaired t-test. b Controls vs SF3B1MUT, P = 0.003; SFWT vs SF3B1MUT, P < 0.0001; SFMUT vs SF3B1MUT, P < 0.0001. c SFWT vs SF3B1MUT, P = 0.012; SFMUT vs SF3B1MUT, P = 0.017. dg DNA combing performed in proE/basoE from 4 SF3B1MUT, 3 SFMUT, 2 SFWT MDS and 2 controls. d Upper panel: Schematic representation of IdU/CldU pulse labelling. Bottom panel: Representative microphotographs of DNA fibers. e Scatter plot showing fork speed (kb/min) expressed in means ± SD. Numbers of fibers analyzed are indicated. Two-sided Mann-Whitney test. Controls vs SF3B1MUT, P < 0.0001; SFWT vs SF3B1MUT, P < 0.0001; SFMUT vs SF3B1MUT, P < 0.0001; SFWT vs SFMUT, P = 0.0009; SFWT vs controls, P < 0.0001; SFMUT vs controls, P = 0.002. f Scatter plot showing fork symmetry as ratios of IdU/CldU length expressed in means ± SD. Two-sided Mann-Whitney test. Controls vs SF3B1MUT, P = 0.302; SFWT vs SF3B1MUT, P < 0.0001; SFMUT vs SF3B1MUT, P = 0.005; SFWT vs SFMUT, P = 0.0003; SFWT vs controls, P < 0.0001; SFMUT vs controls, P = 0.0004. gk Immunofluorescence experiments in MDS or control erythroblasts treated or not with 5 mM hydroxyurea (HU). g Representative images of phospho(p)-RPA32s33, p-RPA32s4/s8, γH2AX and 53BP1 at d11. Nuclei were labeled with DAPI. Magnification 100X (scale: 20 µm). hk Quantification of positive cells with >5 intranuclear foci. h p-RPA32s33 (2 controls, 6 SF3B1MUT, 7 SFMUT, 5 SFWT). i p-RPA32s4/8. j γH2AX. k 53BP1 (4 controls, 9 SF3B1MUT, 7 SFMUT, 3 SFWT). Results are expressed as mean percentages of positive cells ± SD. Two-sided unpaired t-tests; * P < 0.05; ** P < 0.01; *** P < 0.001; **** P < 0.0001; ns: not significant. Source data are provided as a Source Data file.
Fig. 5
Fig. 5. DNA replication stress in murine G1E-ER4 Crispr-Cas9 Sf3b1K700E/+ proerythroblasts.
a Barplots representing numbers and types of differential splicing events in Sf3b1K700E/+ (clone 5.13) versus Sf3b1+/+ (clone 9.82) cells at t0 (proE) and t24 (basoE) after induction of differentiation with estradiol (ΔPSI > | 0.10| using two-sided Wald test and BH-adjusted P value < 0.05). b Gene Ontology (GO) over-representation analysis. Upper panel: Pathways involving differentially spliced genes in Sf3b1K700E/+ cells shared at t0 and t24 (violet bars), specific to t0 (blue bars) or t24 (red bars). Bottom panel: Pathways involving genes with IRR in Sf3b1K700E/+ cells. Shared GO terms at t0 and t24. Fisher’s exact test corrected by false discovery rate (FDR) < 0.05. c Ingenuity Pathway Analysis of differential proteins at t0 (Student t-test, P values < 0.05. Canonical Pathways (hexagons), Diseases and Functions pathways (circles). d Live cell imaging. Mean percentages (± SD) of confluence (n = 3). 2-way ANOVA test for multiple comparisons. e Differentiation of Sf3b1K700E/+ (n = 4) and Sf3b1+/+ cells (n = 3) by flow cytometry. Mean percentages of Ter119+Kitlow cells ± SEM. Unpaired t-test for multiple comparisons. t24h: q = 0.033; t36h: q = 0.027; t48h: q = 0.007. f May-Grünwald-Giemsa-stained cytospins. g BrdU incorporation in S-phase ± estradiol 24 h. Medians ± 95% confidence intervals (CI) of RFI anti-BrdU antibody/control Ig (5 independent experiments). Sf3b1+/+ vs Sf3b1K700E/+, P = 0.002; Sf3b1+/++estradiol vs Sf3b1K700E/++estradiol, P = 0.001; Sf3b1+/+ vs Sf3b1K+/++estradiol, P = 0.011. h Cell cycle analysis by BrdU incorporation ± aphidicolin (APH). Median percentages ( ± 95% CI) of G1/S-phase cells (4 independent experiments). Left: Sf3b1+/+ vs Sf3b1K700E/+, P = 0.035; Sf3b1+/+ vs Sf3b1+/++APH, P = 0.002. Right: Sf3b1+/+ vs Sf3b1K700E/+, P = 0.007; Sf3b1+/++APH vs Sf3b1K700E/++APH, P = 0.002; Sf3b1+/+ vs Sf3b1+/++APH, P = 0.029; Sf3b1K700E/+ vs Sf3b1K700E/++APH, P = 0.029. i BrdU incorporation in S-phase ± hydroxyurea (HU). Medians ± 95% CI of RFI estradiol-treated/untreated cells (5 independent experiments). j dNTP relative quantities. Medians ± 95%CI (4 independent experiments). gj Two-sided unpaired t-test. k Immunofluorescence of pRpa32s4/8 ( ± estradiol 24h, HU 16 h). l Western blot of pRpa32s4/s8, Rpa32, pChk1s345 and Chk1. Actin as loading control. k, l Representative of 3 independent experiments. **** P < 0.0001, *** P < 0.001, ** P < 0.01, * P < 0.05; ns not significant. Source data are provided as a Source Data file.
Fig. 6
Fig. 6. Targeting of R-loops by HDACi may change gene expression without modifying the pattern of spliced isoforms.
a Violin plots with medians and quartiles representing R-loops as shared peak numbers by DRIP-seq of 3 SF3B1MUT, 3 SF3B1WT (2 SRSF2MUT, 1 TET2/NRASMUT) and 4 control erythroblasts ± HDACi at 0.5 μM for 20 h. Two-sided unpaired t-test. b R-loop annotation to gene features in SF3B1MUT samples. Left panel: Shared peak numbers. Right panel: Fold-increase of peak number between HDACi and DMSO conditions. c R-loop profiles near BCL2L1 and PTPN11 promoter. RPM: reads par million. d Quantification of BCL2L1, NCOA4, PTPN11 and HK1 transcripts by RT-qPCR in 4 SF3B1MUT and 3 control samples. Mean quantities normalized to PPIA ± SD. Two-sided unpaired t-test. e Expression of PPOX, PPM1A, COASY, S100A4, and BCL2L1 transcript isoforms by RT-PCR representative of 4 SF3B1MUT, 6 SF3B1WT and 2 control samples. **** P < 0.0001, *** P < 0.001, ** P < 0.01, * P < 0.05. Source data are provided as a Source Data file.
Fig. 7
Fig. 7. HDACi improves the differentiation of human SF3B1MUT erythroblasts.
a Scatter plot of fork speed measurement (kb/min) by DNA combing in 2 SF3B1MUT (1 SF3B1/DNMT3A, 1 SF3B1/TET2/EP300) and 1 control ± HDACi 0.2 μM for 20 h expressed in means ± SD. Two-sided Mann-Whitney test. b Cell cycle analysis by BrdU incorporation in 6 SF3B1MUT, 7 SF3B1WT and 4 controls. Left panel: Mean percentages ± SD of S-phase cells. Right panel: Mean BrdU RFIs ± SD in S-phase. Two-sided paired t-test. SF3B1MUT versus SF3B1MUT + HDACi, P = 0.002. ce Immunofluorescence images of p-RPA32s33 and γH2AX representative of 3 SF3B1MUT, 6 SF3B1WT MDS (1 SRSF2MUT, 3 SFWT, 2 w/o mutation) at day 11. Nuclei labelling with DAPI. Magnification X100 (scale: 20 µm). d, e Mean percentages ± SD of positive cells with > 5 intranuclear foci. f. Burst forming unit-erythroid (BFU-E) colony assays in 9 SF3B1MUT, 8 SF3B1WT and 5 controls. Mean ratios between HDACi and DMSO conditions ± SD. g May-Grünwald-Giemsa-stained cytospins (d12). h Proportions of erythroid precursors in 7 SF3B1MUT, 3 SF3B1WT and 4 controls at d7-10 and d14-16. Means ± SEM and 2-way ANOVA multiple comparisons for q values. i Scatter plots showing differentiation by flow cytometry expressed as mean percentages ± SD of GPA+CD49dlow cells. j Scatter plots showing mean percentages ± SD of dead cells (FSC/SSC) at d12-14. i, j Two-sided paired t-test for P values. **** P < 0.0001, *** P < 0.001, ** P < 0.01, * P < 0.05. Source data are provided as a Source Data file.

References

    1. Yoshida K, et al. Frequent pathway mutations of splicing machinery in myelodysplasia. Nature. 2011;478:64–69. doi: 10.1038/nature10496. - DOI - PubMed
    1. Khoury JD, et al. The 5th edition of the world health organization classification of haematolymphoid tumours: myeloid and histiocytic/dendritic neoplasms. Leukemia. 2022;36:1703–1719. doi: 10.1038/s41375-022-01613-1. - DOI - PMC - PubMed
    1. Arber DA, et al. International Consensus Classification of Myeloid Neoplasms and Acute Leukemias: integrating morphologic, clinical, and genomic data. Blood. 2022;140:1200–1228. doi: 10.1182/blood.2022015850. - DOI - PMC - PubMed
    1. Hellström-Lindberg E. Efficacy of erythropoietin in the myelodysplastic syndromes: a meta-analysis of 205 patients from 17 studies. Br. J. Haematol. 1995;89:67–71. doi: 10.1111/j.1365-2141.1995.tb08909.x. - DOI - PubMed
    1. Park S, et al. Outcome of lower-risk patients with myelodysplastic syndromes without 5q deletion after failure of erythropoiesis-stimulating agents. J. Clin. Oncol. 2017;35:1591–1597. doi: 10.1200/JCO.2016.71.3271. - DOI - PubMed

MeSH terms