Clinical Trial
. 2024 Apr 8;15(1):3003.
doi: 10.1038/s41467-024-47273-w.

Immunoregulatory role of the gut microbiota in inflammatory depression

Affiliations
Clinical Trial

Immunoregulatory role of the gut microbiota in inflammatory depression

Penghong Liu et al. Nat Commun. .

Abstract

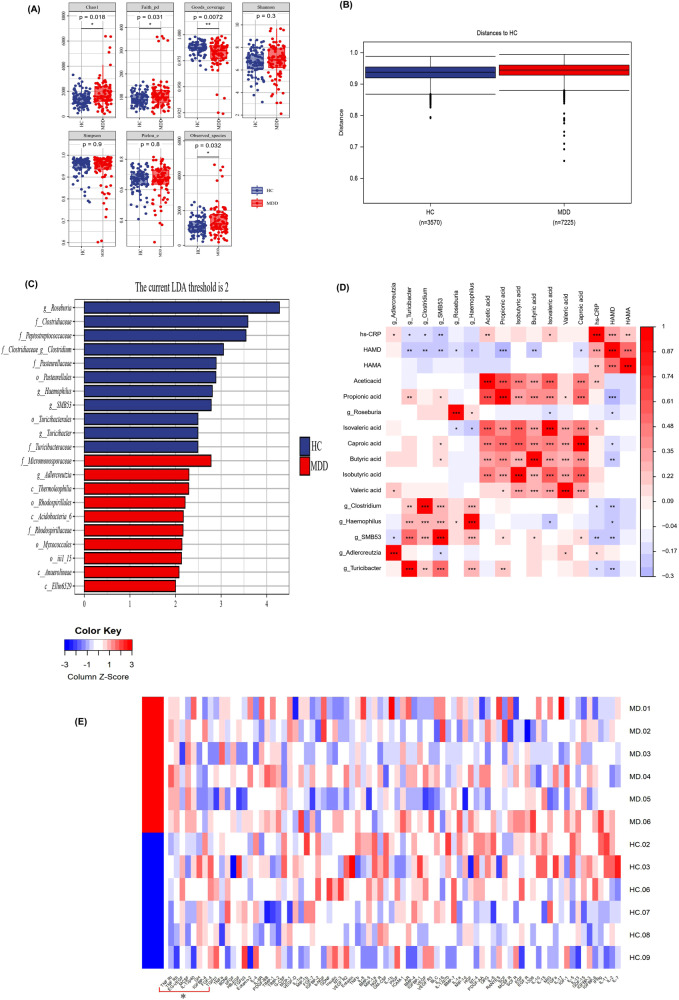
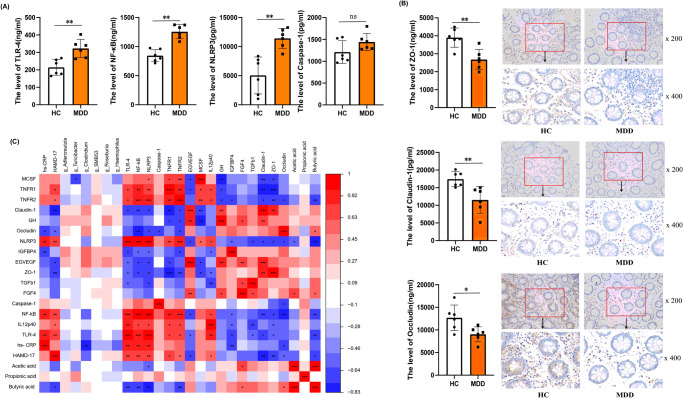
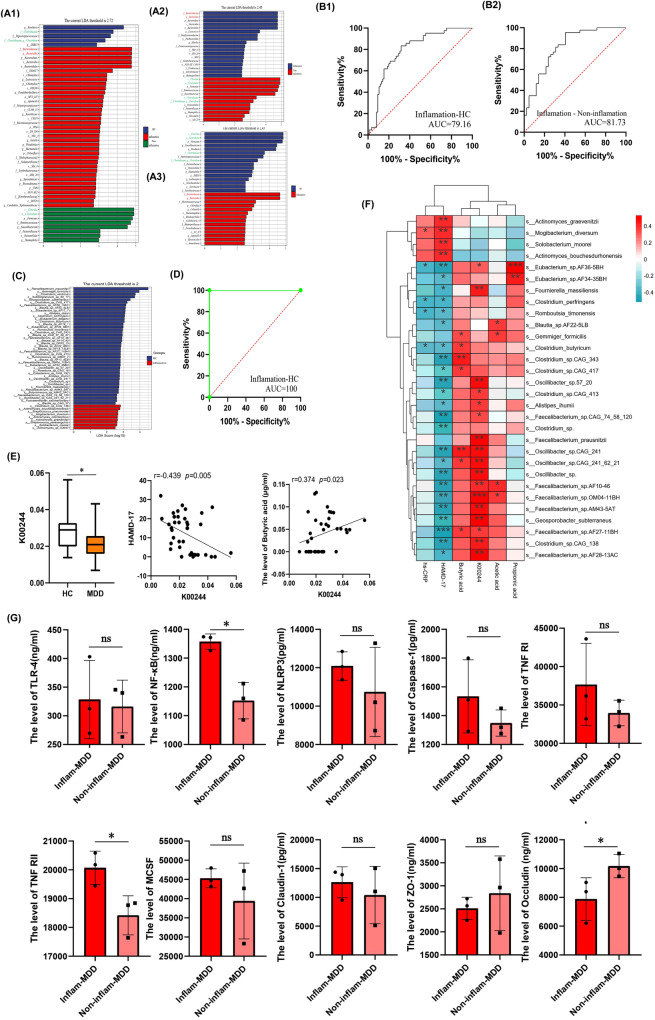
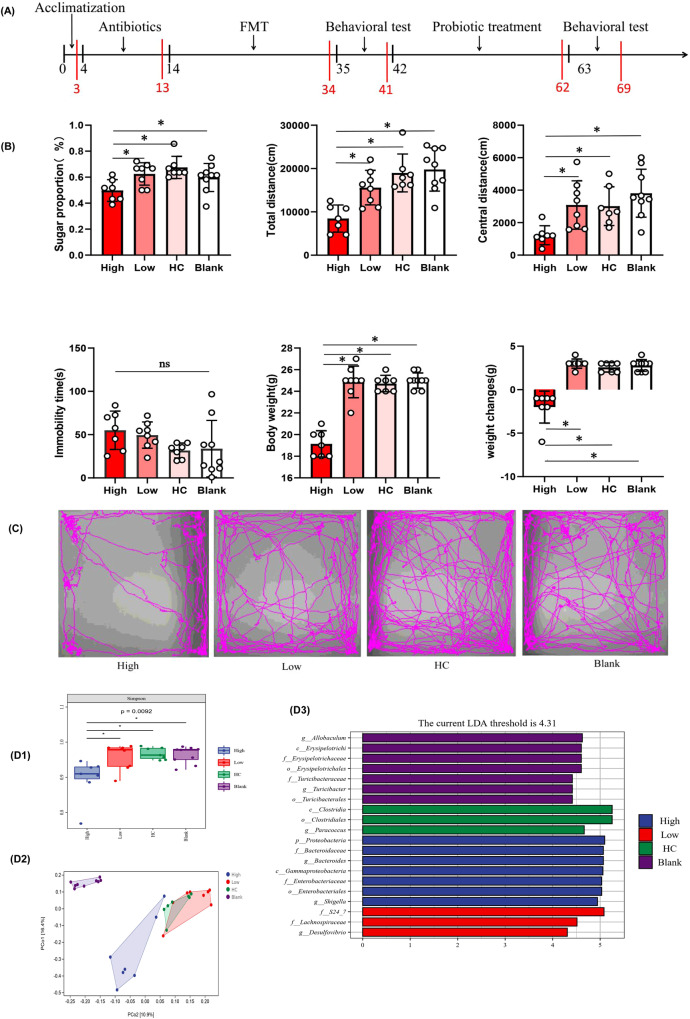
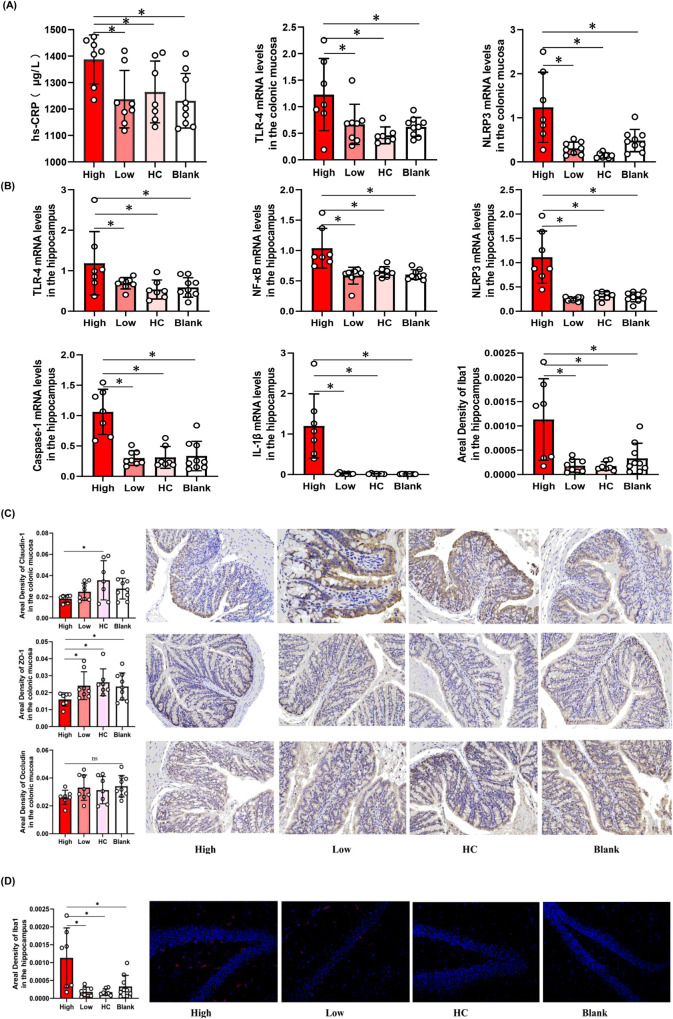
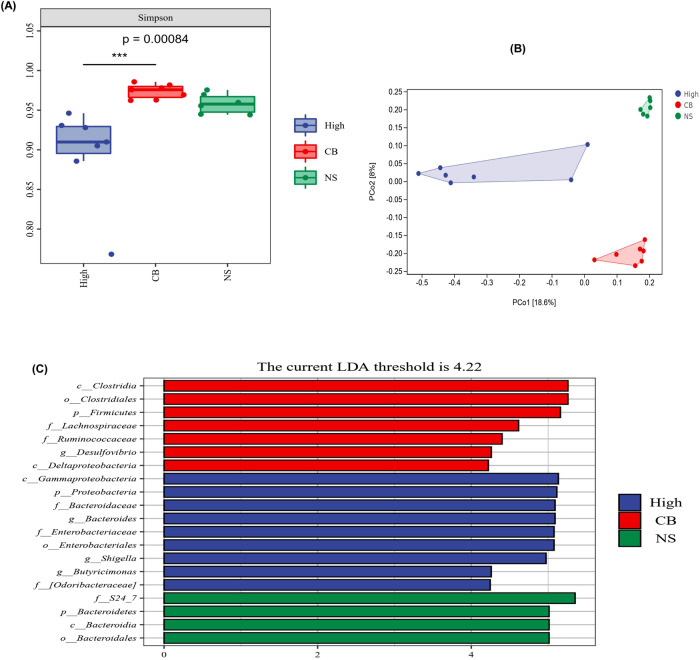
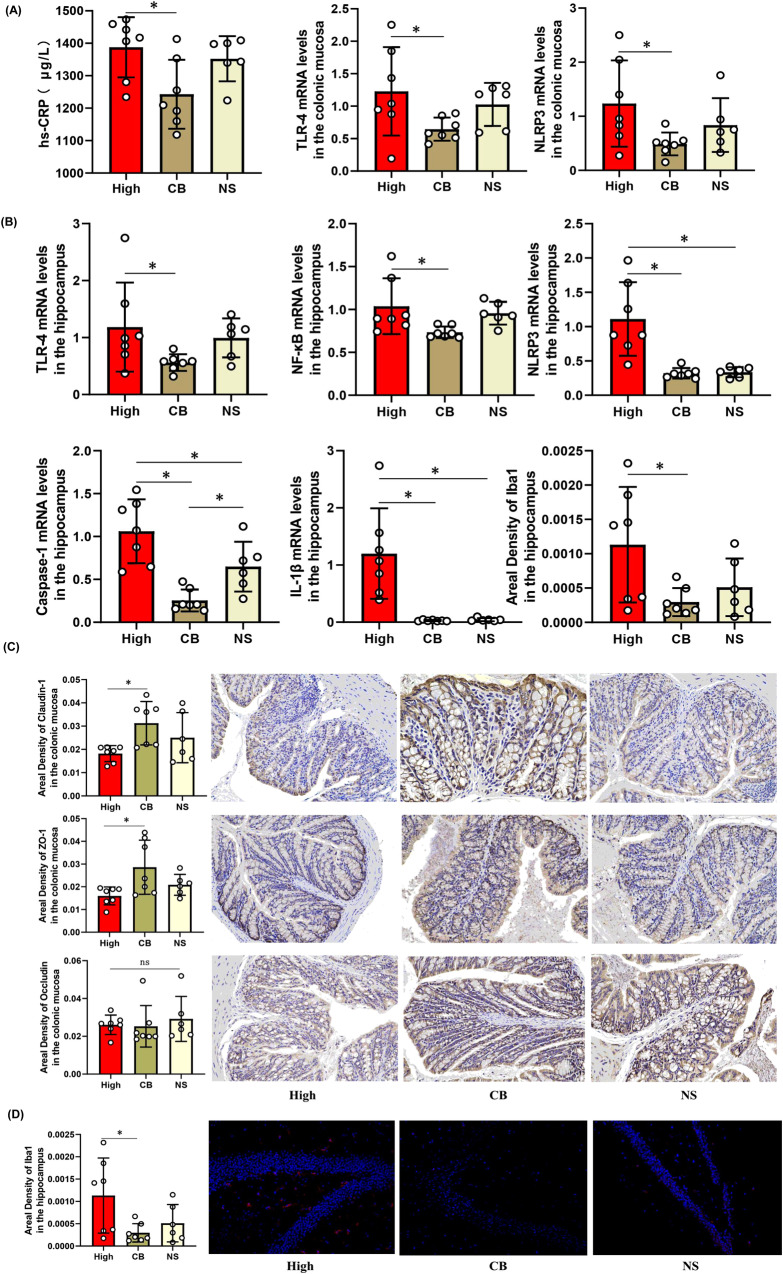
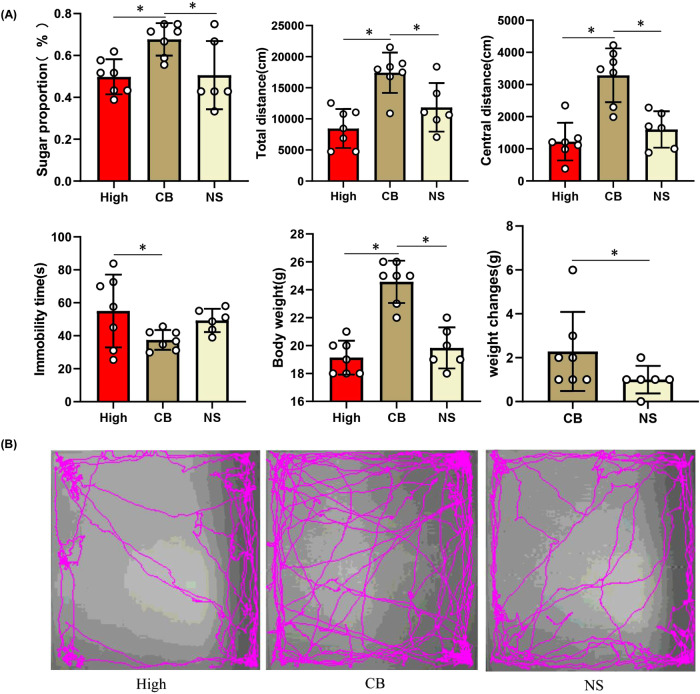
Inflammatory depression is a treatment-resistant subtype of depression. A causal role of the gut microbiota as a source of low-grade inflammation remains unclear. Here, as part of an observational trial, we first analyze the gut microbiota composition in the stool, inflammatory factors and short-chain fatty acids (SCFAs) in plasma, and inflammatory and permeability markers in the intestinal mucosa of patients with inflammatory depression (ChiCTR1900025175). Gut microbiota of patients with inflammatory depression exhibits higher Bacteroides and lower Clostridium, with an increase in SCFA-producing species with abnormal butanoate metabolism. We then perform fecal microbiota transplantation (FMT) and probiotic supplementation in animal experiments to determine the causal role of the gut microbiota in inflammatory depression. After FMT, the gut microbiota of the inflammatory depression group shows increased peripheral and central inflammatory factors and intestinal mucosal permeability in recipient mice with depressive and anxiety-like behaviors. Clostridium butyricum administration normalizes the gut microbiota, decreases inflammatory factors, and displays antidepressant-like effects in a mouse model of inflammatory depression. These findings suggest that inflammatory processes derived from the gut microbiota can be involved in neuroinflammation of inflammatory depression.


Conflict of interest statement

The authors declare no competing interests.

Figures

Fig. 1
Fig. 1. Gut microbial composition, short chain fatty acids (SCFAs) and inflammatory indicators of patients with MDD.
A Alpha-diversity analysis exposed that the Chao index, Faith’s Phylogenetic Diversity (PD), Observed species were higher in MDD patients (n = 85) than in HCs (n = 85), The Good’s coverage was lower in MDD patients (P < 0.05). Two-sample T test was used. Data are presented as mean values with SD. Box plots indicate median and interquartile range. B Beta diversity analysis uncovered that the difference between MDD patients (n = 85) and in HCs (n = 85) was larger than the difference within group by the permanova analysis based on Jaccard dissimilarity (P = 0.0006). Permutation test was used. Data are presented as mean values with SD. Box plots indicate median and interquartile range. The upper and lower whiskers indicate minima and maxima. C A linear discriminant analysis (LDA) effect size (LEfSe) showed that at the family level, the relative abundance of Micromonosporaceae and Rhodospirillaceae was significantly higher in MDD patients, however, the amount of Clostridiaceae, Peptostreptococcaceae, Pasteurellaceaewas and Turicibacteraceae significantly higher in HCs. At the genus level, the relative abundance of Adlercreutzia was significantly higher in MDD patients, however, the abundance of Clostridium, Roseburia, Haemophilus, SMB53, and Turicibacter were much higher in HCs. Blue and red colors represent HCs and MDD, respectively. D The correlation analysis were performed among different genus of gut bacteria, short chain fatty acids (SCFAs), hs-CRP and severity of depression and anxiety. It was found the relative abundance of Clostridium, Roseburia, Haemophilus, SMB53, and Turicibacter were the level of Acetic acid, Propionic acid and Butyric acid were positively correlated with Propionic acid and Butyric acid, and negatively correlated with hs-CRP and the total score HAMD-17 in all subjects (P < 0.05). The hs-CRP was positively correlated with the total score HAMD-17 and HAMA (P < 0.05). Pearson correlation analyses were implemented with FDR correction. The red and blue of the table represent positive and negative correlations respectively. P-value is marked as follows: ***P ≤ 0.001; **P ≤ 0.01; *P ≤ 0.05. E Different cytokine in intestinal mucosa between MDD (n = 6) and HCs (n = 6). The antibody cytokine array consisting of 80 inflammatory factors was used to screen for differential intestinal mucosal inflammatory factors between MDD and HCs. The heatmap shows that tumor necrosis factor alpha-R1 (TNF-R1), TNF-R2, Macrophage Colony Stimulating Factor (MCSF) and interleukin 12 (IL-12) are overexpressed, however, Growth Hormone (GH), Fibroblast Growth Factors 4 (FGF-4), Transforming Growth Factor 1β (TGF-1β) and Endocrine Gland-derived Vascular Endothelial Growth Factor (EG-VEGF) that involved in intestinal mucosal repair are underexpressed in MDD patients compared to HCs. The data was analyzed by moderated t-statistics and corrected by the Benjamini–Hochberg method. All statistical tests are two-sided. Source data are provided as a Source Data file.
Fig. 2
Fig. 2. Differences in intestinal mucosal inflammatory factors and permeability biomakers between MDD (n = 6) and HCs (n = 6).
A ELISA was used to measure related markers and found TLR-4 (P = 0.0033), NF-κB (P = 0.0014), NLRP3 (P = 0.0017) were increased in MDD group. Two-sample T test was used. Data are presented as mean values with SD. ns indicates non-significant. Scatter plot indicate median and error range. The upper and lower whiskers indicate median±SD. B The permeability biomakers such as Claudin-1 (P = 0.0070), ZO-1 (P = 0.0030), Occludin (P = 0.0210) were decreased that was confirmed by immunohistochemistry (×200 and ×400 magnificent). Two-sample T test was used. Data are presented as mean values with SD. Scatter plot indicate median and error range. The upper and lower whiskers indicate median ± SD. C The correlation analysis were performed and found the relative abundance of Clostridium were negatively correlated with the level of MCSF and hs-CRP; The inflammatory factor were negatively correlated with the permeability biomarkers (Claudin-1, ZO-1, Occludin) and SCFAs (Acetic acid, Propionic acid, Butyric acid); and positively correlated with the total score of HAMD-17. The Butyric acid was positively correlated with Occludin and negatively correlated with TLR-4, NF-κB, NLRP3, TNFR2 and HAMD-17. The Claudin-1 was positively correlated with intestinal mucosal repair markers such as GH and EG-VEGF. Pearson correlation analyses were implemented with FDR correction. The red and blue of the table represent positive and negative correlations respectively. P-value is marked as follows: ***P ≤ 0.001; **P ≤ 0.01; *P ≤ 0.05. All statistical tests are two-sided. Source data are provided as a Source Data File.
Fig. 3
Fig. 3. Gut microbiota characteristics, intestinal mucosal inflammatory factors and permeability biomakers of inflammatory depression.
A To clarify the characteristics of gut microbiota in inflammatory depression, The LEfSe analysis was performed among three groups and found that compared with Non-inflammatory depression and HCs, the relative abundance of Bacteroidaceae and Bacteroides were significantly higher, Clostridiaceae and Clostridium were lower in Inflammatory depression patientsl. B To determine the biomarkers for discriminating between inflammatory depression and HC, between inflammatory depression and Non-inflammatory depression at the genus level, the receiver operating characteristic (ROC) curve were made to by combining all different genus. The ROC analysis showed that the AUC was 81.73% and 79.16% separately. C To further identify the specific microbiota at species level and guide treatment, the shotgun metagenomic sequencing was used for gut microbiota of inflammatory depression (n = 20) and HCs (n = 20). We performed LEfSe analysis and found at the species level, the relative abundance of 43 species was significantly lower in the inflammatory depression group, and 9 bacterial species were enriched in Inflammatory depression. D To make accurate diagnostic models for inflammatory depression, ROC curve were made to by combining all different species and found the AUC was 100%. E The different Kyoto Encyclopedia of Genes and Genomes (KEGG) orthology (KO) analysis found the expression of K00244 (fumarate reductase A, an enzyme involved in the butanoate metabolism) was significantly decreased in Inflammatory depression group (n = 20). Two-sample T test was used. Data are presented as mean values with SD. Box plots indicate median and interquartile range. The upper and lower whiskers indicate minima and maxima. The correlation analysis found the K00244 abundance was significant negative correlated with the HAMD-17 scores (r = −0.439, P = 0.005), and positive correlated with the level of butyric acid (r = 0.374, P = 0.023). Pearson correlation analyses were implemented. F The correlation analysis showed that the relative abundance of abnormal gut microbiota were associated with hs-CRP, SCFAs, K00244, HAMD-17. Red and blue color represent positive correlation and negative correlation, respectively. Pearson correlation analyses were implemented with FDR correction. P-value is marked as follows: ***P ≤ 0.001; **P ≤ 0.01; *P ≤ 0.05. G The inflammatory factors and permeability biomakers of intestinal mucosa in inflammatory depression(n = 3). Compared with Non-inflammatory depression group (n = 3), the inflammatory factor TLR-4 (P = 0.812), NF-κB (P = 0.018), NLRP3 (P = 0.392), Caspase-1 (P = 0.302), TNF-RI (P = 0.318), TNF-RII (P = 0.033), MCSF (P = 0.371), were increased and the permeability biomakers such as ZO-1 (P = 0.537), Occludin (P = 0.048) were decreased in intestinal mucosa of inflammatory depression. Two-sample T test was used. Data are presented as mean values with SD. Scatter plot indicate median and error range. The upper and lower whiskers indicate median± SD. P-value is marked as follows: *P ≤ 0.05. ns indicates non-significant. All statistical tests are two-sided. Source data are provided as a Source Data File.
Fig. 4
Fig. 4. Behavioral characteristics and gut microbiota composition in mouse model of inflammatory depression.
A The Schematic diagram of mouse treatment and behavioral testing. Mice were given a cocktail of antibiotics to eliminate gut microbiota and were recolonized with the fecal microbiota of Inflammatory depression patients (High-inflammatory group), Non-inflammatory depression patients (Low-inflammatory group), HCs (HC group) and normal saline (NS) (Blank group) respectively. Then High-inflammatory group mice were given the probiotics clostridium butyricum (CB) for 21 days. A series of behavioral tests were carried out 24 h after the last fecal microbiota transplantation or probiotic intervention. B Behavioral comparisons among recipient mice receiving the gut microbiota suspension from Inflammatory depression patients (n/mice = 7), Non-inflammatory depression patients (n/mice = 8), HCs (n/mice = 7) and normal saline (n/mice = 9). The mice in the High inflammatory group consumed fewer sucrose in the sucrose preference test (SPT) (P = 0.012). In the open-field test (OFT), mice in the High-inflammatory group showed decreased activity (fewer total distance traveled) (P = 0.001) and increased anxiety (reduced travel in the exposed center region away from the walls) (P = 0.004). Similarly, the duration of immobility in the tail suspension test (TST) was increased in the High-inflammatory group mice (P = 0.061). The body weight of mice was significantly lower and the weight change of mice in the high inflammatory group was also smaller than that in other groups (P = 0.001). One-way ANOVA test for multiple comparisons with Tukey’s test for post hoc corrections. Data are presented as mean values with SD. Scatter plot indicate median and error range. The upper and lower whiskers indicate median ± SD. P-value is marked as follows: *P ≤ 0.05. ns indicates non-significant. C The movement trajectory of mice in OFT. D1 Alpha-diversity analysis exposed that the Simpson index were lower in High inflammatory group (n = 7) than that in the Low-inflammatory group (n = 8), HC group (n = 7) and Blank group (n = 9) (P = 0.0092). One-way ANOVA test for multiple comparisons with Tukey’s test for post hoc corrections. Data are presented as mean values with SD. Box plots indicate median and interquartile range. P-value is marked as follows: *P ≤ 0.05. D2 Beta diversity analysis uncovered a notable difference in bacterial community composition among High inflammatory group, Low-inflammatory group, HC group and Blank group as found by the PCoA plot based on Jaccard dissimilarity. D3 LEfSe analysis showed that the relative abundance of Bacteroidaceae, Bacteroides was significantly higher in the High-inflammatory group; however, the amount of Clostridia and Clostridiales was significantly higher in HC group. All statistical tests are two-sided. Source data are provided as a Source Data file.
Fig. 5
Fig. 5. Elevated inflammatory factors in the High inflammatory group.
A The expression of TLR-4 (P = 0.006), NLRP3 (P < 0.001) in the intestinal mucosa and the concentration of hs-CRP (P = 0.028) in the serum were elevated in the High inflammatory group (n = 7) compared to the Low-inflammatory group (n = 8), HC group (n = 7), Blank group (n = 9). B The expression of TLR-4 (P = 0.023), NF-κB (P < 0.001), NLRP3 (P < 0.001), Caspase-1 (P < 0.001) and the area density of Iba1 (P = 0.001) in the brain were increased in the High inflammatory group. C The amount and area density of permeability biomakers such as Claudin-1 (P = 0.043), ZO-1 (P = 0.003) were decreased in the High inflammatory by ELISA and immunohistochemistry (×400 magnificent). The area density of Occludin tended to decrease, but there was no statistical difference (P = 0.254). D The amount and branch of microglia in hippocampus were increased in the High inflammatory group. One-way ANOVA test for multiple comparisons with Tukey’s test for post hoc corrections. Data are presented as mean values with SD. Scatter plot indicate median and error range. The upper and lower whiskers indicate median± SD. P-value is marked as follows: *P ≤ 0.05. ns indicates non-significant. All statistical tests are two-sided. Source data are provided as a Source Data file.
Fig. 6
Fig. 6. Effects of probiotics (Clostridium butyricum) on gut microbiota of the mouse model of inflammatory depression.
A Alpha-diversity analysis exposed that CB increased the Simpson index (n/High inflammatory group = 7, n/CB group = 7, n/NS group = 6). One-way ANOVA test for multiple comparisons with Tukey’s test for post hoc corrections. Data are presented as mean values with SD. Box plots indicate median and interquartile range. P-value is marked as follows: ***P ≤ 0.001. B Beta diversity analysis uncovered the bacterial community composition was notably different between High inflammatory group (n = 7) and CB group (n = 7). C LEfSe analysis showed that the abundance of Clostridia and Clostridiales were increased and that of Bacteroidaceae, Bacteroides were decreased in CB group (n = 7). All statistical tests are two-sided. Source data are provided as a Source Data file. CB Clostridium butyricum, NS Normal saline.
Fig. 7
Fig. 7. Effects of probiotics (CB) on inflammatory factors of the mouse model of inflammatory depression.
A The CB decreased the expression of TLR-4 (P = 0.018), NLRP3(P = 0.023) in the intestinal mucosa and the concentration of hs-CRP in the serum (P = 0.024). (n/High inflammatory group = 7, n/CB group = 7, n/NS group = 6). B The CB decreased the expression of TLR-4(P = 0.048), NF-κB(P = 0.041), NLRP3(P < 0.001) and Caspase-1(P < 0.001) in the brain. C The amount and area density of permeability biomakers such as Claudin-1(P = 0.030), ZO-1(P = 0.026) were increased in the CB group by ELISA and immunohistochemistry (×400 magnificent).The area density of Occludin tended to increase, but there was no statistical difference (P = 0.750). D The area density, amount and branch of microglia in hippocampus were decreased in the CB group (P = 0.034). One-way ANOVA test for multiple comparisons with Tukey’s test for post hoc corrections. Data are presented as mean values with SD. Scatter plot indicate median and error range. The upper and lower whiskers indicate median ± SD. P-value is marked as follows: *P ≤ 0.05. ns indicates non-significant. All statistical tests are two-sided. Source data are provided as a Source Data file.
Fig. 8
Fig. 8. Effects of probiotics (CB) on depression-like behaviors of the mouse model of inflammatory depression.
A The mice in the CB group (n = 7) consumed more sucrose in the SPT than that in High-inflammatory group (n = 7) and NS group (n = 6) (P = 0.013). In the OFT, mice in the CB group showed increased activity (longer total distance traveled) (P = 0.001) and decreased anxiety (induced travel in the exposed center region away from the walls) (P < 0.001). Similarly, the duration of immobility in the TST was decreased in the CB group mice (P = 0.048). The body weight of mice was significantly increased and the weight change of mice was also more in the CB group (P < 0.001). One-way ANOVA test for multiple comparisons with Tukey’s test for post hoc corrections. Data are presented as mean values with SD. Scatter plot indicate median and error range. The upper and lower whiskers indicate median ± SD. P-value is marked as follows: *P ≤ 0.05. ns indicates non-significant. B The movement trajectory of mice in OFT. All statistical tests are two-sided. Source data are provided as a Source Data File.

References

    1. Lasselin J. Is inflammation-associated depression atypical depression. Brain Behav. Immun. 2020;87:193–194. doi: 10.1016/j.bbi.2020.01.008. - DOI - PubMed
    1. Maes M, et al. Increased serum interleukin-1-receptor-antagonist concentrations in major depression. J. Affect Disord. 1995;36:29–36. doi: 10.1016/0165-0327(95)00049-6. - DOI - PubMed
    1. Lasselin, J., Lekander, M., Benson, S., Schedlowski, M. & Engler, H. Sick for science: experimental endotoxemia as a translational tool to develop and test new therapies for inflammation-associated depression. Mol. Psychiatry26, 3672–3683 (2020). - PMC - PubMed
    1. Dantzer R, O’Connor JC, Freund GG, Johnson RW, Kelley KW. From inflammation to sickness and depression: when the immune system subjugates the brain. Nat. Rev. Neurosci. 2008;9:46–56. doi: 10.1038/nrn2297. - DOI - PMC - PubMed
    1. Köhler CA, et al. Peripheral cytokine and chemokine alterations in depression: a meta-analysis of 82 studies. Acta Psychiatr. Scand. 2017;135:373–387. doi: 10.1111/acps.12698. - DOI - PubMed

Substances