. 2024 Apr 8;15(1):3034.
doi: 10.1038/s41467-024-47266-9.

Stress increases hepatic release of lipocalin 2 which contributes to anxiety-like behavior in mice

Affiliations

Stress increases hepatic release of lipocalin 2 which contributes to anxiety-like behavior in mice

Lan Yan et al. Nat Commun. .

Abstract

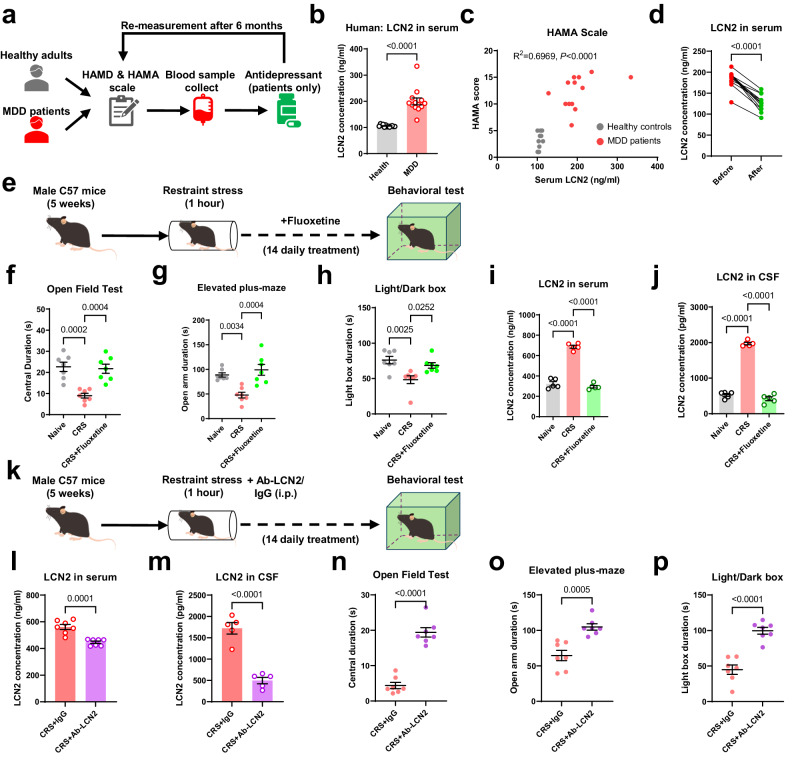
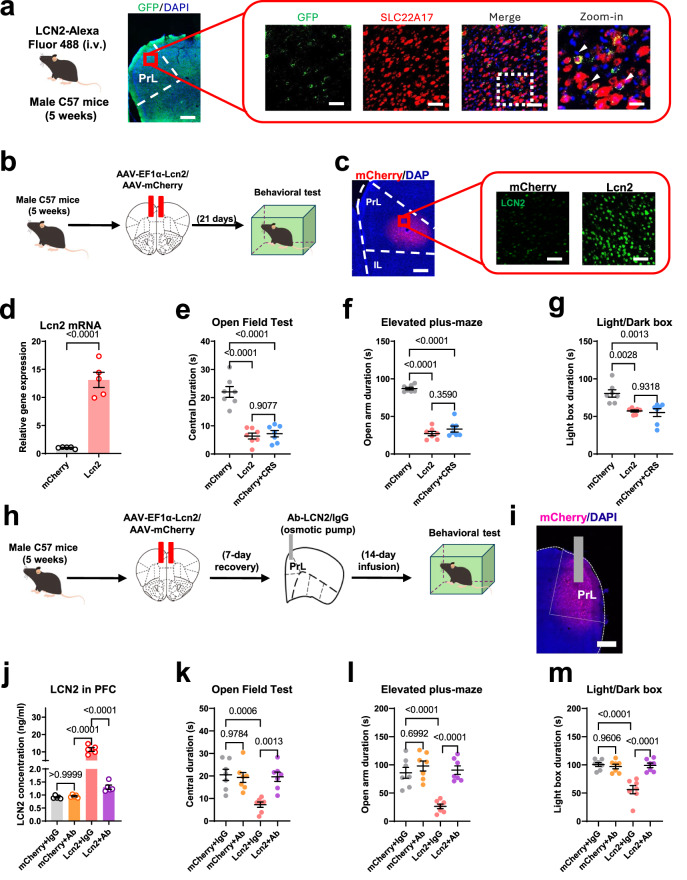
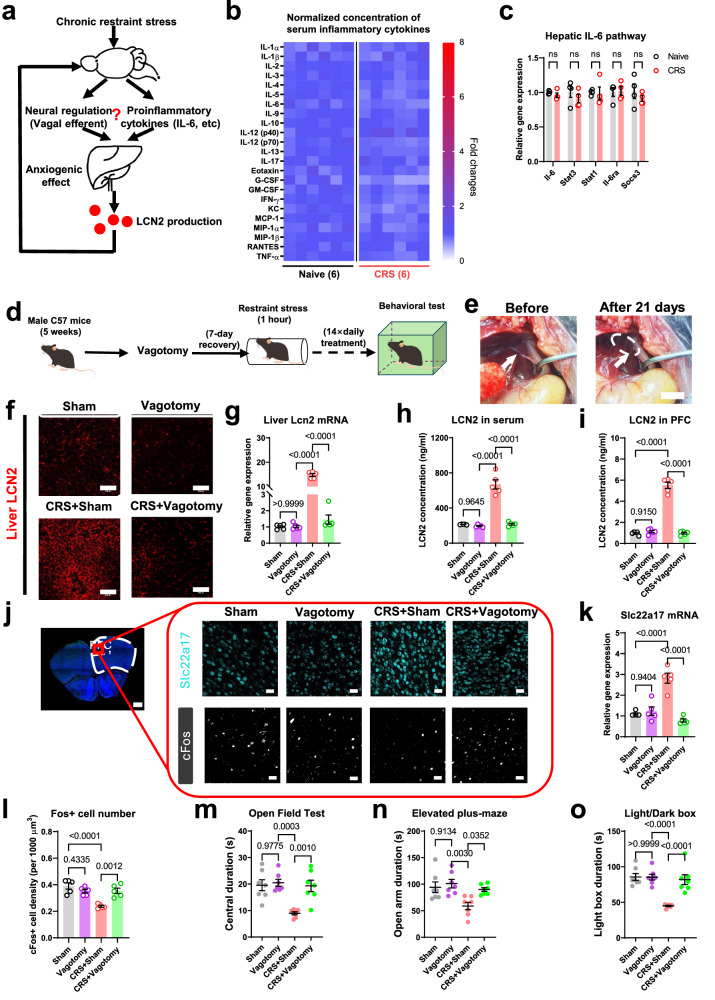
Chronic stress induces anxiety disorders via both neural pathways and circulating factors. Although many studies have elucidated the neural circuits involved in stress-coping behaviors, the origin and regulatory mechanism of peripheral cytokines in behavioural regulation under stress conditions are not fully understood. Here, we identified a serum cytokine, lipocalin 2 (LCN2), that was upregulated in participants with anxiety disorders. Using a mouse model of chronic restraint stress (CRS), circulating LCN2 was found to be related to stress-induced anxiety-like behaviour via modulation of neural activity in the medial prefrontal cortex (mPFC). These results suggest that stress increases hepatic LCN2 via a neural pathway, leading to disrupted cortical functions and behaviour.


Conflict of interest statement

All authors declare no competing interests.

Figures

Fig. 1
Fig. 1. Circulating LCN2 is related with anxiety disorders in both humans and mouse model.
a Experimental design of human cohort study, in which both healthy and major depressive disorder (MDD) patients were recruited for anxiety scaling and serum collection. b MDD patients exhibited higher blood LCN2 concentrations compared to healthy controls. Two-sided unpaired student t-test, t(24) = 7.106, P < 0.0001. c Serum LCN2 level is positively related with the severity of anxiety, as displayed by Hamilton Anxiety Scale (HAMA). Simple linear regression, R2 = 0.6969, P < 0.0001. N = 13 individuals in each group, in (b, c). d After 3-month antidepressant treatment, 13 patients showed decreased serum LCN2 levels. Two-sided paired t-test, t(12) = 11.92, P < 0.0001. e Time schedule of chronic restraint stress (CRS) paradigm. f CRS treatment decreased time spent in the central arena, and fluoxetine treatment recovered normal behaviors. One-way ANOVA, F(2,18) = 16.22, P < 0.0001. g CRS Mice displayed avoidance toward the open arm during the elevated plus-maze task, and fluoxetine treatment attenuated such behavioral deficits. One-way ANOVA, F(2,18) = 12.77, P = 0.0004. h CRS decreased preference of the mouse in the light box. One-way ANOVA, F(2,18) = 8.385, P = 0.0027. N = 7 mice in each group, in (f, h). i CRS mice presented significantly higher serum LCN2 levels compared to naïve ones, whilst fluoxetine treatment suppressed LCN2 concentration. One-way ANOVA, F(2,12) = 175.1, P < 0.0001. j LCN2 concentration in cerebrospinal fluid (CSF) followed similar patterns as those of serum samples. One-way ANOVA, F(2,18) = 401.4, P < 0.0001. N = 5 mice in each group, in (i, j). k Time schedules of peripheral LCN2 blockade assay, during which CRS mice received daily injection of polyclonal antibody against LCN2 for 14 days. l Antibody infusion decreased serum LCN2 levels of CRS mice. Two-sided, unpaired student t-test, t(12) = 5.499, P = 0.0001. N = 7 mice in each group. m LCN2 neutralization further inhibited CSF level of LCN. Two-sided, unpaired student t-test, t(8) = 7.905, P < 0.0001. N = 5 mice in each group. n Antibody infusion increased time spent in the central arena of open field in CRS mice. Two-sided, unpaired student t-test, t(12) = 9.378, P < 0.0001. o Antagonist of LCN2 pathway also recovered normal open arm duration in CRS individuals. Two-sided, unpaired student t-test, t(12) = 4.706, P = 0.0005. p The light-avoidance behavior deficit was recovered by peripheral LCN2 blockade. Two-sided, unpaired student t-test, t(12) = 5.776, P < 0.0001. N = 7 mice in each group, in (np). Exact P-values were indicated using Tukey’s post-hoc comparison in (fj). All data were presented as mean ± sem. Source data are provided as a Source Data file.
Fig. 2
Fig. 2. LCN2 acts in mPFC to direct anxiety-like behaviors.
a Intravenous injection of recombinant LCN2-Alxa Fluor 488 resulted in specific protein binding onto cells expressing SLC22A17 in prelimbic (PrL) region. Triplicated studies were performed. Scale bar, 200 μm on left, and 100 μm on right. b Schematic diagrams of LCN2 over-expression in mPFC. Mice received an AAV vector expressing Lcn2 gene. c Left panel, viral transfection site within prelimbic (PrL) region of mPFC. Right, LCN2 protein expression. Scale bar, 200 μm on left, and 100 μm on right. d Viral infection remarkably enhanced local gene expression of Lcn2. Two-sided unpaired t-test, t(8) = 8.953, P < 0.0001. N = 5 mice in each group. e As similar with CRS treatment, Lcn2 gene over-expression in mPFC resulted in lower time duration in the open field. One-way ANOVA, F(2,18) = 38.69, P < 0.0001. f Anxiety-like phenotypes were identified as lower time spent on the open arm in both AAV-LCN2 and CRS groups. One-way ANOVA, F(2,18) = 121.0, P < 0.0001. g Avoidance toward the light box were observed with LCN2 transfection. One-way ANOVA, F(2,18) = 11.19, P = 0.0007. N = 7 mice in each group in (eg). h Experimental outlines for LCN2 blocking assay, in which Ab-LCN2 was directly applied on mouse mPFC with over-expression of Lcn2 gene. i Fluorescent image showed the infection of AAV-LCN2. Triplicated studies were performed. Scale bar, 200 μm. j Ab-LCN2 remarkably decreased LCN2 protein contents in mPFC. One-way ANOVA, F(3,16) = 87.50, P < 0.0001. N = 5 mice in each group. k Ab-LCN2 infusion prevented the behavioral deficits induced by mPFC-specific LCN2 over-expression. One-way ANOVA, F(3,24) = 9.571, P = 0.0002. l The abnormal behavior in the elevated plus-maze induced by AAV-LCN2 was rescued after Ab-LCN2 administration. One-way ANOVA, F(3,24) = 17.60, P < 0.0001. m The light-avoidance deficit was also prevented under LCN2 neutralization. One-way ANOVA, F(3,24) = 18.88, P < 0.0001. N = 7 mice in each group in (km). Exact P-values were indicated using Tukey’s post-hoc comparison in (em). All data were presented as mean ± sem. Source data are provided as a Source Data file.
Fig. 3
Fig. 3. LCN2 disrupted mPFC neural activity.
a Schematics of in vivo 2-photon calcium imaging, with co-infection of AAV-LCN2 and GCaMP6s into mouse mPFC. b Left, imaging window under bright-field microscope. Middle and right, co-expression of LCN2 and GCaMP6s. Triplicated studies were performed. Scale bar, 250 μm on left, and 100 μm. c Heatmap showing calcium activities of pyramidal neurons (PNs) during the 300-s imaging period. Color-coded data were normalized and presented as z-score. A total of 30 neurons (from 4 animals) were displayed. d LCN2 over-expression remarkably suppressed integrated calcium activities. Nonparametric Kolmogorov–Smirnov test D = 0.7750, P < 0.0001. e Decreased amplitudes of single calcium spike. Nonparametric Kolmogorov–Smirnov test D = 0.5959, P < 0.0001. f Elevated frequency of cortical pyramidal neurons after LCN2 transfection. Nonparametric Kolmogorov–Smirnov test D = 0.3000, P = 0.0015. n = 80 neurons (from 4 animals) in each group in (df). g Quantification of Slc22a17 and Mc4r gene in mPFC. Two-sided unpaired t-test, Slc22a17: t(8) = 8.394, P < 0.0001; Mc4r: t(8) = 1.210, P = 0.2610. N = 5 mice each group. h Expression of SLC22A17 in mPFC neurons (NeuN+). Scale bar, 100 μm. i Left, most of SLC22A17 proteins were expressed on neurons. Right, the number of SLC22A17+ neurons between naïve and CRS group. Two-sided unpaired t-test, t(12) = 15.22, P < 0.0001. N = 7 mice per group. j Schematic illustration of in vivo fiber photometry recording on the elevated plus-maze under Slc22a17 gene knockdown. k Infection of shRNA and GCaMP6s expressing viruses in mPFC. Triplicated studies were performed. Scale bar, 200 μm on left, and 100 μm on right. l Heatmaps showing calcium activities when the mouse entered into the open arm from the closed arm. Calcium transients were normalized and shown as z-score, and each recording window covered 2 s before and 10 s after the transition. Each line represented the averaged values of 10 trials from one mouse. m Attenuated calcium peak in CRS mice was reversed by knocking down Slc22a17 gene expression in mPFC. One-way ANOVA, F(3.24) = 17.74, P < 0.0001. N = 7 mice in each group. Exact P-values were indicated using Tukey’s post-hoc comparison in (m). All data were presented as mean ± sem. Source data are provided as a Source Data file.
Fig. 4
Fig. 4. Hepatic LCN2 elicits anxiety-like behaviors via neuromodulation of mPFC.
a Lcn2 gene transcript levels were remarkably increased in liver, spleen, and intestine tissues but not in brain or other organs in CRS mice. b LCN2 protein was up-regulated only in liver tissues by CRS. Multiple t-test was used for between-group comparison in a two-sided manner, with Holm–Šídák method for correction. N = 5 mice in each group in (a, b). c Outlines for liver-specific LCN2 knocking down assay, in which an shRNA targeting Lcn2 gene was introduced under hepatic promoter TBG. d Fluorescent image of liver tissues showing the viral infection site. Triplicated studies were performed. Scale bar, 500 μm. e Immunofluorescent staining of liver tissue slices for LCN2 expression. Scale bar, 50 μm. f shRNA transfection remarkably depressed Lcn2 gene expression in liver tissues of CRS mice. One-way ANOVA, F(3,16) = 25.83, P < 0.0001. g Serum LCN2 level was also suppressed by shRNA transfection in liver. One-way ANOVA, F(3,16) = 42.00, P < 0.0001. h Hepatic LCN2 silencing did not affect brain LCN2 levels in naïve mice but dampened the LCN2 surge under CRS. One-way ANOVA, F(3,16) = 477.1, P < 0.0001. N = 5 mice in each group in (fh). i Although knocking down Lcn2 gene in liver did not affect baseline anxiety level, it did help to antagonize CRS as to increase central zone duration. One-way ANOVA, F(3,24) = 18.00, P < 0.0001. j Hepatic LCN2 deficiency recovered normal open arm duration. One-way ANOVA, F(3,24) = 25.94, P < 0.0001. k Light box avoidance behaviors in CRS animals were attenuated after hepatic LCN2 knocking down. One-way ANOVA, F(3,24) = 22.51, P < 0.0001. N = 7 mice in each group in (ik. l Left), imaging window of 2-photon microscopy. Middle and white, infection sites of GCaMP6s. Triplicated studies were performed. Scale bar, 200 μm and 100 μm. m Heatmaps of relative calcium transient strengths among all groups. Data were processed as z-score and were color-coded. n Although the blockade of liver Lcn2 gene expression decreased mPFC calcium level in naïve animals to some extents, it recovered normal neuronal activity in CRS group. Nonparametric Kruskal–Wallis test statistic = 140.7, P < 0.0001. o Liver Lcn2 gene knockdown also re-elevated calcium peak values of mPFC neurons in CRS mice. Nonparametric Kruskal-Wallis test = 101.3, P < 0.0001. p Distribution of calcium transient frequency among all groups. n = 80 neurons (from 4 animals) in each group in (np). Exact P-values were indicated using Tukey’s post-hoc comparison in (fk), and Dunn’s multiple comparison test in (n, o). All data were presented as mean ± sem. Source data are provided as a Source Data file.
Fig. 5
Fig. 5. Vagal efferent pathway evokes hepatic LCN2 to induce anxiety disorders.
a Theoretical model of pathways regulating liver LCN2 biosynthesis. b Relative concentrations of major serum inflammatory cytokines were unchanged between naïve and CRS mice. N = 6 mice in each group. c Undisturbed signaling pathway of IL-6 in hepatic tissues under CRS. N = 4 mice in each group. Stat1, signal transducer and activator of transcription 1; Il-6ra, interleukin-6 receptor alpha; Socs3, suppressor of cytokine signaling 3. Multiple t-test (in two-sided manner) was used for between-group comparison, with Holm–Šídák method for correction. d Timeline for vagotomy assay. e The surgical site for subdiaphragmatic vagotomy, showing the separated and truncated vagal nerves before and at 21 days after dissection. f Immunofluorescent staining for liver LCN2 expression after vagotomy. Scale bar, 100 μm. g Liver Lcn2 gene transcript levels were suppressed by vagotomy under CRS but not in naïve condition. One-way ANOVA, F(3,16) = 400.4, P < 0.0001. h Vagotomy did not change basal level of LCN2 but helped to relive over-expression of LCN2 in serum under CRS. One-way ANOVA, F(3,16) = 73.68, P < 0.0001. i LCN2 levels in mPFC were also attenuated by vagotomy under CRS. One-way ANOVA, F(3,16) = 179.1, P < 0.0001. j Immunofluorescent staining for SLC22A17 and cFos in PrL after vagotomy and CRS. Scale bars, 500 μm on left image, and 100 μm in right panels. k Vagotomy abolished the elevated expression of Slc22a17 gene in CRS but not in naïve animals. One-way ANOVA, F(3,16) = 30.09, P < 0.0001. l CRS mice showed recovery of cortical neuron activity by vagotomy. One-way ANOVA, F(3,16) = 14.48, P < 0.0001. N = 5 mice in each group in (gl). m Vagotomy did not affect baseline level of central zone duration, but antagonized anxiety-like behaviors in CRS animals. One-way ANOVA, F(3,24) = 12.21, P < 0.0001. n Avoidance toward the open arm in CRS group was attenuated by vagotomy. One-way ANOVA, F(3,24) = 13.92, P < 0.0001. o The duration in the light box of CRS mice was recovered after vagotomy. One-way ANOVA, F(3,24) = 24.18, P < 0.0001. N = 7 animals in each group in (mo). Exact P-values were indicated using Tukey’s post-hoc comparison in (go). All data were presented as mean ± sem. Source data are provided as a Source Data file.
Fig. 6
Fig. 6. DMX responses to stress and stimulates hepatic LCN2.
a Upper, Retro-tracing of liver-innerved nuclei by pseudo-rabies virus (PRV) system. Middle, viral injection sites in liver tissues. Lowe panels, transsynaptic expression of PRV particles in brain stem nuclei. Triplicated studies were performed. Scale bars, 500 μm on middle pane and 100 μm on lower panel. PSol parasolitary nucleus, Cu cuneate nucleus, ECu external cuneate nucleus, AP area postrema, ML medial lemniscus, PY pyramidal tract. b Neuronal activation profile of DMX under CRS. 12 N, hypoglossal nucleus. Scale bar, 100 μm. c Quantification of cFos activity showed more neuron activations in DMX not other nuclei after CRS. Multiple t-test (in two-sided manner) was used for between-group comparison, with Holm–Šídák method for correction. N = 7 mice in each group. d cFos activity of ChAT+ neurons in DMX of CRS mice. Two-sided unpaired t-test, t(8) = 7.598, P < 0.0001. N = 5 mice in each group. e Timelines for optogenetic activation of liver-innervating DMX neurons. f Viral infection sites within DMX. Triplicated studies were performed. Scale bar, 250 μm (left) and 25 μm (right). g Light stimulation induced hepatic LCN2 biosynthesis. One-way ANOVA, F(3,16) = 219.2, P < 0.0001. h Circulating LCN2 was also elevated upon DMX activation. One-way ANOVA, F(3,16) = 78.73, P < 0.0001. N = 5 mice per group in (g, h). i DMX activation induced the avoidance toward the central region of the open field in unstressed mice. One-way ANOVA, F(3,24) = 11.75, P < 0.0001. j DMX activation decreased time spent in the open arm of the elevated plus-maze. One-way ANOVA, F(3,24) = 20.93, P < 0.0001. k DMX activation led to lower preference toward the light box. One-way ANOVA, F(3,24) = 15.82, P < 0.0001. N = 7 mice per group in (ik). l Timelines for optogenetic inhibition of liver-innervating DMX neurons. m Viral infection site within DMX. Triplicated studies were performed. Scale bar, 250 μm (left) and 25 μm (right). n Light-mediated neuronal inhibition prevented hepatic LCN2 surge in CRS mice. One-way ANOVA, F(3,16) = 1357, P < 0.0001. o Circulating LCN2 in CRS-treated animals was also repressed upon DMX inhibition. One-way ANOVA, F(3,16) = 30.69, P < 0.0001. N = 5 mice per group in (n, o). p DMX inhibition rescued the avoidance toward the central region of the open field in CRS mice. One-way ANOVA, F(3,24) = 12.17, P < 0.0001. q DMX inhibition recovered normal time spent in the open arm of the elevated plus-maze. One-way ANOVA, F(3,24) = 13.92, P < 0.0001. r DMX inhibition recovered normal preference toward the light box of CRS mice. One-way ANOVA, F(3,24) = 20.54, P < 0.0001. N = 7 mice per group in (pr). Exact P-values were indicated using Tukey’s post-hoc comparison in (gr). All data were presented as mean ± sem. Source data are provided as a Source Data file.
Fig. 7
Fig. 7. DMX-vagal-hepatic pathway mediates anxiety-like behaviors.
a Experimental designs for the peripheral blockade of LCN2 under DMX activation. b Immunofluorescent staining for the neuronal activity. Scale bar, 100 μm. c Peripheral infusion of Ab-LCN2 did not affect the DMX activation upon CNO. One-way ANOVA, F(2,12) = 37.10, P < 0.0001. d Serum LCN2 surge by DMX activation was attenuated. One-way ANOVA, F(2,12) = 20.06, P = 0.0001. N = 5 mice in each group in (c, d). e LCN2 neutralization prevented anxiety-like behaviors under DMX activation. One-way ANOVA, F(2,18) = 10.61, P = 0.0009. f Avoidance toward the open arm after DMX-activation was rescued by Ab-LCN2. One-way ANOVA, F(2,18) = 44.92, P < 0.0001. g Duration in the light box was re-elevated by peripheral neutralization of LCN2. One-way ANOVA, F(2,18) = 33.61, P < 0.0001. N = 7 mice in each group in eg. h Experimental design for DMX inhibition assay. i Upper, viral infection site. Lower, cFos staining under CNO infusion. Scale bars, 500 μm in the upper left, 100 μm in upper right and lower panels. j CNO administration suppressed DMX activation under CRS. One-way ANOVA, F(3.16) = 46.66, P < 0.0001. k CRS-induced serum LCN2 peaks were attenuated by DMX inhibition. One-way ANOVA, F(3.16) = 98.20, P < 0.0001. N = 5 mice in each group in (j, k). l Decreased time spent in the central zone under CRS was reversed by DMX inhibition, which can be abolished following peripheral LCN2 administration. One-way ANOVA, F(3,24) = 29.53, P < 0.0001. m CRS-induced avoidance toward the open arm was attenuated under DMX inhibition and was reoccurred by LCN2 infusion. One-way ANOVA, One-way ANOVA, F(3,24) = 23.07, P < 0.0001. n Time spent in the light box was recovered by DMX inhibition and was impaired under LCN2 injection. One-way ANOVA, F(3,24) = 71.44, P < 0.0001. N = 7 mice in each group in (ln). Exact P-values were indicated using Tukey’s post-hoc comparison. All data were presented as mean ± sem. Source data are provided as a Source Data file.

References

    1. Mohammadi MR, et al. Generalized anxiety disorder: prevalence, predictors, and comorbidity in children and adolescents. J. Anxiety Disord. 2020;73:102234. doi: 10.1016/j.janxdis.2020.102234. - DOI - PubMed
    1. Bosman RC, et al. Prevalence and course of subthreshold anxiety disorder in the general population: A three-year follow-up study. J. Affect. Disord. 2019;247:105–113. doi: 10.1016/j.jad.2019.01.018. - DOI - PubMed
    1. Craske MG, Stein MB. Anxiety. Lancet. 2016;388:3048–3059. doi: 10.1016/S0140-6736(16)30381-6. - DOI - PubMed
    1. Calhoon GG, Tye KM. Resolving the neural circuits of anxiety. Nat. Neurosci. 2015;18:1394–1404. doi: 10.1038/nn.4101. - DOI - PMC - PubMed
    1. Zhou X, et al. Astrocyte, a promising target for mood disorder interventions. Front. Mol. Neurosci. 2019;12:136. doi: 10.3389/fnmol.2019.00136. - DOI - PMC - PubMed