

A deep learning approach for fast muscle water T2 mapping with subject specific fat T2 calibration from multi-spin-echo acquisitions
- PMID: 38589478
- PMCID: PMC11002020
- DOI: 10.1038/s41598-024-58812-2
A deep learning approach for fast muscle water T2 mapping with subject specific fat T2 calibration from multi-spin-echo acquisitions
Abstract
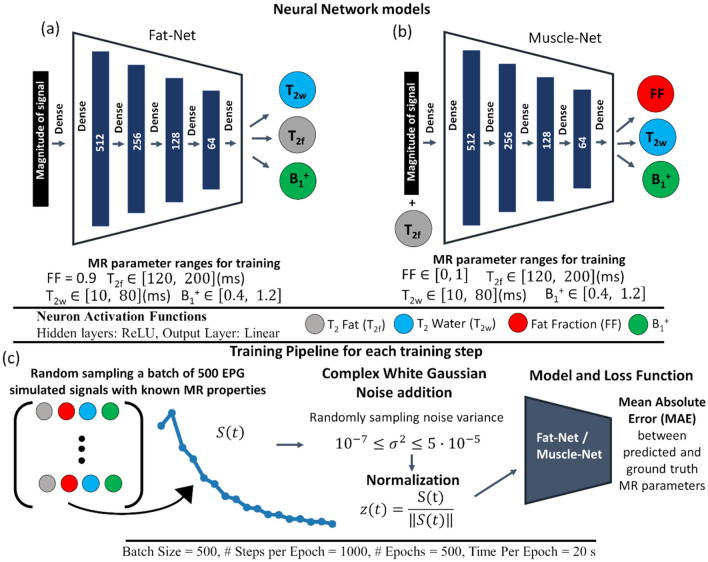
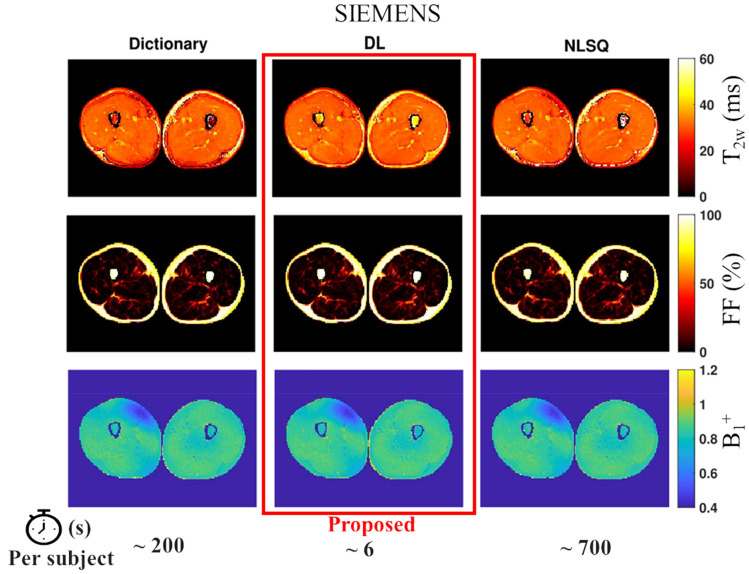
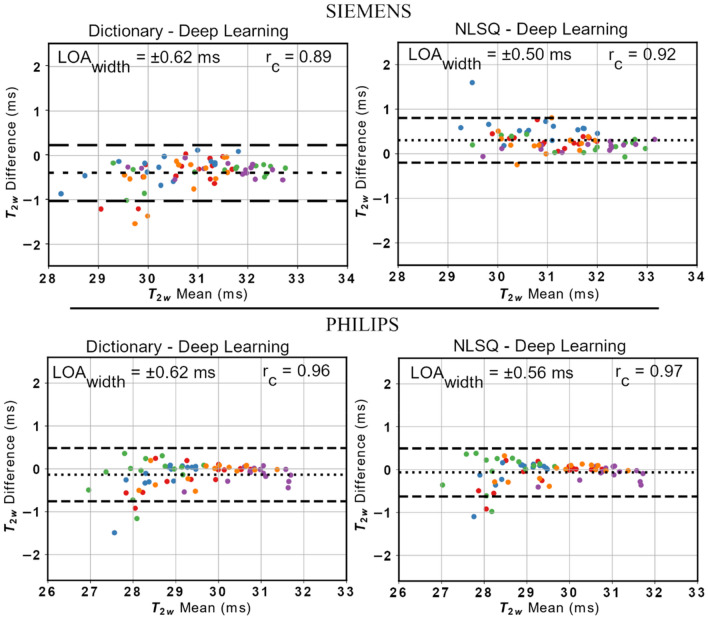
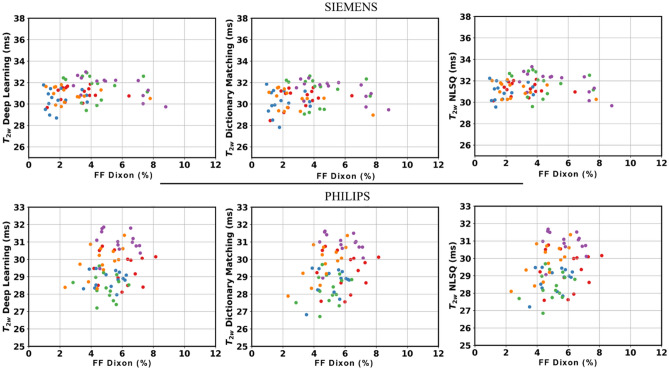
This work presents a deep learning approach for rapid and accurate muscle water T2 with subject-specific fat T2 calibration using multi-spin-echo acquisitions. This method addresses the computational limitations of conventional bi-component Extended Phase Graph fitting methods (nonlinear-least-squares and dictionary-based) by leveraging fully connected neural networks for fast processing with minimal computational resources. We validated the approach through in vivo experiments using two different MRI vendors. The results showed strong agreement of our deep learning approach with reference methods, summarized by Lin's concordance correlation coefficients ranging from 0.89 to 0.97. Further, the deep learning method achieved a significant computational time improvement, processing data 116 and 33 times faster than the nonlinear least squares and dictionary methods, respectively. In conclusion, the proposed approach demonstrated significant time and resource efficiency improvements over conventional methods while maintaining similar accuracy. This methodology makes the processing of water T2 data faster and easier for the user and will facilitate the utilization of the use of a quantitative water T2 map of muscle in clinical and research studies.
© 2024. The Author(s).
Conflict of interest statement
The authors declare no competing interests.
Figures


Similar articles
-
Improving Accuracy and Reproducibility of Cartilage T2 Mapping in the OAI Dataset Through Extended Phase Graph Modeling.J Magn Reson Imaging. 2025 May;61(5):2116-2127. doi: 10.1002/jmri.29646. Epub 2024 Oct 28. J Magn Reson Imaging. 2025. PMID: 39467097
-
Rapid and accurate dictionary-based T2 mapping from multi-echo turbo spin echo data at 7 Tesla.J Magn Reson Imaging. 2019 May;49(5):1253-1262. doi: 10.1002/jmri.26516. Epub 2018 Oct 17. J Magn Reson Imaging. 2019. PMID: 30328209
-
Myo-regressor Deep Informed Neural NetwOrk (Myo-DINO) for fast MR parameters mapping in neuromuscular disorders.Comput Methods Programs Biomed. 2024 Nov;256:108399. doi: 10.1016/j.cmpb.2024.108399. Epub 2024 Aug 28. Comput Methods Programs Biomed. 2024. PMID: 39236561
-
Streamlined magnetic resonance fingerprinting: Fast whole-brain coverage with deep-learning based parameter estimation.Neuroimage. 2021 Sep;238:118237. doi: 10.1016/j.neuroimage.2021.118237. Epub 2021 Jun 5. Neuroimage. 2021. PMID: 34091035
-
DeepEMC-T2 mapping: Deep learning-enabled T2 mapping based on echo modulation curve modeling.Magn Reson Med. 2024 Dec;92(6):2707-2722. doi: 10.1002/mrm.30239. Epub 2024 Aug 11. Magn Reson Med. 2024. PMID: 39129209
Cited by
-
Deep learning-based acceleration of muscle water T2 mapping in patients with neuromuscular diseases by more than 50% - translating quantitative MRI from research to clinical routine.PLoS One. 2025 Apr 16;20(4):e0318599. doi: 10.1371/journal.pone.0318599. eCollection 2025. PLoS One. 2025. PMID: 40238781 Free PMC article.
-
Diagnosing abdominal neoplasms using a T2 mapping radial turbo spin-echo technique with partial volume correction.Eur Radiol. 2025 Aug 30:10.1007/s00330-025-11931-4. doi: 10.1007/s00330-025-11931-4. Online ahead of print. Eur Radiol. 2025. PMID: 40884612 Free PMC article.
References
-
- Strijkers GJ, et al. Exploration of new contrasts, targets, and MR imaging and spectroscopy techniques for neuromuscular disease—A workshop report of working group 3 of the biomedicine and molecular biosciences COST action BM1304 MYO-MRI. J. Neuromuscul. Dis. 2019;6:1–30. doi: 10.3233/JND-180333. - DOI - PMC - PubMed
MeSH terms
Substances
Grants and funding
LinkOut - more resources
Full Text Sources
