. 2024 Apr;26(4):604-612.
doi: 10.1038/s41556-024-01389-9. Epub 2024 Apr 8.

Transcription bodies regulate gene expression by sequestering CDK9

Affiliations

Transcription bodies regulate gene expression by sequestering CDK9

Martino Ugolini et al. Nat Cell Biol. 2024 Apr.

Abstract

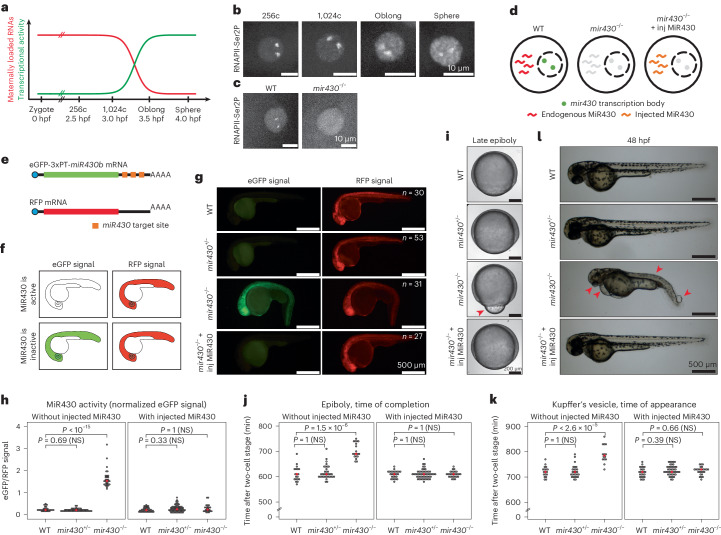
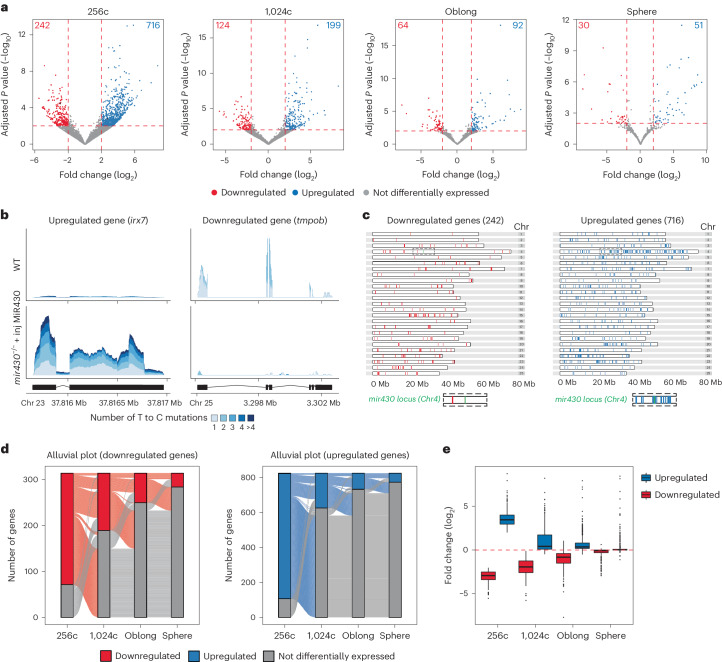
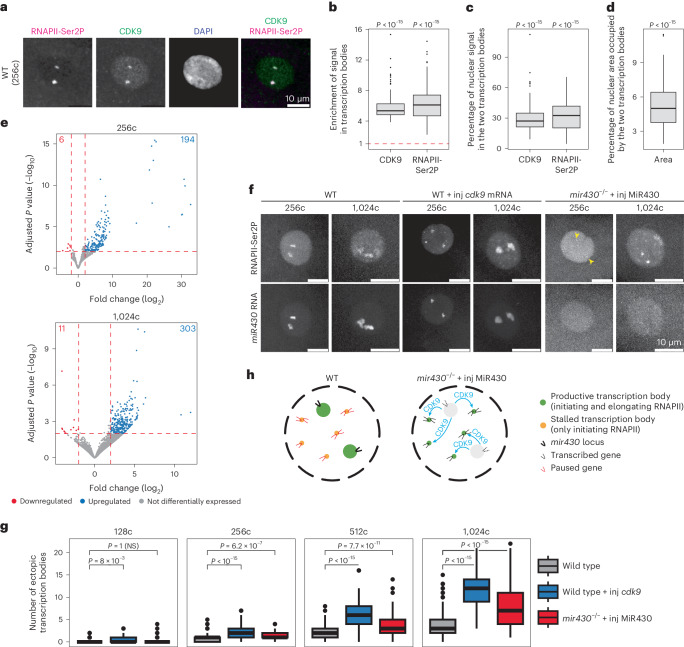
The localization of transcriptional activity in specialized transcription bodies is a hallmark of gene expression in eukaryotic cells. It remains unclear, however, if and how transcription bodies affect gene expression. Here we disrupted the formation of two prominent endogenous transcription bodies that mark the onset of zygotic transcription in zebrafish embryos and analysed the effect on gene expression using enriched SLAM-seq and live-cell imaging. We find that the disruption of transcription bodies results in the misregulation of hundreds of genes. Here we focus on genes that are upregulated. These genes have accessible chromatin and are poised to be transcribed in the presence of the two transcription bodies, but they do not go into elongation. Live-cell imaging shows that disruption of the two large transcription bodies enables these poised genes to be transcribed in ectopic transcription bodies, suggesting that the large transcription bodies sequester a pause release factor. Supporting this hypothesis, we find that CDK9-the kinase that releases paused polymerase II-is highly enriched in the two large transcription bodies. Overexpression of CDK9 in wild-type embryos results in the formation of ectopic transcription bodies and thus phenocopies the removal of the two large transcription bodies. Taken together, our results show that transcription bodies regulate transcription by sequestering machinery, thereby preventing genes elsewhere in the nucleus from being transcribed.


Conflict of interest statement

The authors declare no competing interests.

Figures

Fig. 1
Fig. 1. Disruption of mir430 transcription bodies does not substantially impact development.
a, Schematic representation of the maternal-to-zygotic transition in zebrafish embryos. b,c, Visualization of elongating RNAPII (Ser2P) with Fabs in WT embryos at the 256-cell (256c), 1,024-cell (1,024c), Oblong and Sphere stages (b) and in WT and mir430−/− embryos at the 128-cell stage (c). Shown are representative micrographs of individual nuclei, extracted from a spinning disk confocal microscopy timelapse. d, Schematic representation of a nucleus in WT, mir430−/− and mir430−/− with injected MiR430 embryos. e, Approach to assess rescue of miR430 activity, as previously described. The expression of eGFP encoded by an mRNA with three perfect target sites for miR430 is compared with the expression of RFP encoded by an mRNA without such sites (Methods). f, Schematic representation of expected eGFP and RFP expression in embryos with active and inactive MiR430 microRNA activity. g, Representative micrographs showing eGFP and RFP expression in WT, mir430+/−, mir430−/− and mir430−/ with injected MiR430 embryos at 24 hpf. N = 3 biologically independent experiments. h, Rescue of miR430 activity was assessed in different genotypes at 24 hpf. Normalized eGFP signal in WT, mir430+/− and mir430−/− embryos without (left) and with (right) injected MiR430. N = 3 biologically independent experiments, n = 30 (WT without injected MiR430), n = 53 (mir430+/− without injected MiR430), n = 31 (mir430−/− without injected MiR430), n = 45 (WT with injected MiR430), n = 74 (mir430+/− with injected MiR430), n = 27 (mir430−/− with injected MiR430). Kruskal–Wallis tests were performed (without injected MiR430: χ2 = 67.892, d.f. = 2, P value = 1.809 × 10−15; with injected MiR430: χ2 = 2.5872, d.f. = 2, P value = 0.2743). When this test was statistically significant (P value < 0.05), pairwise comparisons with Bonferroni correction were performed using a pairwise Wilcoxon rank-sum test. A comparison was considered significant when adjusted P value was <0.05, and adjusted P values were reported using WT as reference. i, Rescue of miR430 activity as assessed by epiboly progression. Shown are representative micrographs of embryos at late epiboly stage in different genotypes. The misregulation of yolk internalization in mir430−/− embryos is indicated. j, Time at which epiboly is completed in different genotypes without (left) and with (right) injected MiR430 RNA. N = 3 (without injected MiR430) and N = 4 (with injected MiR430) biologically independent experiments, n = 19 (WT without injected MiR430), n = 34 (mir430+/− without injected MiR430), n = 19 (mir430−/− without injected MiR430), n = 27 (WT with injected MiR430), n = 53 (mir430+/− with injected MiR430), n = 28 (mir430−/− with injected MiR430). Kruskal–Wallis tests were performed (without injected MiR430: χ2 = 38.379, d.f. = 2, P value = 4.635 × 10−9; with injected MiR430: χ2 = 0.00080597, d.f. = 2, P value = 0.9996). When this test was statistically significant (P value < 0.05), pairwise comparisons with Bonferroni correction were performed using a pairwise Wilcoxon rank-sum test. A comparison was considered significant when adjusted P value was <0.05, and adjusted P values were reported using WT as reference. k, Time at which Kupffer’s vesicle appears in different genotypes without (left) and with (right) injected MiR430. N = 3 (without injected MiR430) and N = 4 (with injected MiR430) biologically independent experiments, n = 18 (WT without injected MiR430), n = 27 (mir430+/− without injected MiR430), n = 14 (mir430−/− without injected MiR430), n = 25 (WT with injected MiR430), n = 44 (mir430+/− with injected MiR430), n = 26 (mir430−/− with injected MiR430). Kruskal–Wallis tests were performed (without injected MiR430: χ2 = 26.038, d.f. = 2, P value = 2.218 × 10−6; with injected MiR430: χ2 = 2.543, d.f. = 2, P value = 0.2804). When this test was statistically significant (P value < 0.05), pairwise comparisons with Bonferroni correction were performed using a pairwise Wilcoxon rank-sum test. A comparison was considered significant when adjusted P value was <0.05, and adjusted P values were reported using WT as reference. l, Larvae at 48 hpf for different genotypes. Representative micrographs are shown. The malformation of trunk morphology and eye, the development of heart oedema, and the appearance of blisters at the tail tip in mir430−/− embryos are indicated (red arrowheads). Source numerical data are available in Source data. Source data
Fig. 2
Fig. 2. Disruption of mir430 transcription bodies causes widespread misregulation of gene expression that recovers over time.
a, Volcano plots showing upregulated and downregulated genes in mir430−/− + inj MiR430 (n = 3 biologically independent samples) versus WT (n = 3 biologically independent samples) embryos at 256-cell, 1,024-cell, Oblong and Sphere stages. Wald test with Benjamini–Hochberg correction was performed, and genes with adjusted P values <0.01 were considered significantly differentially expressed. Genes whose coverage is shown in b are shown in black in the left-most plot. b, Coverage plot of irx7 (upregulated) and tmpob (downregulated) in WT and mir430−/− + inj MiR430. The single strata visualize the labelling degree of the reads. c, Distribution of upregulated and downregulated genes across the genome. The mir430 locus on chromosome (Chr) 4 is shown in green and an expansion of its surrounding sequence is shown at the bottom of the panel. d, Alluvial plots showing the overlap between downregulated (left) and upregulated (right) genes at different stages of ZGA. e, Difference in average gene expression between mir430−/− + inj MiR430 and WT embryos across stages for those genes that were identified to be differentially expressed at 256-cell stage (n = 242 downregulated genes and n = 716 upregulated genes). Boxplots show median, quartiles, minimum and maximum, and 1.5× interquartile range. Individual points represent outliers. Source numerical data are available on GEO (GSE248237).
Fig. 3
Fig. 3. Characterization of downregulated genes.
a, Average expression level in transcripts per million (TPM) in WT embryos for all genes (n = 32,428), non-expressed genes (n = 9,545), non-differentially expressed (DE) genes (n = 19,426) and upregulated (n = 716) and downregulated (n = 242) genes (mir430−/− + inj MiR430 versus WT at 256-cell stage). Boxplots show median, quartiles, minimum and maximum, and 1.5× interquartile range. Outliers are not shown. b, Representative images of a DNA-FISH experiment for upregulated genes (green), downregulated genes (magenta) and mir430 (yellow) in a nucleus of a WT embryo at the 256-cell stage. N = 3. Nuclei were also stained with DAPI (blue). Images shown are maximum intensity projections. c,d, Schematic representation of oligopaint probe design for upregulated and downregulated genes (c) and the mir430 locus (d). Primers used for qPCR amplification and their complementarity within a probe are shown. Probe sequences are reported in Supplementary Table 2. Fwd, forward; Rev, reverse. e, Distributions of 3D distances of upregulated (up) genes from the mir430 locus (green) and downregulated (down) genes from the mir430 locus (red) in WT embryos. Quantification of one biological replicate was performed. N = 19 embryos, n = 643 nuclei. Source numerical data are available on GEO (GSE248237).
Fig. 4
Fig. 4. Loss of mir430 transcription bodies causes premature gene activation.
a, Time of induction in WT embryos for the 716 genes that are upregulated in mir430−/− + inj MiR430 versus WT embryos (at 256-cell stage). Expression at 256-cell stage is used as a reference. The genes are split into four groups based on when they are induced (n = 446 induced genes at 1,024-cell stage; n = 51 induced genes at Oblong; n = 83 genes induced at Sphere; n = 136 not induced). The percentage of genes in each group is indicated. Boxplots show median, quartiles, minimum and maximum, and 1.5× interquartile range. Individual points represent outliers. b, Scatterplot representing the fold change in expression between mir430−/− + inj MiR430 and WT embryos at 256-cell stage on the y axis, and between 1,024-cell stage and 256-cell stage in WT embryos on the x axis. All upregulated genes are shown in grey, and genes induced at 1,024-cell stage (62%) are shown in blue. c, Heatmap of chromatin accessibility at 256-cell stage of the 716 genes that are upregulated in mir430−/− + inj MiR430 embryos compared with WT embryos at the 256-cell stage, and—for comparison—the 716 most expressed genes in WT embryos at the 256-cell stage. Genes are ranked by accessibility. d, Graph showing the fraction of promoters of the 716 upregulated (in mir430−/− + inj MiR430 versus WT at the 256-cell stage) and the 716 most expressed genes (in WT at 256-cell stage) amongst the x% most accessible promoters at 256-cell stage in WT embryos. The distribution of non-expressed genes as well as the non-differentially expressed genes (mir430−/− + inj MiR430 versus WT at 256-cell stage) are shown for comparison. e, Scatterplot representing the enrichment ratio (log2) of transcription factor motifs in the promoters (TSS ± 2 kb) of upregulated genes compared with the promoters of not expressed genes (y axis) and the percentage of promoters of the upregulated genes that have the motif (x axis). Only motifs whose corresponding protein is translated during early development were considered, and only motifs with a P value < 0.05 and E-value ≤ 10 are shown. Motifs corresponding to the three pluripotency factors Nanog, Sox19b and Pou5f3 (POU5F1, Pou5f1, Pou5f1::Sox2, POU5F1B, POU2F1, POU2F1::SOX2) are labelled in red. Source numerical data are available in Source data and on GEO (GSE248237 and GSE130944). Source data
Fig. 5
Fig. 5. Loss of mir430 transcription bodies causes ectopic transcription bodies to go into elongation.
a, Visualization of RNAPII-Ser2P and RNAPII-Ser5P with Fabs in WT and mir430−/− + inj MiR430 embryos at 512- and 1,024-cell stages. Shown are representative micrographs of individual nuclei. See Extended Data Fig. 6 for complete cell cycles. N = 3 biologically independent experiments. b, Quantification of Ser5P-positive/Ser2P-negative (red), Ser5P-positive/Ser2P-positive (yellow) and Ser5P-negative/Ser2P-positive (green) transcription bodies during the cell cycle at 512-cell and 1,024-cell stages as shown in a. Number (upper panel) and percentage (lower panel) are shown. N = 3 biologically independent experiments, number of nuclei (n) analysed at each timepoint, in each cell cycle and in each condition (WT and mir430−/− + inj MiR430) are reported. Source numerical data are available in Source data. Source data
Fig. 6
Fig. 6. CDK9 sequestration in mir430 transcription bodies inhibits transcription elongation elsewhere.
a, Visualization of CDK9 and RNAPII-Ser2P by immunofluorescence in WT nuclei at 256-cell stage. Nuclei are labelled with DAPI. bd, Quantification of the enrichment of CDK9 and RNAPII-Ser2P in the two large transcription bodies. The enrichment (observed versus expected signal intensity) (b), the percentage of total nuclear signal present in the two large transcription bodies (c) and the percentage of the total nuclear area occupied by the two large transcription bodies (d) are shown. N = 3 biologically independent experiments, n = 214 nuclei. Wilcoxon rank-sum test was performed to assess if the log2 of the ‘Enrichment of signal in transcription bodies (two-sided)’, the ‘percentage of nuclear signal in two transcription bodies’ (one-sided) and the ‘percentage of nuclear area occupied by two transcription bodies (one-sided)’ are significantly different than zero (V = 23,005 for all tests). A test was considered significant when it had a P value <0.05. Boxplots show median, quartiles, minimum and maximum, and 1.5× interquartile range. Individual points represent outliers. See Methods for a detailed description of quantification. e, Volcano plots showing upregulated and downregulated genes in WT + inj cdk9 mRNA (n = 3 biologically independent samples) versus WT (n = 3 biologically independent samples) embryos at the 256-cell stage (top) and the 1,024-cell stage (bottom). Wald test with Benjamini–Hochberg correction was performed, and genes with adjusted P values <0.01 were considered significantly differentially expressed. f, Visualization of RNAPII-Ser2P with Fabs, and miR430 RNA with MOVIE in WT, WT + inj cdk9 mRNA and mir430−/− + inj MiR430 embryos across stages. Shown are representative micrographs of individual nuclei at 256-cell and 1,024-cell stages, extracted from a spinning disk confocal microscopy timelapse. See Extended Data Figs. 7–9 for complete cell cycles from 128-cell to 1,024-cell stages. g, Quantification of ectopic transcription bodies as shown in b. N = 3 biologically independent experiments; n = 101, 184, 290 and 378 at 128-cell, 256-cell, 512-cell and 1,024-cell stages in WT; n = 43, 82, 127 and 179 at 128-cell, 256-cell, 512-cell and 1,024-cell stages in WT + inj cdk9; n = 45, 65, 97 and 152 at 128-cell, 256-cell, 512-cell and 1,024-cell stages in mir430−/− + inj MiR430, respectively. Boxplots show median, quartiles, minimum and maximum, and 1.5× interquartile range. Individual points represent outliers. See Extended Data Fig. 10 and Methods for a detailed description of quantification. h, Model for the role of transcription bodies in transcription regulation. In WT nuclei, two large transcription bodies are nucleated by the mir430 locus. They sequester CDK9 and potentially other factors that are required for pause release, thereby stalling transcription elsewhere in the nucleus in the initiation state. The specific disruption of the two mir430 transcription bodies leads to a redistribution of CDK9, which results in pause release and the upregulation of genes elsewhere in the nucleus. Source numerical data are available in Source data and on GEO (GSE248237). Source data
Extended Data Fig. 1
Extended Data Fig. 1. Changes in elongating RNAPII signal during ZGA in WT and mir430-/- + inj MiR430 nuclei.
a,b. Visualization of elongating RNAPII (Ser2P) with antigen-binding fragments (Fabs) in WT (a) and mir430-/- + inj MiR430 (b) embryos. Shown are representative micrographs of individual nuclei at 256-cell, 1024-cell, Oblong and Sphere stage, extracted from a spinning disk confocal microscopy timelapse. Nuclei are shown at increasing scale (top) and constant scale (bottom). N = 3 biologically independent experiments for each genotype.
Extended Data Fig. 2
Extended Data Fig. 2. Phenotypic analysis of mir430-/- embryos with and without injected MiR430.
a. Whole mount in situ hybridization (WM-ISH) of Goosecoid (Gsc) in WT, mir430+/-, mir430-/- and mir430-/- + inj MiR430 embryos at Shield stage. Representative micrographs show the embryos in dorsal view. Misexpression (reduced expression levels and reduced extension of expression pattern) of Gsc can be observed in mir430-/- embryos. The fraction in the lower left corner represents the frequency with which the shown phenotype was observed. A schematic representation of the phenotypes is shown below. N = 3 biologically independent experiments. b. Duration of the cell cycle at 128-, 256-, 512-, and 1024-cell stage in WT, mir430+/-, mir430-/- and mir430-/- + inj MiR430 embryos. Measurement based on live bright-field imaging with high temporal resolution (2 frames per minute). N = 3 biologically independent experiments, with n = 29 (WT), 26 (mir430-/-), and 27 embryos (mir430-/- + inj MiR430). Boxplots show median, quartiles, minimum and maximum and 1.5x interquartile range. Individual points represent outliers. At each stage, Kruskal-Wallis tests were performed (128c: χ2 = 0.34364, df = 2, P-value = 0.8421, 256c: χ2 = 0.18903, df = 2, P-value = 0.9098, 512c: χ2 = 0.016565, df = 2, P-value = 0.9918, 1024c: χ2 = 1.0398, df = 2, P-value = 0.5946), none of which was significant (P-value < 0.05). See Methods for a detailed description of the quantification. c. Embryos at 8-Somite stage for WT, mir430+/-, mir430-/- and mir430-/- + inj MiR430 embryos. The reduced body axis extension and the malformation of the optic primordium in mir430-/- embryos are highlighted. Representative micrographs are shown. N = 3 biologically independent experiments. d. Larvae at 24, 48 and 72 hours post fertilization (hpf) for WT, mir430+/-, mir430-/- and mir430-/- + inj MiR430 embryos. The malformation of trunk morphology and of the eye, the development of heart oedema and the appearance of blisters at the tail tip in mir430-/- embryos are highlighted. Representative micrographs are shown. N = 3 biologically independent experiments. The 48hpf stage is also shown in Fig. 1l. Source numerical data are available in source data. Source data
Extended Data Fig. 3
Extended Data Fig. 3. Establishment of enriched SLAM-Sequencing (eSLAM-Seq) in zebrafish embryos.
a. Schematic representation of eSLAM-Seq protocol. See Methods for more detail. b. Representative micrographs of larvae that were/were not injected with 50 nM/embryo of s4UTP at the 1-cell stage. No developmental malformations were observed upon injection. c. Equal amounts of biotinylated and heat-denatured total RNA derived from injected (+) and uninjected (-) embryos at 1024-cell and Sphere stage were run on an agarose gel (left panel). The RNA was then transferred on a nylon membrane and biotinylation detected by Streptavidin-HRP (right panel). Biotinylation was only observed in RNA derived from injected embryos, showing that biotinylation is specific for s4UTP-labeled RNA. N = 2 biologically independent experiments. L: RNA Ladder. d. Box plot representation of mismatch rate in Iodoacetamide- (N = 24) and Ethanol-treated (N = 4) samples. As expected, only Iodoacetamide-treated samples show a high level in A > G (First strand) and T > C (Second strand) mismatch rate. Boxplots show median, quartiles, minimum and maximum, and 1.5x interquartile range. Individual points represent outliers. e. Principal Component Analysis (PCA) plot based on the top 500 genes (selected by highest variance in expression levels). Samples separate according to their developmental stage along the first PC and according to their experimental condition (WT and mir430-/- + inj MiR430) along the second PC. f. Box plot representation of percentage of mitochondrial and nuclear reads, separated by developmental stage (N = 6 biologically independent samples). Most reads are of mitochondrial origin at early ZGA, as shown before, with a gradual increase in the nuclear fraction during later stages. Boxplots show median, quartiles, minimum and maximum, and 1.5x interquartile range. Individual points represent outliers. g. Volcano plot showing up- and downregulated genes in WT + inj MiR430 (n = 3 biologically independent samples) vs. WT embryos (n = 3 biologically independent samples) at 256- and 1024-cell stage. Wald test with Benjamini-Hochberg correction was performed, and genes with adjusted P-values < 0.01 were considered significantly differentially expressed. Source numerical data are available on GEO (GSE248237) and unprocessed blots are available in source data. Source data
Extended Data Fig. 4
Extended Data Fig. 4. The genomic distribution of upregulated genes is similar to that of ZGA genes.
a. Distribution of upregulated genes (mir430-/- + inj MiR430 vs. WT at 256c) across the genome (as in Fig. 2c). The mir430 locus on chromosome 4 is shown in green and a zoom of its surrounding area is shown at the bottom of the panel. b. The enrichment (Observed vs. Expected) of genes shown in (a) on each chromosome. Significant enrichment was calculated using the hypergeometric distribution, and P-values were corrected for multiple testing with the Benjamini-Hochberg method. Significant enrichment (adjusted P-value < 0.05) is shown as blue bars. c. Distribution of ZGA genes (three classes: upregulated in WT 1024c vs. 256c, WT Oblong vs. 256c and WT Sphere vs. 256c) across the genome. d. The enrichment (Observed vs. Expected) of genes shown in (c) on each chromosome. Significant enrichment was estimated using the hypergeometric distribution, and P-values were corrected for multiple testing with the Benjamini-Hochberg method. Significant enrichment (adjusted P-value < 0.05) is shown as blue bars. Source numerical data are available on GEO (GSE248237).
Extended Data Fig. 5
Extended Data Fig. 5. Correlation between expression level in mir430-/- + inj MiR430 vs. WT and 1024-cell, Oblong and Sphere vs. 256-cell in WT embryos.
a. Scatterplots representing the fold change in gene expression (log2 scale) between mir430-/- + inj MiR430 and WT at 256-cell (y-axis), and the fold change in gene expression (log2 scale) between 1024-cell and 256-cell (left), Oblong and 256-cell (central) and Sphere and 256-cell (right) in WT embryos (x-axis). All upregulated genes are shown in grey, and genes induced at 1024-cell are highlighted in blue. The top graph is also shown in Fig. 4b. b-d. Same as in (a) but genes that are highlighted represent genes that are induced at Oblong (b), Sphere (c), or not induced during ZGA (d). Source numerical data are available on GEO (GSE248237).
Extended Data Fig. 6
Extended Data Fig. 6. Stalled transcription bodies go into productive elongation in mir430-/- + inj MiR430 embryos.
Visualization of initiating (Ser5P) and elongating (Ser2P) RNAPII with Fabs in WT (a, c) and mir430-/- + inj MiR430 (b, d) embryos at 512-cell stage (a, b) and 1024-cell stage (c, d). Shown are representative images of individual nuclei, extracted from a spinning disk confocal microscopy timelapse. The micrographs shown in the main figure are highlighted in green. N = 3 biologically independent experiments. Information on quantification can be found in the legend of Fig. 5b.
Extended Data Fig. 7
Extended Data Fig. 7. RNAPII-Ser2P signal in WT, WT + inj cdk9 mRNA and mir430-/- + inj MiR430 embryos at 128-cell stage.
Visualization of RNAPII Ser2P (with Fabs) and miR430 RNA (with MOVIE) in WT (a), WT + inj cdk9 mRNA (b), and mir430-/- + inj MiR430 (c) embryos at 128-cell stage. Shown are representative images of individual nuclei, extracted from a spinning disk confocal microscopy timelapse. N = 3 biologically independent experiments. Information on quantification can be found in Fig. 6g and Extended Data Fig. 10.
Extended Data Fig. 8
Extended Data Fig. 8. RNAPII-Ser2P signal in WT, WT + inj cdk9 mRNA and mir430-/- + inj MiR430 embryos at 256-cell stage.
Visualization of RNAPII Ser2P (with Fabs) and miR430 RNA (with MOVIE) in WT (a), WT + inj cdk9 mRNA (b), and mir430-/- + inj MiR430 (c) embryos at 256-cell stage. Shown are representative images of individual nuclei, extracted from a spinning disk confocal microscopy timelapse. The micrographs shown in the main figure are highlighted in green. N = 3 biologically independent experiments. Information on quantification can be found in Fig. 6g and Extended Data Fig. 10.
Extended Data Fig. 9
Extended Data Fig. 9. RNAPII-Ser2P signal in WT, WT + inj cdk9 mRNA and mir430-/- + inj MiR430 embryos at 512- and 1024-cell stage.
Visualization of RNAPII Ser2P (with Fabs) and miR430 RNA (with MOVIE) in WT (a, d), WT + inj cdk9 mRNA (b, e), and mir430-/- + inj MiR430 (c, f) embryos at 512-cell stage (a, b, c) and 1024-cell stage (d, e, f). Shown are representative images of individual nuclei, extracted from a spinning disk confocal microscopy timelapse. N = 3 biologically independent experiments. Information on quantification can be found in Fig. 6g and Extended Data Fig. 10.
Extended Data Fig. 10
Extended Data Fig. 10. MiR430 injection only modestly affects the number of ectopic transcription bodies.
Quantification of ectopic transcription bodies in WT + inj MiR430. Data for WT, WT + inj cdk9, and mir430-/- + inj MiR430 are the same as in Fig. 6g. N = 3 biologically independent experiments, n = 101, 184, 290 and 378 at 128c, 256c, 512c and 1024c, respectively in WT. n = 43, 82, 127 and 179 at 128c, 256c, 512c and 1024c, respectively in WT + inj cdk9. n = 45, 65, 97 and 152 at 128c, 256c, 512c and 1024c, respectively in mir430-/- + inj MiR430. n = 14, 33, 75, 92 at 128c, 256c, 512c and 1024c, respectively in WT + inj MiR430. Boxplots show median, quartiles, minimum and maximum, and 1.5x interquartile range. Individual points represent outliers. At each stage, Kruskal-Wallis tests were performed (128c: χ2 = 15.685, df = 3, P-value = 0.001315; 256c: χ2 = 107.17, df = 3, P-value < 2.2 × 10−16; 512c: χ2 = 219.57, df = 3, P-value < 2.2 × 10−16; 1024c: χ2 = 413.81, df = 3, P-value < 2.2 × 10−16). When this test was statistically significant (P-value < 0.05), pairwise comparisons with Bonferroni correction were performed using a pairwise Wilcoxon rank-sum test. A comparison was considered significant when adjusted P-value < 0.05, and adjusted P-values were reported using WT as reference. See Methods for a detailed description of quantification. Source numerical data are available in source data. Source data

References

    1. Jackson DA, Hassan AB, Errington RJ, Cook PR. Visualization of focal sites of transcription within human nuclei. EMBO J. 1993;12:1059–1065. doi: 10.1002/j.1460-2075.1993.tb05747.x. - DOI - PMC - PubMed
    1. Ghamari A, et al. In vivo live imaging of RNA polymerase II transcription factories in primary cells. Genes Dev. 2013;27:767–777. doi: 10.1101/gad.216200.113. - DOI - PMC - PubMed
    1. Tsai A, et al. Nuclear microenvironments modulate transcription from low-affinity enhancers. eLife. 2017;6:e28975. doi: 10.7554/eLife.28975. - DOI - PMC - PubMed
    1. Cho WK, et al. Mediator and RNA polymerase II clusters associate in transcription-dependent condensates. Science. 2018;361:412–415. doi: 10.1126/science.aar4199. - DOI - PMC - PubMed
    1. Sabari BR, et al. Coactivator condensation at super-enhancers links phase separation and gene control. Science. 2018;361:eaar3958. doi: 10.1126/science.aar3958. - DOI - PMC - PubMed

Publication types

MeSH terms